


Services on Demand
Journal
Article
 English (pdf)
 Article in xml format
 Article references
 Send this article by e-mail
Indicators
-
 Cited by SciELO
 -
 Access statistics
Related links
-
 Cited by Google
 -
 Similars in
SciELO
Similars in
SciELO -
 Similars in Google
Share

 Permalink
Innovar
Print version ISSN 0121-5051
Innovar vol.21 no.40 Bogotá May./Aug. 2011
Carmen Galve-Górriz* & Vicente Salas-Fumás**
* University of Zaragoza (Spain) Department of Economy and Business Management Faculty of Economic Sciences and Business Studies E-mail: cgalve@unizar.es
** University of Zaragoza (Spain), Department of Economy and Business Management Faculty of Economic Sciences and Business Studies E-mail: vsalas@unizar.es
Recibido: septiembre de 2009 Aprobado: diciembre de 2010
Abstract:
This paper investigates differences in the behaviour and performance of listed Spanish family and non-family firms resulting from the interaction of differences in productive efficiency and in preferences for control between the two groups of firms. We find that family firms grow at a smaller rate, choose less capital-intensive productive technologies and are more efficient in production than non-family firms are. The evidence is consistent with institutional theories of the firm that predict competition among governance forms for the transactions to be governed to minimize production and transaction costs. The results of the paper highlight the relevance of using measures of productive efficiency, instead of measures of profitability, to test the effect of ownership in the performance of firms.
Keywords:
Family firms, ownership and performance, productivity, profitability.
Resumen:
Este trabajo investiga las diferencias en comportamiento y performance de las empresas familiares y no-familiares españolas que cotizan en bolsa, resultado de la interacción de diferencias en eficiencia productiva y en preferencias por el control entre estos dos colectivos de empresas. En el trabajo se obtiene que las empresas familiares crecen a una tasa inferior, eligen tecnologías productivas menos intensivas en capital y son más eficientes en producción que las empresas no-familiares. Sin embargo, no se encuentran diferencias en beneficios económicos, estructura financiera y coste de capital entre ambos colectivos de empresas. Los resultados esclarecen la relevancia de utilizar medidas de eficiencia productiva en lugar de medidas de rentabilidad para contrastar el efecto de la propiedad en el performance de las empresas.
Palabras clave:
empresas familiares, propiedad y performance, productividad y rentabilidad.
Résumé :
Cette étude analyse les différences de comportement et de performance des entreprises espagnoles familiales et non familiales qui cotent en bourse, résultat de l'interaction de différences en efficacité productive et en préférences pour le contrôle de ces deux groupes d'entreprises. Il est ainsi démontré que les entreprises familiales présentent un taux de croissance inférieur, choisissent des technologies productives moins intensives en capital et sont plus efficaces en production que les entreprises non familiales. Il n'y a, par contre, aucune différence concernant les bénéfices économiques, la structure financière et le coût de capital entre les deux groupes d'entreprises. Les résultats déterminent l'importance de l'utilisation de mesures d'efficacité productive au lieu de mesures de rentabilité pour différencier l'effet de la propriété dans la performance des entreprises.
Mots-clefs:
entreprises familiales, propriété et performance, productivité et rentabilité
Resumo:
Este trabalho investiga as diferenças em comportamento e performance das empresas familiares e não-familiares espanholas que operam na bolsa, resultado da interação de diferenças em eficiência produtiva e em preferências pelo controle entre estes dois coletivos de empresas. Neste trabalho obtêm-se que as empresas familiares crescem a uma taxa inferior, elegem tecnologias produtivas menos intensivas em capital e são mais eficientes em produção que as empresas não-familiares. Sem embargo, não se encontram diferenças em benefícios econômicos, estrutura financeira e custo de capital entre ambos os coletivos de empresas. Os resultados esclarecem a relevância de utilizar medidas de eficiência produtiva em lugar de medidas de rentabilidade para contrastar o efeito da propriedade na performance das empresas.
Palavras chave:
empresas familiares, propriedade e performance, produtividade e rentabilidade.
This paper investigates how family ownership shapes the relationship between the preferences, behaviour and performance of family firms compared with the same relationships in non-family ones. We apply the conceptual framework to data from Spanish firms listed on the Stock Market during the period 1990 to 2004. The comparison of the behaviour and performance of family and non-family firms is of interest in itself, according to the large recent literature on the topic. However, the framework of comparative institutional economics (Demsetz, 1983; Williamson, 1985) originally applied to family ownership by Pollak (1985), under which this paper does the comparison, extends its interest into more general methodological issues arising from the study of the relationship between ownership and performance of firms.
Comparative institutional economics predicts that the rational (utility maximizing) behaviour of agents, together with perfect competition in the product market and differences in transaction costs across ownership forms all drive the ownership structure of firms towards an equilibrium where transaction and production costs are minimized. In this equilibrium solution, there are no opportunities to increase wealth by moving a transaction from one ownership form to the other, and economic profits are the same across ownership forms. Demsetz & Lehn (1985) were the first to test for and find empirical support of the hypothesis inspired by comparative institutional economics that, controlling for the characteristics of the transactions that determine the choice of a governance or another one, no differences in profitability are expected among firms of different ownership structure. Other papers (Cho, 1998; Himmelberg, Hubbard & Palia, 1999; Demsetz & Villalonga, 2001) have confirmed the original results.
However, conflicting evidence is also present. Among large US firms, Holderness & Sheehan (1988) find that firms under family ownership create less economic value than non-family firms do. Other studies (McConaughy, Walker, Henderson, & Mishra, 1998; Anderson & Reeb, 2003b; Villalonga & Amit, 2006) find that listed US family firms are more profitable than other listed firms, although the differences in performance can vary depending on whether the family owns, manages or controls the corporation. Sraer & Thesmar (2007) find evidence of superior performance of family firms among listed French corporations. Miller, Breton- Miller, Lester, & Canella (2007) show that differences in performance between family and non-family firms found in previous research may just be the consequence of the definition of family firm used in each paper or in the selection of the sample of firms used to test for the effect of ownership in performance.
Although the results of Miller et al. (2007) contribute to the explanation of the contradictory empirical results and reconcile these results with predictions from institutional economic analysis of organisations, some unexplored issues on the economics of family firms deserve further research. Some of these issues have to do with the cause-effect relationships that link ownership-behavior and performance. Traditional approaches (Baumol, 1959; Williamson, 1964) to the ownership-performance relationship in firms predict that managers controlled firms will have lower profitability than owner controlled ones because the former choose a sales maximizing level of production while the latter choose a production level that maximizes profits. However, both forms of ownership were assumed to produce with the same level of production efficiency.
The transaction-agency cost approaches to the ownership and performance relationship in firms (Jensen & Meckling, 1976; Demsetz, 1983; Fama & Jensen 1983a,b, 1985; Williamson, 1985) predict that contracting costs affect the production possibilities of the firm because they interact with the technology in determining the output that can be produced with a given level of resources (total factor productivity). Therefore, differences in performance do not result from differences in the objective function (maximizing sales or maximizing profits) but from differences in the production possibilities sets. If family ownership implies different contracting costs (between managers and owners and in general among all interested parties) than those of non-family ownership, then we expect differences in productive efficiency between the two forms of ownership for firms of similar size.
Most of the empirical research on ownership and performance of firms, referenced before, compares the profitability (ROA; ROE, q ratio) of different ownership forms. Only a few one compare productive efficiency as the new theories predict (some exceptions are Hill & Snell, 1989, and McConaughy et al. (1998), that compare labour productivity, as well as Galve-Górriz & Salas-Fumás, 1996; Barth, Gulbrandsen, & Schone, 2005; Martikainen, Nikkinen & Vähämaa, 2009, that compare measures of total factor productivity). If differences in productive efficiency would directly translate to differences in measures of financial performance, then the use of productive efficiency or the use of financial measures to test the effect of ownership in performance would be irrelevant. Nevertheless, we argue that a distinct feature of family firms is that the controlling group has stronger preferences for control than controlling shareholders in non-family firms. Under some circumstances, the stronger preferences for control can impose limits in size and growth of family firms that are not present in non-family ones. If this is the case, then differences in financial performance of firms will reflect the interaction between differences in production efficiency and, possibly, the presence of growth-size constraints. In fact, in competitive markets (where firms earn a return equal to the cost of capital), the only way over-constrained firms can survive is if they have higher productive efficiency.
We present empirical evidence from listed Spanish firms that support the hypothesis that family firms are more efficient in production than non-family firms are. The evidence also shows that the two groups of firms have the same financial performance and the evidence that supports the hypothesis that family firms are financially constrained can reconciles the two results. We expect the results shown in the paper hold in samples of firms from other many countries, like Spain, where share ownership in listed firms is highly concentrated (La Porta, López de Silanes, Schleifer, & Vishny, 1999; Morck, Stangeland & Yeung, 2000; Claessens, Djankov & Larry, 2000; Faccio & Lang, 2002). Besides, family control requires the family members to be the controlling shareholder of the company. The exception is firms in the USA and other Anglo Saxon countries where the founders, or their heirs, of listed firms control the firms with small shareholdings. If founders and heirs of firms in Anglo Saxon countries can have control of the firm holding an small percentage of the shares, then it can be expected that family controlled firms in these counties are not so financially constraint than family controlled firms in countries where family control requires majority shareholdings by the family members. Higher productive efficiency of founder-controlled firms that are not financially constrained will outperform other forms of ownership, as the empirical evidence from databases of US firms seems to confirm.
Second Section presents the theoretical background on the economic analysis of the family firm compared with that of firms that do not face the growth/size constraint. Third Section contains a description of the database, and fourth Section is dedicated to the empirical test of the hypothesis and implications from the profit maximization decisions of firms. The conclusions contain a discussion and synthesis of the main results of the paper.
The most defining feature of the family firm is the will to maintain ownership and control of the company in the hands of a group of people who share family ties, together with the will to continue doing so in future generations (Pollak, 1985; Casson, 1999; Chami, 1999). The desire to keep control within people who share family bonds comes from the non-pecuniary benefits the founder or their heirs get from such control, benefits that Demstez & Lehn (1985) refer to as "amenities potential". Of course, the family owners will prefer more economic profits to less but, in general, they assume that the monetary pay-off needed to compensate for the loss of control, and the loss of the amenities potential, is very high.
This paper focuses on cases where family control goes together with high share ownership of family members, since this is the dominant situation among the firms in our data sample. In fact, all firms-family and non-family-in the sample have large shareholders, so the data base is not suitable for comparing performance between firms with high and low share concentrations as in papers by Shleifer & Vishny (1986) and Holderness (2003). Rather, the data are appropriate for comparing the behaviour and performance of firms with different dominant shareholders and, in particular, for comparing firms where the controlling shareholder is a family, with firms where the dominant shareholder is not a family. A key distinction between these two forms of equally highly concentrated ownership is that non-family controlling shareholders only obtain pecuniary benefits from control while families obtain pecuniary and non-pecuniary benefits, such as the amenities potential or the satisfaction of transferring the firm to descendants (Gómez-Mejía, Haynes, Núñez-Nickel, Jacobson, & Moyano, 2007).
The strong preferences for control attached to family ownership implies, for example, that their firms will have to accommodate their path of investment and growth to the availability of financial resources obtained from sources that do not jeopardise the family control of the firm. Investment opportunities that would require issuing new shares sold to non-family shareholders that could interfere with family control will be rejected. The alternative of debt financing will be limited by the restrictions on leverage set by banks. In addition, the possibility that family members subscribe the new shares issued by increasing the part of their private wealth invested in the firm will be limited by the desire to keep a well diversified portfolio of private wealth by each family member. Therefore, assuming that family members are concerned about the diversification of their private wealth and face similar constraints to leverage than non-family firms, we can expect that family firms will be more financially constrained than non-family firms, which are more willing to give up control in their capital investment decisions for a high financial return.
The following hypothesis summarizes this prediction:
Hypothesis 1: Family firms face a growth/size constraint that limits their expansion, compared to that of non-family firms.
If family ownership introduces a constraint that non-family ownership can avoid, then family ownership can only earn higher or equal profits than non-family firms if the exclusive governance advantage of family control provides advantages[2] that compensate the limitation imposed by the growth constraint (Fama & Jensen, 1983a,b; Ang, Cole, & Lin, 2000), as well as other possible disadvantages of family control[3]. The advantages, if they exist, will be in the form of higher productive efficiency resulting from lower transaction costs of governance of family ownership compared with other forms of ownership. Notice that the advantages of family firms must go beyond those resulting from high shareholding concentration, since other non-family control groups-such as banks, other non-financial companies, institutional investors, and personal shareholders with no intention of being succeeded by their heirs-can also hold large blocks of shares and replicate the benefits of high concentration[4].
We then formulate the following hypothesis that is expected to hold especially in firms operating in competitive product markets where constrained family firms must compensate the disadvantage of the growth-size constraint to survive.
Hypothesis 2: Family firms are more efficient in production than non-family firms are.
People could argue that the survival condition of family firms is determined by a utility constraint, rather than the profitability constraint that conditions the survival of non-family ones. Given that utility depends on both profits and the non-pecuniary benefits of family control, family firms in competitive markets may operate under economic losses (return on investment lower than opportunity cost of capital) if amenities potential and non-pecuniary benefits in general compensates for the economic loss. We argue that this may be true for family firms not listed on the stock market but it is unlikely to hold for listed firms, as it is the case in our sample data. In a family firm listed on the stock market, some non-family shareholders do not share the benefits of control and will not accept returns lower than opportunity costs. Therefore, the listed family firms will be forced to earn similar profits than non-family ones to be able to attract minority external shareholders.
Competitive pressures from product markets and the search for efficient ownership and governance forms of firms, together with shareholders' expectations on returns from their investments, will drive surviving firms to earn a return on their invested capital similar across ownership forms.
Hypothesis 3: Listed family and non-family firms obtain similar economic profits.
The financially constrained family firm
Hypotheses 1 to 3 determine the structural conditions and constraints under which firms of different ownership form make their production and investment decisions. In this section, we want to examine the implications for the equilibrium profit-maximizing decisions of firms of such conditions and constraints. This will allow us to derive new empirical predictions that we will be able to empirically test to provide stronger support for the hypothesis.
We consider a representative firm that produces an output sold in the market at price p. Output is produced with two inputs-labour and capital-which are purchased in the market at prices w and c, respectively. Prices are the same for family and non-family firms but we allow for the possibility that the two firms have different production technology. We write the production function of the firm Q = F(K, L; O) where output Q depends on quantities of labour L and capital K, and it also depends of the index O, which captures the effect of ownership on productive efficiency. We assume that the index can take two values-FA, family, and NF, no family ownership. F ( ) is an increasing and concave function in K and L for all values of O (decreasing returns to scale). For operational purposes we write Q = A(O)G(K, L), so the ownership form determines the total factor productivity component of the production technology.
The family firm chooses the profit maximizing level of inputs subject to the distinct production technology (Hypothesis 2) and subject to the condition that total capital is less or equal to the total invested capital compatible with family control, expressed by  [5]:
[5]:
Subject to
The non-family firm solves a similar problem but with a different production technology Q = F(NF; K, L) and without the capital constraint.
Let λ be the Lagrange multiplier of the capital constraint. We can interpret this multiplier as the increase in profit if the binding capital constraint is marginally relaxed and we will refer it as the shadow price of capital. If the constraint is binding at the optimal solution, the first order profit maximizing conditions are as follows,
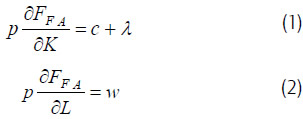
Define  the elasticity of the output Q with respect to input capital K, and
  the same elasticity with respect to labour, L. It is straightforward to show that (1) and (2) imply, for the variables at their optimal values:
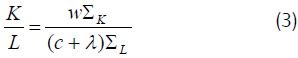
For the unconstrained non-family firm λ = 0. The constraint on total invested assets to protect family control imposes to family firms an implicit additional cost to invested capital equal to the shadow price of capital. This cost is added to the financial cost capital to determine the total unit cost of invested capital.
From (3), the profit maximizing capital to labour ratios of family, FA, and non-family, NF, firms satisfy the condition
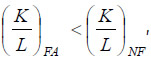
assuming similar elasticity for both firms. We then write the following proposition resulting from the profit maximizing behaviour of family and non-family firms.
Proposition 1: The profit maximizing combination of labour and capital of family and non-family firms implies that the capital per employee of the family firm is less or equal to that of the non-family firm, and strictly lower if the capital constraint is binding.
Proposition 1 has implications for the determinants of the rate of return of the two firms in the optimal solution. The average rate of return on capital for the family firm is given by
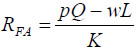
The derivative with respect to K, for labour L fixed at the optimal value, gives
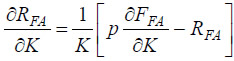
From the first order condition, (1), this can be written as, for the variables at their optimal values,
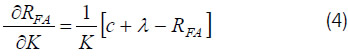
Competition among ownership forms and the hypothesis that shareholders expect similar return from their shares in family and non-family firms will imply, in the equilibrium, that family and non-family firms will earn similar rate of return. If product markets are competitive, the returns will also be equal to the cost of capital: RFA = RNF = c.
Therefore,
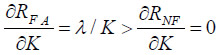
For the unconstraint, non-family firm, we expect the rate of return on invested to be independent of the stock of invested capital. For the family firm, we expect a marginal increase in the stock of invested capital to have a positive effect on the rate of return of the invested capital. The reason is that the family firm is operating at a level of capital equal to that allowed by the financial constraint and at this value of the capital stock the profit function is increasing with the capital stock (positive shadow price of capital). If the capital constraint was not binding, then the shadow price will be zero and the marginal change of the rate of return to changes in the level of constrained capital would be equal to zero for the two firms.
If firms have market power and earn economic profits, then the rate of return will be above the cost of capital. If family and non-family firms earn similar rate of return, then RFA = RNF > c. From (4), non-family firms (shadow price λ = 0) with market power will operate at a point where a marginal increases in capital would produce a decrease in their average rate of return on invested capital. For family firms, the change in average rate of return may be positive or negative depending on whether λ is greater or smaller than RNF - c. In any case, the effect on the rate of return will always be larger for family than for non-family firms.
Proposition 2: The sensitivity of rate of return on invested capital to changes in the stock of invested capital is expected to be non positive for non-family firms and unrestricted in sign for financially constrained family firms.
At the same time, the sensitivity of the rate of return to invested capital in family firms is always greater or equal than the sensitivity in non-family firms, if both firms do business under similar competitive conditions in their labour markets.
Other predictions
One-way family firms have to avoid the financial constraint is to produce with less (more) capital (labour) intensive technologies. So far, we have assumed that technology related differences between family and non-family firms were limited to the total productivity parameter of the production function but it could be realistic to assume that there may be differences in other parameters of the technology too. In particular, preferences for less capital-intensive technologies among family firms would imply that the elasticity of output to capital ΣK in the production function of family firms is lower than that of in non-family firms. In case that there is only one competitive technology in a market and the technology is highly capital intensive, then family firms may be forced to stay out of that market and instead be active in markets where labour intensive technologies are viable. This would imply that the density of family firms is expected to be non homogeneous across industries and, in particular, it would be expected to be higher (lower) in markets where viable technologies are relatively more labour (capital) intensive.
The assumption that the financial structure of family and non-family firms is expected to be similar because both firms care equally about financial leverage and risk can be subject to empirical testing. In fact, the empirical evidence on whether family firms are more leveraged than non-family firms is mixed[6]. Therefore, in the empirical analysis we will also test for differences in leverage between family and non-family firms under the null hypothesis that no differences exist.
The sample of firms used to test the hypothesis on the structural conditions and behaviour predictions of family versus non-family firms includes all non financial and nonregulated firms (for example banks and energy producing firms are excluded from the analysis) listed on the Spanish Stock Exchange in 1990 that continue to be listed on the Exchange in 2004. Fifty-three firms are included in the sample, of them 29 are family firms and 24 are non-family firms. The empirical analysis includes some descriptive information about the time evolution of ownership and shareholdings of Spanish listed firms from 1990 to 2004. However, since the balance sheets and income statements of firms are available only until 2002 (there is regularly a two years delay in accounting reporting and data on shareholding are constantly updated), the tests of the hypothesis and propositions formulated above are done with year and firm data available for the period 1990 to 2002. Moreover, accounting data are incomplete for two firms in the ownership sample so the analysis on behaviour and performance of firms will be limited to 51 firms.
This sample of firms has several advantages for the purpose of this paper. First, the two groups have been subject to the same external shocks during the long period under study (13-15 years). Second, focusing our study on listed firms has the advantage that minority shareholders will only buy shares if they can expect a return that covers the opportunity cost so listed family and non-family firms face a similar minimum profitability constraint[7] as a condition to assure their survival. Third, to open share ownership to non-family members through public offerings is the last resort of family firms to finance growth before selling their block of control. Among family firms, those listed are then the less affected by the growth constraint. Thus, if we find evidence of such constraint in our sample, we can extrapolate the validity of the hypothesis to all family firms. Finally, among Spanish listed firms, shareholding rights are similar to cash flow rights (Crespi & García-Cestona, 2001), so agency problems are reasonably under control and the most relevant governance issue is the difference in the preferences and competencies of the dominant shareholders.
In this paper, a listed company is considered a family firm if the sum of the shareholding (direct and indirect) held by shareholders of the same surname is the largest block holder among all other block holders in the company and any or some members of the family are involved in the management and the board of the firm. This is a more restrictive definition of family firm than those of other papers, such as Anderson & Reeb (2003a, b) and Villalonga & Amit (2006), where a firm is considered a family firm if the founding owner or the heirs occupy significant positions on the board of directors, or in the management of the company. In our sample of firms, shareholdings are highly concentrated so it would be unrealistic to assume that the firm is under family control when a large shareholder holds more shares (voting rights) than family members hold. In our definition of family firm, ownership management and control of the firm by the dominant shareholder will go together, and the distinction made by Villalonga & Amit (2006) in this respect does not apply. Moreover, in all family firms more than one family member is a shareholder, manager or board member. So the class of family firm where only the founding entrepreneur is directly involved in the management and governance of the firm-for which Miller et al. (2007) find differences in financial performance compared with respect to other classes of firms- is empty in our sample. Therefore, we do not need to be concerned about the sensitivity of the results found in the investigation to the definition of family firms, as in Miller et al. (2007), since ownership and control are quite homogeneous across all firms in the sample.
The sources of information used to identify the shareholders and their respective shareholdings are mainly the files of the Spanish National Commission for the Stock Market[8], along with other non-official files such as the Maxwell Directory and company records.
The samples of listed Spanish firms qualifying for the analysis in 1990 consisted of 150 companies. Of them, 57 (38%) had a family as the dominant shareholder, and 93 (62%) did not. Fifteen years later, in 2004 (see Table 1), only 53 firms out of the 150 remain listed (35%). Of them, 29 are family firms and the rest non-family ones. Therefore, the proportion of family firms within the firms that remain listed is now 54.7%, compared with the initial 38%. A few of the firms in the sample had changed ownership form during the period. Two of the family firms that remain listed have become non-family and five firms that began as non-family in 1990 have become family firms. Moreover, among those firms that have been liquidated or are inactive, 13 (14% of all non-family) of them are non-family and 3 (5%) are family firms.
Tables 2 and 3 contain data about the distribution of shares in each of the main control groups identified in the sample of Spanish listed companies: Families, national companies, foreign investors, financial institutions, and State. As shown in Table 2, in all control groups the larger shareholder has, on average, at least 28% of the shares. Among family firms, the average percentage of shares held by the largest shareholder-the family owner-was 49.2 in 1990 and 46.8 in 2004[9]. If we count the shares held by the five largest shareholders, the lowest average percentage of shares in 1990 was 35.8 in the group of firms where the main shareholder was a foreign firm. Differences in shares concentration across control groups remain stable over time. Table 3 shows the shareholdings of the control group and of other types of shareholders, in decreasing order of importance, in 1990 and in 2004. The percentage of shares up to 100 would be, approximately, the free-float of shares in each group. This fraction is rather low and, if anything, it has decreased over time. The massive privatisation process in the late nineties explains why, in 2004, none of the listed firms in the sample is under State control.
The descriptive information of the data set is compiled in Table 4, which contains descriptive statistics, mean and median, separated for family and non-family firms of size, assets' composition, leverage and profitability. The data for the calculation of the values in the table are collected from the balance sheet, income statement and annual reports that listed firms report annually to the CNMV , the national supervisory authority for listed firms, being expressed all variables at constant prices of year 2002[10]. The table also shows the results of the test of the null hypothesis of equal mean and equal median of the variable for family and non-family firms.
For all the size variables (sales, assets, employees and value-added-sales minus cost of inputs purchased to other firms), family firms are significantly smaller than non-family firms are. Regarding to composition of assets, family firms have a lower proportion of fix assets over total assets and a higher proportion of intangible assets than non-family firms do. Family firms also have lower volume of assets per employee (observed capital intensity) than non-family firms do. The test of equal profitability gives mixed results. For example, the mean of ROA (profits before interest and taxes over assets net of accounts payable) is higher in family firms, but the median of Tobin's q (market value of share prices plus book value of debt over net assets of the firm, all variables referred to end of the year) is higher among non-family firms. Family firms also hold relatively less longterm debt than non-family firms do[11].
Differences in size and growth
Hypothesis 1 postulates that family firms are expected to grow at a lower rate and, assuming similar age, be of smaller size than non-family firms are. We can directly test this hypothesis from the relationship between size (assets), age (T), and average growth rate (g) as follows:
AssetsT = Assets0 (1+g)T
Where AssetsT are the current total assets of the firm (in year 2002, last year available) and Assets0 are the (unknown) assets when the firm was created in year 2002 - T. Taking logs, we have Ln AssetsT = Ln Assets0 + T Ln(1+g). Therefore, we formulate the empirical model:

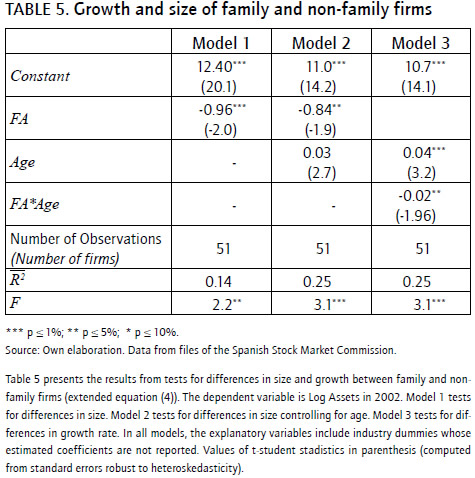
where a = Ln Assets0; b = Ln(1+g) ≈ g; T = Age of the firm, CV are the control variables (industry dummy variables) and ε is a random error term. To test for difference between family and non-family firms, the model is modified adding the variable FA. This is a dummy variable that takes the value of 1 if the firm is a family firm and zero otherwise, and the variable FAT, the product of the dummy FA and age T to allow for differences the averages of size and growth between the two samples of firms.
Table 5 presents the results of the tests of differences in size and growth rates between family and non-family firms. Model 1 tests for differences in the average size in the two groups of firms in 2002, not controlling for differences in age. The negative and statistically significant estimate of the coefficient for the dummy variable FA implies that family firms in average have less assets than non-family ones, controlling for industry effects. The result is similar when we compare sizes controlling for age, column 2. The last column of Table 5 tests for differences in average growth rates between family and non-family firms. The negative estimated coefficient of the variable FAT confirms that family firms grow at a lower real average rate (2%) than non-family firms do (4%).
Differences in capital to labour ratios and differences in the sensitivity of ROA to assets of firms
One implication of the financial constraint is that, when binding, the family firm will choose a ratio of capital to labour lower than the non-family firm works. Table 4 provides preliminary evidence confirming this prediction, since assets per employee are statistically lower in family firms than in non-family firms. That test, however, does not control for possible industry and time effects, so we test for the difference in means of the K/L ratio (assets per employee) controlling for these effects. The new results confirm that the assets per employee in family firms are lower than the assets per employee in non-family firms and that the difference is statistically significant at p <0.001 (see Table 4, variable: Assets / Employees@)[12].
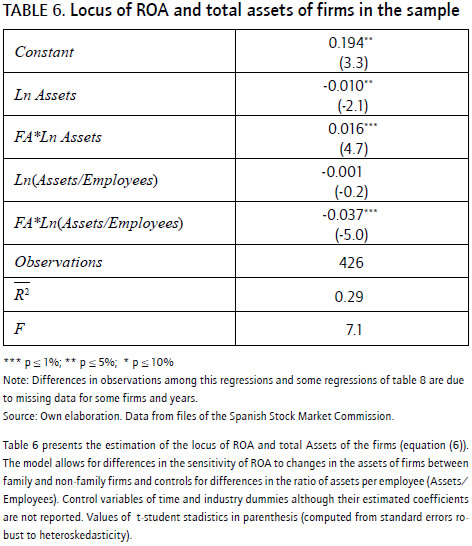
Proposition 2 summarizes the consequences of the size constraint in terms of a positive marginal cost of growth in family firms (shadow price of invested total assets is positive). From an empirical point of view, this result means that the slope of the relationship between return on assets and the total assets of the firm will be higher in the group of family firms. The empirical model to test the proposition 2, equation (4), is formulated as follows:

Where ROA is the return on assets (EBIT/Assets) and CV are the control variables (time and industry dummy variables Assets/Employees to account for possible differences in the production technology). Equation (6) gives the locus of the ROA as a function of the total assets of firms in the sample. The slope of ROA to changes in capital stock K is equal to b/K for the non-family firm and to (b+λ)/K for the family firm (b plus the shadow price). According to the theory, the null hypotheses are that estimated b will be non positive and λ will be positive if the financial constraint is binding.
Table 6 presents the results of the estimation. The estimate negative coefficient of the variable Ln Assets in the group of non-family firms is consistent with the hypothesis that firms in the sample have some market power (ROA above cost of capital). The positive and significant coefficient of the variable FA LnAssets is also consistent with the theory (the sensitivity of ROA to changes in the assets of the firm is higher in family tan in non-family firms) and provides additional evidence supporting the hypothesis that family firms are financially constrained.
Differences in productive efficiency and production technology
In this section, we test Hypothesis 2 on differences in the production efficiency between family and non-family firms. We will measure the productive efficiency of each firm in the sample in terms of Solow's Total Factor Productivity (TFP), obtained from the estimated production function. With the notation introduced in the theory section,
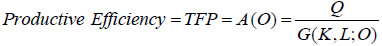
This measure of productive efficiency has significant advantages over partial productivity measures (output per employee, for example), such as those used in Hill & Snell (1989) and in McConaughy et al. (1998). For example, output per unit of labour can be higher in one firm compared to the other because the former uses more capital per unit of labour, not because it is more efficient in production.
If the production function is of the family of Cobb Douglas functions Q = AKαLβ, where A, α and β are positive parameters, A gives a measure of TFP while α and β are the elasticity of output to capital and to labour respectively. If family and non-family firms can use different production technologies, the estimation of the production function should allow for differences in the elasticity parameters, α and β for the two groups of firms. The assumption of higher productive efficiency for the family firm implies that the parameter A satisfies condition AF > ANF.
From the Cobb Douglas specification of the production function, Q = AKαLβ, dividing both sides of the equation by L, and taking logs, the actual model to be estimated is formulated as follows:

where FA is a dummy variable that takes the value of 1 if the firm is a family firm and zero otherwise; a = LnA is the estimation of the log of TFP, and δ = α + β - 1 is a measure of the scale of economies in the production function, so that δ = 0 implies constant returns to scale, δ > 1 increasing returns and δ < 1 decreasing returns. Finally, CV means control variables, in particular dummy variables that control for industry and time effects. Output Q is value added at constant prices of 2002, deflated by the price index of the respective industry; K is measured by the total assets of the firm net of accounts payable, also at constant prices, and L is measured by the number of equivalent full time employees.
The coefficients of the variables multiplied by FA allow for differences in the production function of family and nonfamily firms. For example, a positive and significant estimated value for γ will be consistent with the hypothesis of higher productive efficiency of family firms. The estimated value of η will indicate differences in the elasticity of output to capital between family and non-family firms. For example, a negative estimated value implies lower elasticity of capital and less capital intensity of family firms, compared to non-family firms.
Table 7 presents the results of estimating equation (7); the estimation is performed using OLS with standard errors robust to heteroskedasticity. The first column corresponds to the estimation assuming that the production technologies are the same for the two forms of ownership. The second estimation allows for differences in all the coefficients of the production function of family and non-family firms. The estimated coefficients of the cross-effect variables are all statistically significant, so the null hypothesis of equal production technology is rejected. This result contrasts with that of Martikainen, Nikkinen & Vähämaa (2009) who do not reject the null hypothesis of similar technology for family and non-family firms with data from US firms.
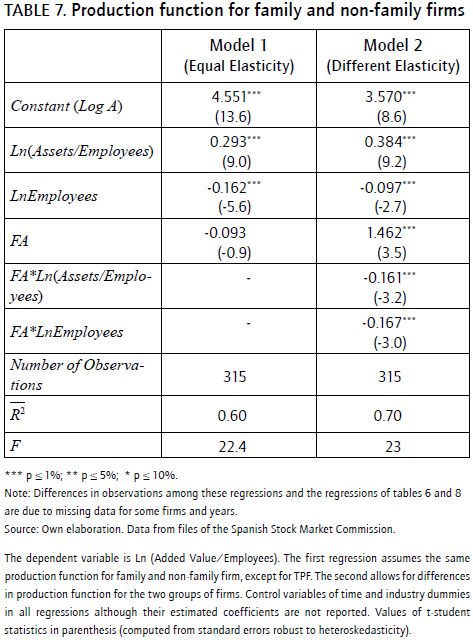
The coefficient of the variable Ln Employees is negative, so there is evidence of decreasing returns to scale. The estimated elasticity of output to capital, α, and elasticity of output to labour, β, are respectively 38.4% and 51.9% for non-family firms. For family firms, the elasticity of output to capital is 22.3% (0.384 - 0.161), significantly lower than for non-family firms, while the elasticity of output to labour in family firms is similar to the elasticity estimated for non-family ones (51.3%)[13]. The empirical evidence confirms that family firms produce with less capital-intensive technologies than non-family firms do. In model 2, the coefficient of the dummy variable FA is significantly greater than zero. This confirms that the total factor productivity (TFP) of the family firm is above the TFP of the non-family firm: family firms are more efficient than non-family firms are in transforming inputs into outputs, within their respective production functions[14].
Profitability and financial variables
We finally test for Hypothesis 3 of equal profitability for family and non-family firms. Additional evidences are provided on the results of testing for differences in financial structure between family and non-family firms. We will measure the profitability of firms in terms of accounting and market based measure of performance. Although the Stock Market list on firms in the sample, it would be unwise to rely only on market-based measures of performance, since many of the firms are highly illiquid, their free float is negligible, and quoted share prices can be highly influenced by prices paid in singular transactions.
Return on assets (ROA) is the main measure of accounting profitability considered in the analysis. To control for possible differences in the cost of capital of firms, we will perform tests of differences in ROA between family and non-family firms, controlling for industry and time period effects, and for the average cost of debt for the firm, r, the proxy for the cost of capital. The return on assets divided by the cost of debt  and Tobin's q are the other performance variables used in the analysis. Taking into account that Tobin's q is equal to market to book values of the assets of the firm and that ROA = EBIT/Assets, then is an approximation to Tobin's q for a firm with no growth opportunities (Market value = EBIT/r).
We also test for differences in the cost of debt r (risk) between family and non-family firms, for differences in leverage, Debt/Assets, and for differences in debt maturity, long term debt over total debt, LTDeb/Debt (now controlling for differences in fixes assets over total assets too).
Table 8 exhibit the main results of the empirical tests 8. Tobin's q is expressed in logs to account for possible heteroskedasticity in the residuals. In all cases, the estimated coefficient of the dummy variable of family ownership, FA, is not statistically significant, so the null hypothesis of equal profitability between the two groups of firms cannot be rejected[15]. The coefficient of the variable cost of debt is positive and significant in column 1; this is the expected result if firms with higher cost of capital have a higher cutoff point in marginal return of investment projects (and higher average return).
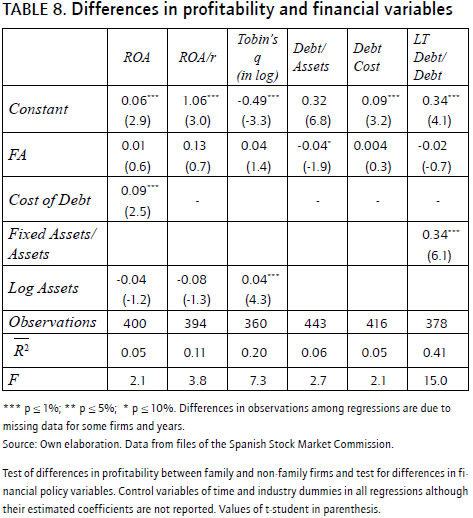
The results of Table 8 also confirm that the null hypothesis of similar financial policies of family and non-family firms is not rejected. Some of the significant differences in the means of financial variables that appear in the descriptive analysis (Table 4) disappear when we control for industry and time effects and for differences in the proportion of fixed over total assets. For example, the evidence indicates that family firms have proportionally more short-term debt than non-family firms do because they also have proportionally less fixed assets in their balance sheets.
Research on family ownership of firms and performance has attracted a lot of attention in recent years with mixed results. Most of this research compares performance, measured in terms of profitability (ROA, Tobin's q). We argue in this paper (drawing from institutional theories of the firm) that the influence of ownership in performance should be tested with measures of productive efficiency since ownership affects the contracting costs (including agency costs) between owners and managers that, in turn, will affect the production possibility set of the firm. Profits may not be perfectly correlated with productive efficiency because less productive firms can have more market power and because firms that are more efficient may be constrained by preferences for control as, we argue in the paper, it is the case with family firms. The paper formalises these arguments and present supportive evidence with Spanish data.
The database for the analysis is constructed from balance sheets and income statements of non regulated firms listed in the Spanish stock market, as well as with information on shareholdings of these listed firms, during the period 1990-2002/2004. We observe that, even controlling for industry effects, family firms in the sample are of smaller in size than non-family ones are, independently of the size variable used in the comparison (sales, assets, employees, value added); the average growth rate over time of total assets in family firms is lower than the average growth rate of non-family firms. We also observe that family firms produce with lower stock of assets per employee and their productive technology differs from that of the non-family firms in two ways: family firms have higher total factor productivity parameter and lower elasticity of output to capital than non-family ones have. Finally, we observe that-in family firms-a marginal increase in the stock of invested assets produces a higher (positive) marginal increase in the rate of return on invested assets than in non-family firms (where the marginal increase is negative). However, we find no differences in average profitability and no differences in financial policies between family and non-family firms.
These evidences are consistent with the hypothesis formulated in the theory part of the paper based on the institutional analysis of firms and markets: competition among ownership forms drive to similar profitability for firms adopting each of them (firms that have characteristics that make the chosen form the more efficient one). In our case, family firms face a investment size constraint derived from their strong preferences for control and overcome this limitation with more productive technology. The analysis also confirms the relevance of making a distinction between productive efficiency and profitability measures of performance in testing predictions about the effect of ownership in the performance of firms. However, our result differ from those obtained in samples of listed US firms during a similar period, which find that family firms are of equal size, produce with the same technology (Martikainen, Nikkinen & Vähämaa, 2009) and are more profitable than non-family firms (Anderson & Reeb, 2003a, Villalonga & Amit, 2006). We think that the observed differences between the US and Spain have to do with institutional factors that we briefly outline below.
In the US, family firms do not face the same growth constraint as family firms in Spain, since they are able to separate family control from family ownership and can dilute family shareholdings without losing control. This is possible because the Anglo-Saxon legal system of governance better protect minority shareholders rights than in the French legal system model. In this last system, minority shareholders are only willing to buy shares of the listed firm if the control group-the family, in our case-holds a large proportion of shares, that is, it holds large cash flow rights that prevent tunnelling and other minority expropriation strategies. Of course, this has a cost since the growth and risk-taking behaviour of firms (innovation) are constrained, compared with what would be in firms where family control does not require family majority shareholdings.
Small and medium-sized Spanish firms, and firms from other countries with similar institutional development, can benefit from legal and regulatory advances that protect the rights of minority shareholders so that talented, innovative entrepreneurs can find cheap equity capital to finance growth by listing the firm on the Stock Exchange. Some initiatives such as the new Governance Code and the new Takeovers Law are steps in this direction.
The results of this paper should be extended to larger samples of firms and should include firms from different countries and different institutional regimes that affect the way family firms address the conflicts arising from preferences for profitability and control. Larger samples would also permit a comparison of structural conditions and behavioural decisions of firms with different controlling shareholders (not only family versus non-family firms). Finally, to find measures of entrepreneurial capital that could be used as explanatory variables of differences in performance would be relevant. This is important to separate the effect of family ownership per se from the idiosyncratic talent of the founder of the firm, when explaining the comparative performance of family firms. Existing evidence from the US (Villalonga & Amit, 2006); Pérez-González, 2006) points that entrepreneurial talent is more important than family shareholdings or board membership in explaining the superior performance of family firms in that country.
[1] The authors thank an anonymous referee for detailed and constructive comments on an earlier version of the paper. The financial support of MCYT, ECO2009-13158ECO is also acknowledged.
[2] Pollak (1985) and Chamil (1999) argued that family relations reinforce cohesion and trust among partners and, at times, among employees. They also argued that family ownership increases the level of commitment to successfully bringing off the managerial project, since the success of the business also enhances the good name of the family (Lyman, 1991; Brokaw, 1992). In addition, that family ownership increases the time horizon of decisions, as it is hoped that future generations will continue to promote the prosperous firm that has been passed on to them (James, 1999; Stein, 1989).
[3] On the negative side, family owners are often more entrenched in relation to non-family block holders, delaying beyond the optimal point in time the substitution of family shareholders by better-qualified professionals in the management positions of the firm, and selecting managers from a smaller pool of managerial talent than non-family firms (Gómez-Mejía et al., 2001; Burkart et al., 2003; Pérez-González, 2006). Additionally, concentration of ownership does not prevent other governance problems arising from conflicts of interest between family members, or distortion of incentives due to altruism or kinship behaviour (Lansberg, 1983; Chami, 1999; Schulze et al., 2001).
[4] Of course, if family firms solve the agency problem of separating management from ownership in a more effective way than other types of large shareholders, then this is an additional advantage. Here, we assume that the entrenchment possibilities due to large shareholdings compensate for the lower agency costs of concentration of ownership, in the same way for family as for non-family block holders.
[5] The value of could be obtained as the result of a utility maximization problem, where utility increases with profits and decreases with size, since larger size implies more dilution of family control rights, subject to the technology constraint of the production function. We have substituted an explicit size constraint in place of explicit utility maximization to simplify the exposition.
[6] Mishra & McConaughy (1999) find that family firms are less leveraged than non-family firms are. However, Anderson & Reeb (2003b) do not find differences in the financial structure of family and non-family firms. Both papers referred to US firms. Schulze et al. (2003) find a U-shaped relation between use of debt and dispersion of ownership within family firms in high growth industries, which is interpreted in terms of response to agency problems of family ownership.
[7] If all financing of the firm came from family members, the comparison of profitability between family and non-family firms could be distorted because family firms have non-pecuniary benefits of control that compensate for lower profitability. In their analysis of the efficiency of family ownership, Schulze et al. (2001) and Gómez- Mejía et al. (2001) ignore the non-pecuniary benefits of control as part of the utility received by owners and managers of family firms.
[8] In Spain, listed companies are required to report to the National Commission the names and shareholdings of shareholders with blocks of shares of 5% or more, and any holdings of those people who sit on the board of directors, and if these shareholders are involved in the management of the firm.
[9] These figures are again in sharp contrast to those of Anderson & Reeb (2003a) and Villalonga & Amit (2006) in their S&P and Fortune 500 samples, where average shareholdings of family members in family firms are 18% and 16% respectively.
[10] Public Accounting data of firms are available with two years of delay while data on shareholdings is updated permanently. This explains that data on ownership and shareholdings run 1990 to 2004 while data from accounting statements end in 2002.
[11] To compare our sample with that of Anderson & Reeb (2003a) for the USA may be of interest. Their sample size is 319 firms from the S&P 500 and covers the period 1993 to 1999. Around 33 per cent of the firms have members of the founding family in management or board positions. Non-family firms are larger than family firms (average assets of 16,433 millions and 9,560 millions of dollars, respectively) but also 12 years younger, on average, for a total of 78 years. In our sample, the proportion of family firms is larger (38%), their average size is smaller, 67 millions of euros and have the same average age than non-family ones. Villalonga & Amit (2006) also report around one third of family firms in their Fortune 500 sample, although they do not observe differences in size between the two ownership groups. In the sample of Miller et al. (2007), family firms are smaller than non-family firms but the former are also younger than the later so differences in size are likely to disappear when controlling for age.
[12] The limited sample size and the high aggregation of economic sectors used in this paper do not allow us to compare the distribution of family firms across industries. With a sample size of over 1725 family and non-family Spanish manufacturing firms, listed and non listed on the Stock Market, Galve & Salas (2003) find that the proportions of family and non-family firms are unevenly distributed across manufacturing sectors, with a higher proportion of the former in more labour intensive sectors than in more capital intensive ones.
[13] To obtain the estimated elasticity of output to labor, we know that δ = α+β-1 so the elasticity of output to labor for non-family firms will be βNF = δNF-αNF+1 = -0.097-0.384+1=0.519; and for family firms will be given equal to βFA = (δNF+ δFA)-(αNF+ αFA) +1 = (-0.097-0.167)-(0.384-0.161) + 1= 0.513.
[14] We have performed some robustness tests of the results estimating the model with firms' fixed effects. The coefficients of the firms' dummy variables can be interpreted as the total factor productivity parameter of the respective firm, so we test of differences in productive efficiency between family and non-family firms amounts comparing the average of estimated coefficients for family and for non-family firms (controlling for sector effects). If we assume the same production function for family and for non-family firms, we do not find differences between productive efficiency of the two forms of ownership. When we allow for differences in the production function, we find that elasticity of output with respect to capital is lower in family than in non-family firms, while the elasticity of output to number of workers is the same in the two groups. Moreover, in this case we find that the productive efficiency of family firms is higher on average than that of non-family firms. Therefore, the empirical results are the same when we estimate with firms' fixed effects than when we estimate with no fixed effects. With the aim of detecting whether there is endogeneity to the choice of family control, we have also used the methodology called effects of treatment with Heckman correction (1974, 1979) in two stages; in the first stage we estimate a probit model in which the decision of being a company under family control depends on the value of a latent variable, which is function (according to the theoretical model exposed) of the size, risk and main activity that the company caries out. From the estimations made with the probit model, we obtain an estimation of the reverse of Mills ratio which is incorporated into the second stage, corresponding to the model that analyzes the efficiency, to correct by the effects of self-selection in the process of decision be or not family business. The estimation of the probit model results show an inverse relationship between the size of the firm and the family control, being the ownership structure independent of the risk. Concerning the statistics of the goodness of fit the probit model of the first stage, the Wald tests leads us to reject the null hypothesis that the coefficients of the variables equal zero and therefore accepted the joint significance used variables. The estimates obtained in the first phase of the model gets a measure of lambda that is incorporated as an explanatory variable in the productive efficiency model (equation (6)). The estimation of the (6) model results show that this variable (lambda) is statistically significant and, with respect to the rest of the model variables, corroborates the results presented in Table 7.
[15] Tobin's q is positively correlated with the size of the firm. If size is excluded from the regression, the estimated coefficient of FA is negative and non-significant. We do not include ROA, risk, leverage and other related variable in the model, as other papers do, because the q ratio already incorporates the value of these variables through the market value of the firm. In any case, the q ratio is positively correlated with ROA and ROA/r. We have also made profitability analysis using the methodology of treatment with Heckman correction effects in two stages to correct by the variable "family control" endogeneity. In the first stage, we estimate a probit model in which the decision in a company under family control depending on the value of a latent variable which (according to the theoretical model exposed) is function of the size, risk and main activity that the company carries out. From the estimations made with the probit model, we obtain an estimation of the reverse of Mills ratio which is incorporated into the second stage, corresponding to the model that analyzes profitability, to correct by the effects of selfselection in the process of decision be or not family business. The estimation of the probit model results, already discusses the note footnote 14, show that there is an inverse relationship between size of the company and the family control, being the ownership structure independent of the company risk. The estimations obtained in the first phase of the model gets a measure of lambda which is incorporated as an explanatory variable more to profitability analysis model. Results from the estimations show that this variable (lambda) is not statistically significant for any measures of profitability; so it is not necessary to incorporate models to avoid the problem of selection bias, and secondly, and to the rest of the model variables, corroborate the results presented in table 8.
Adams, R. B., Almeida, H. & Ferreira, D. (2004). Understanding the relationship between founder-CEO and firm performance. Working Paper, New York University. [ Links ]
Anderson, R.C. & Reeb, D.M. (2003a). Founding-family ownership and firm performance: Evidence from the S&P 500. Journal of Finance, 58, 1301-1329. [ Links ]
Anderson, R. C. & Reeb, D.M. (2003b). Founding-family ownership, corporate diversification and firm leverage. Journal of Law and Economics, 46, 653-684. [ Links ]
Anderson, R. C. & Reeb, D.M. (2004). Board composition: balancing family influence in S &P 500 firms. Administrative Science Quarterly, 49, 209-237. [ Links ]
Ang, J., Cole, R. & Lin, J. (2000). Agency cost and ownership structure. Journal of Finance, 55, 81-106. [ Links ]
Barth, E., Gulbrandsen, T. & Schone, P. (2005). Family ownership and productivity: the role of owner-management. Journal of Corporate Finance, 11, 107-127. [ Links ]
Baumol, W. (1959). Business behaviour, value and growth. New York: McMillan. [ Links ]
Brokaw, L. (1992). Why family firms are best. Inc., 143, 72-81. [ Links ]
Burkart, M., Panunzi, F. & Shleifer, A. (2003). Family firms. Journal of Finance, 58, 2167-2202. [ Links ]
Casson, M. (1999). The economics of family firm. Scandinavian Economic History Review, 47, 10-23. [ Links ]
Chaganti, R. & Damanpour, F. (1991). Institutional ownership, capital structure, and firm performance. Strategic Management Journal, 12, 479-491. [ Links ]
Chami, R. (1999). What is different about family businesses? Working Paper 01/70, Notre Dame University and International Monetary Fund Institute. [ Links ]
Cho, M. (1998). Ownership structure, investment and the corporate value: An empirical analysis. Journal of Financial Economics, 63, 654-667. [ Links ]
Claessens, S., Djankov, S. & Larry, H.P. (2000). The separation of ownership and control in East Asian Corporation. The Journal of Financial Economics, 58, 81-112. [ Links ]
CNMV, Annual Reports of Listed Spanish Companies. 1990-2004. [ Links ]
Crespi, R. & García-Cestona, M.A. (2001). Ownership and control of Spanish listed firms. In Barca, F. & Becht, M. (Eds.), The control of corporate Europe. Oxford University Press. [ Links ]
Demsetz, H. (1983). The structure of ownership and the theory of the firm. Journal of Law and Economics, 25, 375-390. [ Links ]
Demsetz, H. & Lehn, K. (1985). The structure of corporate ownership: Causes and consequences. Journal of Political Economy, 93, 1155-1177. [ Links ]
Demsetz, H. & Villalonga, B. (2001). Ownership structure and corporate performance. Journal of Corporate Finance, 7, 209-233. [ Links ]
Espinosa, M. (1990). Directorio de accionistas, [Directory of Shareholders]. Unión Editorial S.P.A. [ Links ]
Faccio, M., Lang, L.H.P. & Young, L. (2001). Dividends and expropriation. American Economic Review, 91, 54-78. [ Links ]
Fama, E. & Jensen, M. (1983a). Separation of ownership and control. Journal of Law and Economics, 26, 301-325. [ Links ]
Fama, E. & Jensen, M. (1983b). Agency problems and residual claims. Journal of Law and Economics, 26, 327-329. [ Links ]
Franks, J. Mayer, C. & Rossi, S. (2004). Spending less time with the family: The decline of family ownership in the UK. Finance Working Paper, 35. European Corporate Governance Institute. [ Links ]
Galve-Górriz, C. & Salas-Fumás, V. (1996). Ownership structure and firm performance: Some Empirical Evidence from Spain. Managerial and Decision Economics, 17(6), 575-586. [ Links ]
Galve-Górriz, C. & Salas-Fumás, V. (2003). La empresa familiar en España. Fundamentos económicos y resultados. Fundación BBVA. [ Links ]
Gómez-Mejía, L., Núñez-Nickel, M. & Gutiérrez, I. (2001). The role of family ties in agency contracts. Academy of Management Journal, 44, 81-95. [ Links ]
Gómez-Mejía, L., Haynes, K., Núñez-Nickel, M., Jacobson, K. & Moyano, J. (2007). Socioemotional wealth and business risks in family-controlled firms: Evidence from Spanish olive oil mills. Administrative Science Quarterly, 52(1), 106-137. [ Links ]
Heckman, J. (1974). Shadow prices, market wages, and labor supply. Econometrica, 42, 679-694. [ Links ]
Heckman, J. (1979). Sample selection bias as a specification error. Econometrica, 47, 153-161. [ Links ]
Hill, C.W.L. & Snell, S.A. (1989). Effects of ownership and control on corporate productivity. Academy of Management Journal, 32, 25-46. [ Links ]
Himmelberg, C., Hubbard, R.G. & Palia, D. (1999). Understanding the determinants of managerial ownership and the link between ownership and performance. Journal of Financial Economics, 53, 353-384. [ Links ]
Holderness, C.G. & Sheehan, D.P. (1988). The role of majority shareholders in publicly held corporations. Journal of Financial Economic, 20, 317-346. [ Links ]
Holderness, C.G. (2003). A survey of block holders and corporate control. Economic Policy Review, (April), 51-63. [ Links ]
James, H.S. (1999). Owner as manager, extended horizons, and family firm. International Journal of the Economics of Business, 6, 41-56. [ Links ]
Jensen, M.C. & Meckling, W. (1976). Theory of the firm: Managerial behaviour, agency costs and ownership structure. Journal of Financial Economics, 34, 305-360. [ Links ]
La Porta, R., López de Silanes, F., Schleifer, A. & Vishny, R. (1998). Law and finance. Journal of Political Economy, 106, 1113-1155. [ Links ]
La Porta, R., López de Silanes, F., Schleifer, A. & Vishny, R. (1999). Corporate ownership around the world. Journal of Finance, 54, 471-517. [ Links ]
Lansberg, I. (1983). Managing human resources in family firms: The problems of institutional overlap. Organizational Dynamics, (Summer), 39-46. [ Links ]
Lyman, A. R. (1991). Customer service: Does family ownership make a difference? Family Firm Review, 43, 303-324. [ Links ]
McConaughy, D.L., Walker, M., Henderson, G.V. & Mishra, C.S. (1998). Founding family controlled firms: Efficiency and value. Review of Financial Economics, 7, 1-19. [ Links ]
Martikainen, M., Nikkinen, J. & Vähämaa, S. (2009). Production functions and productivity of family firms. Evidence from S&P 500. The Quarterly Review of Economic and Finance, 49, 295-307. [ Links ]
Miller, D., Breton-Miller, I.L., Lester, R.H. & Canella, A.A. (2007). Are family firms really superior performers? Journal of Corporate Finance, 13, 829-858. [ Links ]
Mishra, C.S. & McConaughy, D.L. (1999). Founding family control and capital structure: The risk of loss of control and the aversion to debt. Entrepreneurship Theory and Practice, (Summer), 53-64. [ Links ]
Morck, R.K., Stangeland, D.A. & Yeung, B. (2000). Inherited wealth corporate control and economic growth: The Canadian disease. In R. Morck (Ed.), Concentrated corporate ownership. National Bureau of Economic Research Conference. University of Chicago Press. [ Links ]
Palia, D. & Ravid, A. (2002). The role of founders in large companies: Entrenchment or valuable human capital? Working Paper, Rutgers University. [ Links ]
Peng, M. & Jiang, Y. (2004). Family ownership and control in large corporations: The good, the bad, the irrelevant. Presented at the Academy of Management Meeting New Orleans. [ Links ]
Pérez-González, F. (2006). Inherited control and firm performance. American Economic Review. Forthcoming. [ Links ]
Pollak, R. (1985). A transaction cost approach to familiar and households. Journal of Economic Literature, 23, 581-608. [ Links ]
Schulze, W., Lubatkin, M. & Dino, R. (2003). Exploring the agency consequences of ownership dispersion among the directors of private family firms. The Academy of Management Journal, 46(2), 179-195. [ Links ]
Schulze, W., Dino, R., Lubatkinm, M. & Bucholtz, A. (2001). Agency relationships in family firms: Theory and evidence. Organization Science, 22, 99-116. [ Links ]
Shleifer, A. & Vishny, R. (1986). Large shareholders and corporate control. Journal of Political Economy, 94, 461-488. [ Links ]
Sraer, D. & Thesmar, D. (2007). Performance and behaviour of family firms: Evidence from the French Stock Market. The Journal of the European Economic Association, 5(4), 709-751. [ Links ]
Stein, J. (1989). Efficient capital markets, inefficient firms: A model of myopic corporate behaviour. Quarterly Journal of Economics, 103, 655-669. [ Links ]
Thomsen, S. & Pedersen, T. (2000). Ownership structure and economic performance in the largest European companies. Strategic Management Journal, 21, 689-705. [ Links ]
Villalonga, B. & Amit, R. (2006). How do family ownership, control and management affect firm value? Journal of Financial Economics, 80, 385-417. [ Links ]
Williamson, O.E. (1964). The economics of discretionary behaviour: Managerial objectives in a theory of the firm. Englewood Cliffs, NJ: Prentice-Hall. [ Links ]
Williamson, O.E. (1985). The economic institutions of capitalism. New York: Free Press. [ Links ]
