


Servicios Personalizados
Revista
Articulo
 Inglés (pdf)
 Articulo en XML
 Referencias del artículo
 Enviar articulo por email
Indicadores
-
 Citado por SciELO
 -
 Accesos
Links relacionados
-
 Citado por Google
 -
 Similares en
SciELO
Similares en
SciELO -
 Similares en Google
Compartir

 Permalink
Innovar
versión impresa ISSN 0121-5051
Innovar vol.25 no.55 Bogotá ene./mar. 2015
https://doi.org/10.15446/innovar.v25n55.47230
Fruit and Vegetable Prices and Perceptions in Mercalaspalmas Wholesale Market
Los precios y las percepciones de las frutas y verduras en el mercado mayorista de mercalaspalmas
Prix des fruits et legumes dans le mercalaspalmas wholesale Market
Preços das frutas e Legumes e percepções em mercalaspalmas, mercado atacadista
Santiago Rodríguez-FeijoóI, Alejandro Rodríguez-CaroII, Carlos González-CorreaIII
I Associate Professor, University of Las Palmas de Gran Canaria, Canary Island, Spain. PhD in Economics. Department of Quantitative Methods for Economics and Management.
Country: Spain.
E-mail: santiago.rodriguezfeijoo@ulpgc.es
II Associate Professor, University of Las Palmas de Gran Canaria, Canary Island, Spain. PhD in Economics. Department of Quantitative Methods for Economics and Management.
Country: Spain.
E-mail: alejandro.rodriguez@ulpgc.es
III PhD in Economics. E-mail: cgoncor@gmail.com
Correspondecia: Santiago Rodríguez Feijoo. Facultad de Economía, Empresa y Turismo. Universidad de Las Palmas de Gran Canaria. Campus Universitario de Tafira. 35017 - Las Palmas de Gran Canaria - España.
Citación: Rodríguez-Feijoó, S., Rodríguez-Caro, A., & González-Correa, C. (2015). Fruit and Vegetable Prices and Perceptions in Mercalaspal-mas Wholesale Market. Innovar, 25(55), 145-155. doi: 10.15446/ innovar.v25n55.47230.
Clasificación JEL: D4, C32, Q11.
Recibido: Febrero de 2011, Aprobado: Agosto de 2013.
Abstract:
This paper studies the behavior of fruit and vegetable prices in a wholesale market. Its aims are: a) to examine price behavior and changes; and b) to identify statistically significant factors in the perception of prices and to quantify the effect of these factors on the market price. For this purpose, daily data were obtained on modal prices at the Mercalaspalmas wholesale market from 2006 until mid-2010. The results obtained show there is a similar degree of flexibility in price increases and decreases, and show the product to be the determinant element in setting prices. There was found to be a strong degree of price permanence, in the sense that changes take place slowly and following a lag. The following significant factors were identified in the perception of prices: the length of time a price has remained unchanged in the market; the period during which a product has been absent from the market; the quantities traded at a given price; and the index of market prices. However, the quantitative effect of this body of factors on the perceived price is very limited.
Key Words: Wholesale price, price perceptions, partial adjustment hypothesis.
Resumen:
En este artículo se estudia el comportamiento de los precios de las frutas y hortalizas en un mercado mayorista. Los objetivos que se pretenden son: a) explorar el comportamiento de los precios y sus cambios y b) identificar factores estadísticamente significativos en la precepción de los precios y cuantificar su efecto sobre el precio de mercado. Para ello se usan datos diarios de precios modales obtenidos del mercado mayorista Mer-calaspalmas desde el año 2006 hasta mediados del 2010. Los resultados muestran una flexibilidad similar en el aumento y en la reducción de precios e identifican al producto como elemento determinante en la fijación de los precios. se estima una fuerte permanencia del precio, en el sentido de que sus cambios se hacen con retraso y de forma lenta, y se identifican como factores significativos en la percepción de los precios los siguientes: el tiempo que un precio lleva en el mercado, el tiempo que un producto lleva sin cotizar en el mercado, las cantidades comercializadas a un mismo precio y el índice de precios del mercado. sin embargo, el efecto cuantitativo de este conjunto de factores sobre el precio percibido es muy reducido.
Palabras clave: Precio mayorista, precios percibidos, hipótesis de ajuste parcial.
Résumé:
Dans cet article nous étudions le comportement des prix des fruits et légumes dans un marché de gros. les objectifs sont : 1) explorer le comportement des prix et leurs variations, et 2) identifier des facteurs statistiquement significatifs dans la perception des prix et quantifier leur effet sur le prix du marché. Pour cela nous utilisons des données quoti-diennes de prix moyens obtenus sur le marché de gros Mercalaspalmas de l'année 2006 à la mi-2010. Les résultats révèlent une flexibilité similaire à la hausse comme à la baisse des prix et identifient le produit comme élément déterminant dans la fixation des prix. On considère une forte sta-bilité du prix, en ce sens que ses changements se font avec retard et lente-ment, et les facteurs identifiés comme significatifs dans la perception des prix sont : le temps depuis lequel un prix est sur le marché, le temps qu'un produit est resté sans être coté sur le marché, les quantités commerciali-sées à un même prix et l'indice de prix du marché. Cependant, l'effet quan-titatif de cet ensemble de facteurs sur le prix perçu demeure très réduit.
Mots-clés: Prix de gros, prix perçus, hypothèse d'ajustement partiel.
Resumo:
Neste artigo, é estudado o comportamento dos preços das frutas e legumes em um mercado atacadista. Os objetivos pretendidos são: a) Explorar o comportamento dos preços e as suas mudanças, e b) Identificar fatores estatisticamente significativos na percepção dos preços e quantificar o seu efeito sobre o preço de mercado. Para isso são utilizados dados diários de preços modais obtidos do mercado atacadista Mercalas-palmas desde o ano de 2006 até meados de 2010. Os resultados mostram uma flexibilidade semelhante no aumento e na redução de preços e identificam o produto como elemento determinante na fixação dos preços. É estimada uma forte permanência do preço, no sentido de que as suas mudanças chegam atrasadas e lentamente, e se identificam como fatores significativos na percepção dos preços os seguintes: O tempo que um preço leva no mercado, o tempo que um produto leva sem cotar no mercado, as quantidades comercializadas a um mesmo preço e o índice de preços do mercado. No entanto, o efeito quantitativo deste conjunto de fatores sobre o preço percebido é muito reduzido.
Palavras-chave: Preço atacadista, preços percebidos, hipóteses de ajuste parcial.
Introduction
Many studies have examined how retail prices vary. The reason for this is that price rigidity is a key factor in explaining how production varies in response to demand shocks, and is related to the question of efficiency in the location of resources. In early studies, the data used were aggregated, but from 1980 onwards, microdata for prices were incorporated (see references in Baharad & Eden, 2004).
Nevertheless, no comparable studies have been conducted on price behavior in wholesale markets. In fact, according to Matsui (2010), "empirical research specifically dealing with wholesale prices is still rare in the literature" (p. 2381). Such studies are essential to reveal how market power changes along the production chain, from producers to consumers. For example, Jaleta and Gardebroek (2007) argue that the wholesale market price affects farm-gate price negotiations. Consequently, our initial aim is to fill part of this gap in the literature by examining and describing prices and their changes in a fruit and vegetable wholesale market.
The second main objective of this paper is to identify factors that measure the way in which actors in the wholesale market perceive prices. There is an ample body of literature on the question of price perception, but in this respect, too, empirical applications have tended to concentrate on retail prices. For a review of alternative models for prices and price perception, see Niedrich, Sharma and Wedell (2001).
The perception variable of price is a non-observable variable. The price observed is a consequence of how market agents perceive it will change in the future in accordance with its known history. According to Barro (1972), "optimal adjustment of X (price) depends on the anticipated future behavior of the target (price of equilibrium)" (p. 18). Thus, observed prices vary in accordance with the discrepancy between perceived and observed prices. It is logical to believe that in a balanced and competitive market, the observed price would coincide with the price perceived by market agents. In this situation, the equilibrium price coincides with the balanced market price.
If this is the case, the partial adjustment hypothesis can be applied to identify significant factors in the behavior of perceived prices (Otero, 1993). According to this hypothesis, a change in observed prices is a fraction of the change required for the perceived price to coincide with the observed price. The use of this hypothesis has two important implications: In the first place, market factors affect observed and perceived prices in the same direction (i.e. with the same sign). Secondly, the quantitative effect on observed prices coincides with the short-term effect, while the quantitative effect on perceived prices is the total effect presented by observed prices.
Seasonal factors are assumed to influence prices. Note that these seasonal factors are global and do not correspond to individual products, which have their own seasonal components. What we wish to test is whether there is a seasonal component in the perception of market prices as a whole. Secondly, we believe that the perception of a product's price depends on the length of time during which this price has not altered, and on the quantities that have been traded at that price. Demand is a key factor in any theory of price adjustment (Barro, 1972). We also believe that perception of price depends on the time that has passed since a product was traded, and on the global index of market prices being used as the reference price (Niedrich et al., 2001). Once again, our aim is to examine whether these variables influence the market at a global level. Although other variables could obviously be considered to affect the perception of prices, our hypothesis regarding these other variables is that they are contemporaneously uncorrelated with the explicative variables examined in this study.
The empirical evidence used to test the above hypotheses was obtained from the Mercalaspalmas fruit and vegetable wholesale market on the island of Gran Canaria (Spain). This market is held within a specific physical space in which producers and intermediaries can interact, and its purpose is the trading of products for subsequent sale, in most cases to the final consumer. This market is, in principle, much more transparent than the retail market, which is comprised of a group of establishments and of a large number of consumers; each establishment is a single part of the market, physically separated from the rest, and the consumer must move from one establishment to another in order to obtain all available information. Based on the existence of information asymmetry, Sibly (2001) affirms, "that retail markets in which buyers make repeat purchases exhibit price inflexibility" (p. 459). Conversely, in a market held in a single physical space in which all sellers and buyers are present, the costs of information are much lower and more symmetrical, and levels of transparency are much higher, giving rise to a more competitive market, which should produce a high level of price flexibility. In this market, prices are set according to the conditions of market access.
At this point, it is important to note that the empirical basis is obtained with respect to a market that is to a certain point a captive one, for both buyers and sellers. By this we mean that it is an insular market; its predominant position (in the context of an island) means that fruit and vegetable producers are obliged to sell there, while for small-scale wholesalers it is their sole source of supply, as they lack the size and resources to profitably turn to other markets.
Materials and Methods
Methods
The methodology applied was comprised of two types of analysis, corresponding to the specific objectives pursued. Firstly, for the descriptive goal of exploring patterns of price movements, the analysis performed was similar to that described in previous studies of consumer prices (Alvarez & Hernando, 2006; Baharad & Eden, 2004; Baudry, Le Bihan, Sevestre & Tarrieu, 2005; Baudry, Le Bihan, Sevestre & Tar-rieu, 2007; Bils & Klenow, 2004; Carlton, 1986; Cecchetti, 1986; Dhyne et al,, 2006; Eden, 2001; Lach & Tsiddon, 1992). In other words, we studied wholesale prices with respect to their duration and the size of the changes that take place, which provided us with a descriptive idea of the behavior of wholesale prices and enabled us to perform an exploratory analysis of the information on the basis of temporal characteristics (day of the week, month and year), and of the signs of price changes.

Secondly, we analyzed price perceptions by means of regression techniques, taking model (1) as the initial point.
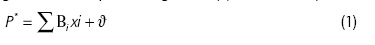
In this model, P* measures the price perceived in the market, xi are the variables accounting for it, ϑ is the random perturbation and Bi are the model parameters that quantify the effect of the changes in P* as a consequence of changes in xi.
The price perceived is not directly observable and so model (1) cannot be used to draw inferences. What is observed is the market price P. However, in a competitive market that is in equilibrium, the two prices must coincide. The problem then is to determine the mechanism that leads a market with these characteristics to reach the point of equilibrium. A widely employed approach is that known in the literature as the partial adjustment hypothesis. Its mathematical model is shown in (2), where t and t represent the time.
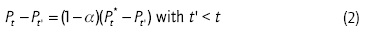
Taking into account that in a competitive market in equilibrium the perceived price must be equal to the observed price, then α ε(0,l) and, therefore, what (2) indicates is that the change in observed prices between two instances of time is just a part of the change necessary to equalize observed and perceived prices. a measures the speed with which this adjustment takes place. If a tends to zero, the adjustment tends to take place in a single instant of time, which means that the price is short lived. On the other hand, if α tends to 1, the observed changes in prices are a very small part of the changes necessary to reach the equilibrium price (that which brings the observed and the perceived prices into line). In this case, the prices are very persistent.
By incorporating the index t into (1), clearing p* in (2) and substituting its value in (1), model (3) is readily produced.
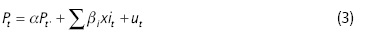
Model (3) is a dynamic structural model in which α measures the persistence of the prices observed in the market and the speed at which the observed prices are adjusted to the perceived ones, βi. quantifies the short-term changes presented by prices as a result of changes in exogenous variables, and βi /(I-a) measures the same effect but in the long term, that is, the effect on perceptions. The latter interpretation is deduced mathematically, taking into account that expression (2) can be written as Pt = αPt, + (1 - d)Pt * and that when it is compared with (3) the development shown in (4) can be performed.
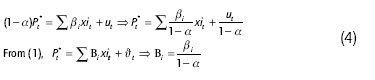
(1- α)*100 measures the importance, in percentage terms, of the short-term effect on the observed price with respect to the effect on the perceived price. Moreover, if t = t -1, then α /(i- a) measures the average time taken for a change in xi to provoke price changes, and Iog(0,5)/Iog( a) is the half-life, which indicates how long it takes for half of the impact of a unit shock in xi to be reflected in P.
The Data
The data were obtained from the website of Merca-laspalmas1. Mercalaspalmas is, according to its own website, the leading food trading unit in the Canary Islands for the distribution of agri-food products. It is managed by the mixed-capital company Mercalaspalmas, S.A., and its area of influence includes the islands of Gran Canaria, Lanzarote and Fuerteventura, with a de facto population of over 1 million inhabitants. The activity of Mercalaspalmas is structured into four sectors: the fruit and vegetable market, the fish market, the meat market and the area of complementary activities and services. Our analysis focused on the fruit and vegetable market, for which two food halls are used, with a total surface area of 19,208 m2. Every year over 210,000 tones of fruit and vegetables are traded here, including both local and imported products. This trading activity represents a market share of over 85% in its area of influence. This food trading unit provides a meeting point for farmers, agricultural organizations and companies, wholesale companies, distribution and logistics companies, distribution chain logistics platforms, and large commercial centers, as well as fourth- and fifth-range operators2.
The data analyzed in this study refer to the period 2 January 2006 to 23 June 2010. These are daily data and refer to every day in which the market operated, a total of 1,141 days. During this period, a total of 177 different fruit and vegetable products were traded. Obviously, not all of them were present in the market every day. In order to ensure a minimum level of robustness of results, we decided in principle to analyze only the products that were present in the market for at least 57 days (5% of the maximum possible). This reduced the sample to a total of 162 products. On average, each of these 162 products was traded for 652 days, with the distribution of the number of days traded being very uniform, with the exception of one group of products that were traded for 1,100-1,150 days. Nevertheless, only 13 products were present every day that the market was open.
In total, 105,653 prices were obtained, and an equal number of quantities. For each product and day that these products were present in the market, the most frequent price and the quantity traded were obtained. It should be taken into account that in the following sections, when a reference is made to price, this means the modal price. By multiplying price and quantity, we obtained a value for the turnover for the entire sample, which exceeded €824 million.
Results
Analysis of Price Data
Joint analysis of the data is a complex process due to the continual rupture of the data time series, which makes it impossible to perform a standard analysis of time series or panel data. Nevertheless, this rupture was not due to a lack of corresponding data, but because there was no market for the product. Therefore, the database contains all possible price data for the set of products that were traded on at least 5% of the total number of days possible.
In order to perform a descriptive and exploratory analysis of the behavior of prices at Mercalaspalmas, the following four variables were created for each product:
1. Change: The first variable identifies, for each product, the instant of time at which a price change took place. The only days taken into account were those in which the product in question was actually traded in the market; that is, when the variable Change has a value of 1, this means that the price that day differed from the price of the same product on the previous day it was present in the market. Otherwise, the variable Change takes the value 0.
2. Duration: We calculated the duration of each price for each product. This variable dates from the day a price changes and measures the number of days the product had remained in the market at the same price as existed before the change. Again, we only computed the days in which the product was actually present in the market. As prices were not available for the period before 2 January 2006 or after 23 June 2010, neither the first nor the last durations were computed.
3. Size: For every product, series of sizes of price changes were calculated. To do so, for each instant at which a price change was identified, we calculated the relative rate of change between the new price and the one immediately before it. This variable was dated on the day the price change took place.
4. Unit size: This is the size of the change per unit of duration of the previous price, and was calculated as the ratio between the size of the change and the duration of the price that was changed.
This set of variables was used to undertake the descriptive and exploratory study of the prices: by product, by day of the week (including the effects of holidays), by month and by year.
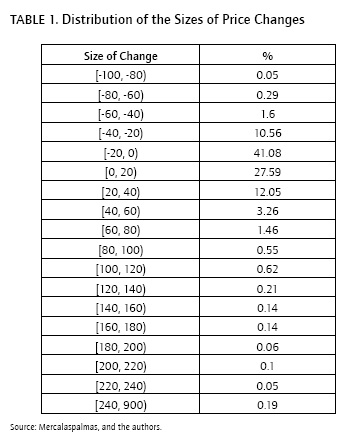
For the whole study period, a total of 16,613 price changes took place and 16,405 durations were measured. The mean duration of prices was 5.48 market days, the median duration was 2 days, and 73.15% of durations were less than 5 days. In addition, we measured 16,611 sizes of price changes, obtaining a mean value for the price change size of 3.54% and a median value of -3.7%. The distribution of these sizes is shown in Table 1.
Focusing on the instants at which price changes took place, and distinguishing between increases and decreases, the global data show that of the 16,613 changes, 8,900 (53.6%) corresponded to price decreases. Prior to a price decrease, the mean duration of prices was 5.39 days, and the magnitude of the decrease was -14.97%. Price increases represented 46.4% of the changes and, in these cases, the mean duration of the previous price was 5.59 days, and the mean size of the increase was 24.92%. There were no statistically significant differences between the duration of prices with respect to the sign of the change, although there were such differences regarding the size of the change (comparing absolute values of price change). Accordingly, the mean size per trading day for price decreases, in absolute terms, was statistically smaller than that for price increases (-7.9% versus 12.9%). Continuing our comparison of the behavior of price increases and decreases, there was found to be a significant association by product, in the sense that the products with highest mean price increases tended to coincide with those of largest decreases (a correlation of around 68% between mean price increases and decreases per product).
The above results agree in some aspects and differ in others from those observed for final consumer prices. For the euro area, Dhyne et al. (2006) reported that for non-processed food items as a whole, percentages of increase and decrease were inverted with respect to those corresponding to the wholesale market: 54% of the changes in retail prices were increases, and 46% were decreases. Moreover, the size of price decreases was very similar for both types of prices, but the increases in the wholesale market were much larger than those observed in the retail market. Dhyne et al. (2006) reported a mean price increase of 14.7% for retail prices of non-processed food items, versus the 24.9% that we observed in the wholesale market. For both types of prices, the products with the largest increases also tended to present the largest decreases.
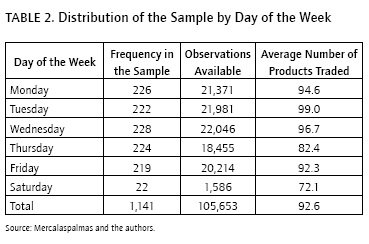
Secondly, we considered the effect of the day of the week, taking into account both working days and holidays. Normal market working days are from Monday to Friday. Occasionally, however, and especially when Friday or Monday is a holiday, the market opens on a Saturday. In our sample, there were only 22 Saturdays on which the market was open, while for the rest of the days of the week, the distribution of the sample was very homogeneous, at around 225 days, as shown in Table 2. In terms of products, the day when most products were available in the market was Tuesday, followed, by Wednesday, Monday, Friday, Thursday and Saturday, in that order.
With respect to the days on which articles were traded, there were large differences between products. There was a strong association in the sense that, on average, the products that were rarely traded on any given day were also rarely traded on the other days, whereas products that were often traded were normally available every day of the week. The justification for this finding is the strong degree of seasonality affecting the production of many items.
However, the daily behavior in terms of the value of goods traded was slightly different. On Mondays, 23.3% of the total trading value was traded; this figure was very similar to that for Tuesdays (23.7%) and slightly higher than that for Wednesdays (21.53%). These were all considerably above the trading volume for Fridays (17%) and Thursdays (12.9%). Saturdays represented less than 1.3% of total trading value.
There was a statistical association between the price and the volume of trade, in the sense that greater trading volume was associated with higher prices. Thus, on Mondays, Tuesdays and Wednesdays, and to a lesser degree on Fridays, prices tended to be higher, while on Thursdays and Saturdays they were significantly lower. Saturday was the market day with the highest level of heterogeneity; although prices were lowest, there was a high degree of dispersion with respect to the other days of the week. For some products, the price on Saturdays was double the average for the other days, while for other products the Saturday price was less than a third of that on the other days. This result leads us to believe that on Saturdays there is, on one hand, trading in products unsold from previous days, and on the other, the sale of products with a high level of seasonal demand.
The exploratory analysis also revealed an important concentration of products in the overall trading volume. The 10 products most traded, by volume, represented 30% of the total trading volume, and together with the next 10, represented 50% of the total trading volume.
The main data for the duration and size of price changes by day of the week are summarized in Table 3.
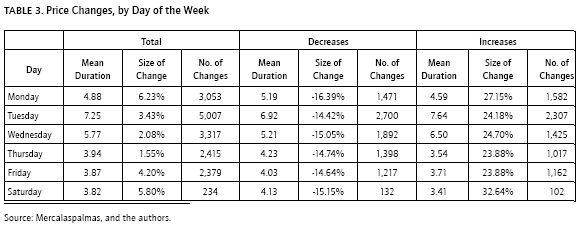
The largest number of price changes took place on Tuesdays, after a mean duration of 7.25 days, which was also the longest duration. Monday was the only day of the week on which the number of price increases exceeded the number of price decreases. With respect to the size of changes, every day fitted the general pattern, that is, in absolute terms increases were much higher than decreases, with Saturday standing out in this respect, with the size of price increases more than doubling that of decreases.
The fact that a price change occurred on a market day following a holiday did not significantly affect the duration, size or sign of the change.
A joint exploratory data analysis was performed between the number of products for which a price change took place, for every day the market was open, distinguishing between price increases and decreases. The conclusion reached was that there is a strong positive association between the number of positive and the number of negative changes. In other words, the market days on which many products presented price increases coincided with those on which prices decreased. There were only seven market days when no price change at all took place; four of these were Mondays and three were Saturdays. On 33 days, there was no increase; of these, 15 were Thursdays. Only on 21 days were there no price decreases, and eight of these were Mondays. Moreover, focusing on the days when most increases/decreases took place, it can be seen that the 80 days when most changes occurred (representing 10% of the days on which prices changed) accounted for over 22% of all changes, with Tuesdays being the day of the week with by far the most changes, both positive and negative.
Finally, we studied price with regards to month and year. To do so, we used the Van der Waerden test implemented in the Eviews 6.0 software, taking as the null hypothesis that the distributions of prices by months or years are the same. In both cases, the null hypothesis was rejected; evidence was obtained that prices presented maximum values in 2007, while in 2009 and 2010 they were lower than in 2006. There was also evidence that prices tended to be lower from March to August than during the rest of the year.
Price Perception: Significant Factors
In this section, we address the second main objective of the study: to identify factors that are statistically significant in the perception of prices, and to quantify the effect on the market price. To do so, we took the database described above as a starting point and used it to specify model (3). The underlying hypothesis for this model is that the market tends to move to a position of equilibrium in which the prices perceived (Pit) by the agents in the wholesale market coincide with the prices observed (Pit) there. In order to normalize the prices and to eliminate the product effect, we created the price index variable IPit, calculated as the ratio between the price and the mean price for the entire sampling product with respect to the product in question. This variable was used as the endogenous variable in the model.
As remarked above, we had a panel of data with certain very specific characteristics. Although this panel contained all the data, the series of data were not complete from a temporal standpoint. This type of data does not allow normal estimation techniques to be applied, but it is possible to identify hypothetical characteristics that affect the way in which the agents participating in the market perceive prices. Model (3) was used to test the consistency of our hypotheses.
In the first place, and as exogenous variables in (3), a set of variables was included to reflect temporal effects at an additive level. Specifically, three temporal effects were taken into account: the day of the week effect (DDjit, where j = {2 = Tuesday, 3 = Wednesday, 4 = Thursday, 5 = Friday, 6 = Saturday}), the month of the year effect (DMkit, where k = {2 = February, 3 = March,...,12 = December}), and the year effect (DYltt, where l = {2 = 2007, 3 = 2008, 4 = 2009, 5 = 2010}). The aim of adopting these variables was to test the existence of an overall temporal/seasonal pattern in the market. These parameters must be interpreted with respect to the reference mode for the whole model (product 1, day Monday, month January and year 2006), which complicates its meaning. In measuring the day, month and year effects, the results in the above section are more readily interpretable. The sole aim of including these variables in the model is to incorporate relevant variables and to test their degree of significance.
In performing this study, we had a census database, in the sense that all the prices and quantities for all the products traded for every day the market was open were available. This enabled us to calculate new variables that might be related to market prices and their perception. The variables identified are described below and incorporated into model (3).
Accumulated Volume of Product Traded at a Given Price, X1it
This variable is calculated as follows: If at instant 1, the quantity q1 is traded at a price p1, and at instant 2, a quantity q2 is traded at the same price p1, while at instant 3, a quantity q3 is traded at a price p2 * p, the variable X1it takes the values X1i1=q1, X1i2=q1+q2 and X1,3=q3. Using X1 it, the index variable IX1 it is calculated as the ratio of the variable X1it and the mean value of this variable for each product, X1i.
Economic theory postulates a negative relation between quantity and price. Moreover, it is logical to consider that the greater the quantity traded at a given price, the lower this price will be perceived. To interpret the parameter of this variable, it should be taken into account that these variables are indexed by the mean value of each product. Therefore, the parameter accompanying this variable, multiplied by 100, reflects the percentage change in prices relativized by the mean price arising from an increase in the accumulated quantities equal to the mean of these quantities. This interpretation is readily accepted, bearing in mind that there is a linear relation in terms of the indices. Therefore the parameter accompanying IX1 it measures the number of units changed by IX1 it following a unit change in /X1it. Hence β  , in which Pn and Pi0 only differ with respect to the value of /X1it where IX1n = IX\0 +1. X1
Given that /XTjt  , for it to increase within a unit X1it,
Quantities Traded at Instant t, X2it
As with prices and accumulated quantities, the variable /X2it is used, calculated as the ratio of X2it and the mean value for each product. Its interpretation is similar to that performed for X1 it.
Number of Days that a Specific Price Remained Unchanged in the Market, X3it
The days on which the product was not traded are not taken into account. As information was not available for the period before 2 January 2006, in the same way as with the calculation of the price durations, the first value obtained was not taken into account. Furthermore, there were three products that did not change in price throughout the period studied, and these were therefore eliminated from the analysis. The total volume of data for this variable was thus reduced to 97,615 observations (a reduction of 7.6% from the 105,653 available).
This variable is expected to maintain a negative relation with prices, and is interpreted in the sense that the longer a price is maintained in the market, the lower it will be perceived. In quantitative terms, the parameter accompanying this variable, when multiplied by 100, reflects the percentage change in prices relativized by the mean price arising from a price being maintained for one more day in the market.
Number of Days the Product i has been Absent from the Market, X4it
As remarked above, the supply of these agri-food products is subject to a strong element of seasonality, and this supply capacity increases as the harvesting period advances, while the pressure of retail demand decreases as this demand is increasingly satisfied. Accordingly, it is to be expected that when a product reappears after being absent from the market for many days, its price will tend to be higher than when it has been present on the market for several days. In addition, when a product has long been absent from the market, there is a reduced perception of the baseline price, which favors the perception of a relatively higher price when the product is marketed. In consequence, we expect there to be a positive relation between this variable and the price. The interpretation of the parameter accompanying this variable is similar to that performed for X3it.
Index of all Wholesale Market Prices at each Instant of Time, IX5i
This is obtained in two stages. Firstly, the average market price for each instant of time is calculated. This price is obtained as the mean value of all the products traded in the market, each being weighted by its degree of participation in the value of the quantity traded. Secondly, the market price index is obtained by dividing the mean price at each instant of time by the mean price measured in the market on 2 January 2006. We expect there to be a positive relation between this variable and the variable perception, in the sense that when the market price increases, there is a greater perception of the price. The interpretation of the parameter associated with /X5i is similar to that carried out for the one associated with /X1i, except that the effect, rather than being caused by an increase in accumulated quantities equal to the mean value, is caused by an increase in the market price equal to the mean price measured on 2 January 2006.
Accordingly, model (3) is specified as (5), where α, βs, δj, λk and φl are the parameters of the model and u is the random perturbation.
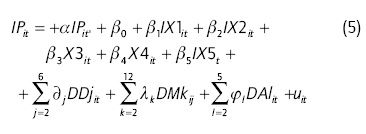
In (5), t is defined as the instant of time prior to twhen the product i was traded. This means that what is measured is the price perception, taking as a reference the latest price observed in the market. a measures this structural price persistence with respect to the price obtained the last time the product was traded.
The results of this estimation (model 5) are shown in Table 4. Standard errors were consistently estimated using the expression proposed by White (1980) for this purpose.
There was seen to be a daily, monthly and annual temporal statistical effect. However, as noted above, no interpretation was made of the parameters because the reference with which they are compared is very specific.
The parameter estimated for price persistence was 0.9444, which reflects a high level of price persistence and a slow adjustment to the point of equilibrium, i.e., that in which the observed price coincides with the perceived price. Specifically, on average, a change in the model's exogenous variables took 18 market days (not counting the days on which there was no market for the product) to be perceived, while over 12 market days had to pass for half of the total price change to be perceived (half-life). Only 5.56% of the change that needs to be produced to reach a new state of equilibrium was perceived immediately.
The variables /XI, /X2, X3, X4 and /X5 have a statistically significant influence on price and its perception, and their signs are as expected. Nevertheless, they have very little predictive power. For each additional unit of mean quantity traded on the market, the perceived price was 2.7% lower, taking as a reference the mean price for the product, in the case of both accumulated and non-accumulated values. Furthermore, when a price is maintained in the market for a greater number of days, it favors a lower perception of the price, but this has only a very limited quantitative effect. In contrast, for every additional day a product is not traded on the market, when it is eventually traded its price is perceived as being 5.5% higher with respect to the mean price for the product throughout the sample period. Likewise, for each additional unit of mean price in the market on 2 January 2006, the perception of the price is 8.86% higher than the mean price.
Conclusions
The exploratory data analysis conducted on prices at the Mercalaspalmas wholesale market shows there to be a significant temporal effect on wholesale prices, whether daily, monthly or annual. The product is a fundamental factor in accounting for price behavior, presenting a significant association between the sizes of price increases and decreases. Thus, the products with the highest average price increases were also those presenting the highest average decreases. With regards to price changes, there were more frequent price decreases than increases, but in size, the latter were 60% larger in absolute terms. Accordingly, we believe that despite the similar level of flexibility regarding price increases and decreases, the latter take place in smaller steps. This result provides initial evidence that wholesale prices behave in a different way from retail prices. This difference could be due to the different levels of information available to the agents in each type of market.
Following the assumption that the perceived price coincides with the price of the market in equilibrium, we studied price perception using a partial adjustment model with respect to the observed prices. The results obtained show there was a significant degree of price persistence, which was apparent as a slow rate of adjustment between perceived and observed prices. Only 5.56% of the change required to achieve a market in equilibrium was perceived immediately, with the mean perception lag being 18 market days, and the half-life of the effect of one change in one exogenous variable being 12 market days.
Finally, various factors were seen to affect the prices perceived and, therefore, the way in which prices are perceived in a wholesale market. Increases in the quantities traded each market day and the accumulated quantities traded at a given price, together with the length of time a given price remains unchanged in the market, both favor the perception of lower prices. In contrast, an increase in the number of days a product has remained absent from the market and, above all, the general growth of prices in the market itself, both produce a perception of higher prices.
From our results, it can also be concluded that the factors identified, although statistically significant in accounting for the perceived prices, only explain a very small fraction of price perception, that is, the market equilibrium price.
Pie de página
1http://www.mercalaspalmas.es
2Fourth range is understood as pre-cut products, and fifth range as pre-cooked products.
References
Álvarez, L. J., & Hernando, I. (2006). Price setting behaviour in Spain: Evidence from consumer price micro-data. Economic Modelling, 23(4), 699-716. [ Links ]
Baharad, E., & Eden, B. (2004). Price rigidity and price dispersion: Evidence from micro data. Review of Economic Dynamics, 7(3), 613-641. [ Links ]
Barro, R. J. (1972). A theory of monopolistic price adjustment. The He-view of Economic Studies, 39(1), 17-26. [ Links ]
Baudry, L., Le Bihan, H., Sevestre, P., & Tarrieu, S. (2005). La rigidité des prix en France: Quelques enseignements des relevés de prix à la consommation. Economie Et Statistique, 386(1), 37-57. [ Links ]
Baudry, L., Le Bihan, H., Sevestre, P., & Tarrieu, S. (2007). What do thirteen million price records have to say about consumer price rigidity?. Oxford Bulletin of Economics and Statistics, 69(2), 139-183. [ Links ]
Bils, M., & Klenow, P. J. (2004). Some evidence on the importance of sticky prices. The Journal of Political Economy, 7/2(5), 947-985. [ Links ]
Carlton, D. W. (1986). The rigidity of prices. The American Economic Heview, 76(4), 637-658. [ Links ]
Cecchetti, S. G. (1986). The frequency of price adjustment: A study of the newsstand prices of magazines. Journal of Econometrics, 37(3), 255-274. [ Links ]
Dhyne, E., Alvarez, L. J., Le Bihan, H., Veronese, G., Dias, D., Hoffmann, J., & Vilmunen, J. (2006). Price changes in the euro area and the United States: Some facts from individual consumer price data. The Journal of Economic Perspectives, 20(2), 171-192. [ Links ]
Eden, B. (2001). Inflation and price adjustment: An analysis of micro-data. Review of Economic Dynamics, 4(3), 607-636. [ Links ]
Jaleta, M., & Gardebroek, C. (2007). Farm-gate tomato price negotiations under asymmetric information. Agricultural Economics, 36(2), 245-251. [ Links ]
Lach, S., & Tsiddon, D. (1992). The behavior of prices and inflation: An empirical analysis of disaggregated price data. Journal of Political Economy, 700(2), 349-389. [ Links ]
Matsui, K. (2010). Effects of wholesaler concentration on retailers by format: Evidence from Japanese brand-level price data. Applied Economics, 42(18), 2379-2391. [ Links ]
Niedrich, R. W., Sharma, S., & Wedell, D. H. (2001). Reference price and price perceptions: A comparison of alternative models. Journal of Consumer Research, 28(3), 339-354. [ Links ]
Otero, J. M. (1993). Econometria: series temporales y predicción. Madrid (Spain): AC. [ Links ]
Sibly, H. (2001). Price inflexibility in markets with repeat purchasing. Journal of Macroeconomics, 23(3), 459-475. [ Links ]
White, H. (1980). A heteroskedasticity-consistent covariance matrix estimator and a direct test for heteroskedasticity. Econometrica, 48(4), 817-838. [ Links ]
