Inglés (pdf)
 Articulo en XML
 Referencias del artículo
 Enviar articulo por email
 Citado por SciELO
  Citado por Google
  Similares en
SciELO
Similares en
SciELO  Similares en Google
 Permalink
Introduction
With the purpose of attaining higher levels of profitability, the new generation of companies have begun to consider Customer Value-oriented Management (CVM) as a key factor in their current business-to-customer relationship. CVM philosophy is based on the premise that resources are scarce and should therefore be carefully assigned to customers at a higher value for the company, as this would lead to a successful business (Valenzuela, Mulki & Jaramillo, 2010). For this reason, it is important to understand this customization as a sequence of flexible steps in the supply chain, where the real business should be to know how to maintain the most profitable customers as clients. In this sense, leading companies have begun to manage their Customer Equity (CE) as a key strategic asset to achieve a sustainable competitive advantage.
Based on this, significant research has been done to examine the approach used by firms to manage customers' portfolios as a key asset with an emphasis on customer value (Hogan, Lemon & Rust, 2002; Reinartz & Kumar, 2003; Venkatesan & Kumar, 2004; Rust, Lemon & Zeithaml, 2004; Rust, Ambler, Carpenter, Kumar & Srivastava, 2004; Reinartz, Thomas & Kumar, 2005; Gupta et al., 2006; Kumar, Lemon & Parasuraman, 2006; Shah, Rust, Para-suraman, Staelin & Day, 2006; Chahal, 2010; Schweidel, Bradlow & Fader, 2011; Gibilaro & Mattarocci, 2011). Customer participation adds a new dynamic to the customer-provider relationship by engaging customers directly in the co-creation of value in the service process (Chan, Yim, & Lam, 2010) and, therefore, understanding how companies can harness the benefits and sidestep the drawbacks of customer participation is of great importance.
In a market-oriented firm, sales managers should emphasize the importance of keeping customer satisfaction at the core of all sales and service initiatives (Jones, Busch & Dacin, 2003).
The current research study is based on sellers' responses (business, services, sales and investment executive) and has two main objectives. First, to contribute with a theoretical and practical vision of the new perspective of sales and marketing that focuses toward Customer Value Management (CVM) and its business implications. Second, to test the influence of CVM financial results: Market Share (MS), Gross Margin (CM) and Return on Equity (ROE).
Theory and Hypotheses
Researchers such as Narver and Slater (1990), Jaworski and Kohli (1993), Deshpandé, Farley and Webster (1993), Matsuno and Mentzer (2000), Webb, Webster and Kre-papa (2000), Llonch and López (2004), Low (2005), Olavarrieta and Friedmann (2008), Li and Zhou (2010), Kumar, Jones, Venkatesan and Leone (2011), Smirnova, Naudé, Henneberg, Mouzas and Kouchtch (2011) have confirmed in their studies that using market orientation as a business philosophy generates a competitive advantage and better business results. This happens because market-oriented companies use the knowledge obtained from the market for the formulation and implementation of marketing strategies (Hunt & Morgan, 1995; Morgan & Strong, 1998). Therefore, they count on an advantage over their competitors given their greater ability to understand, acquire and retain customers, even more so when the company helps customers satisfy their core needs (Homburg, Müller & Klarmann, 2011). In this sense, commitment and trust are key in maintaining long term relationships with customers. In relation to the commitment-trust theory of Morgan & Hunt (1994), both variables, commitment and trust, lead to effectiveness, efficiency and productivity in the relationship. Trust is considered an essential factor for successful relationships between businesses and customers (Dwyer, Schurr & Oh, 1987; Moorman, Deshpande & Zaltman, 1993) and relational commitment is critical for long-term relationships (Morgan & Hunt, 1994; Mende, Bolton & Bitner, 2013).
Trust is a broad concept and has been documented in diverse industries and at various levels of relationships. This relationship has been studied by way of I) businesses and personnel (Holmes, 1991); II) clients' experiences with the complaint system (Tax, Brown & Chandrashekarant, 1998); III) the service sector (Grayson & Ambler, 1999; Ruben & Paparoidamis, 2015); IV) the consumer/brand relationship (Chaudhuri & Holbrook, 2001); and V) the development of strategic alliances (Smith & Barklay, 1997; Mohr & Puck, 2013; Capaldo, 2014).
Trust is important when the parties involved are uncertain (Moorman et al., 1993; Doney & Cannon, 1997), that is, trust is the organization's way to reduce risk in a setting in which they feel particularly vulnerable. Accordingly, trust is a particularly relevant concept at the beginning of a relationship, especially, at first using a service, when the lack of familiarity makes selecting a supplier difficult and generates uncertainty in preferences. Thereby, the organization searches for elements (communication and reputation, among others) that are beyond its knowledge in order to formulate a less risky image of the supplier and could make the choice.
Besides uncertainty, experience plays an important role in the creation of trust placed in building a relationship with a customer over time. A customer's additional experience with the same product after each consumption increases its familiarity and, thus, generates more trust (Einhorn & Hogarth, 1978).
The ability to understand the market and a customer's portfolio allows the company to anticipate opportunities, discern different events and trends in the marketplace and take appropriate action (Narver & Slater, 1990; Kohli & Jaworski, 1990; Yli-Renko & Janakiraman, 2008; Lukkari & Parvinen, 2008; Terho, 2009; Tarasi, Bolton, Hutt & Walker, 2011). From this perspective, CVM situates the customer at the center of business, where it stands as a basic strategy for warranting business success. In this sense, the approach goes beyond relationship marketing aiming at collaborative client-company marketing for value creation (Wang & Feng, 2012).
CVM philosophy offers a vision for business management that allows the understanding and knowledge of customer value in order to maintain lasting relationships. It also optimizes each one of the aspects that increases Customer Lifetime Value (CLV). That is to say, firms should evaluate customer equity as the key asset to achieve business prof it-ability (Gupta eia/., 2006; Kumar eia/., 2006).
According to Ivanauskiene and Auruskeviciĕne (2010), it is essential that organizations measure their marketing efforts and costs based on Customer Equity Management. With reference to some CLV/CE models, the variables that make UP Customer Equity are classified into three categories: Retention Rate, Customer Investment Costs and Income Generated (Berger & Bechwati, 2001; Reinartz & Kumar, 2003). Sales and marketing strategies are structured around the development and maintenance of long-term relationships with profitable customers. Figure 1 shows the conceptual model proposed in this research.
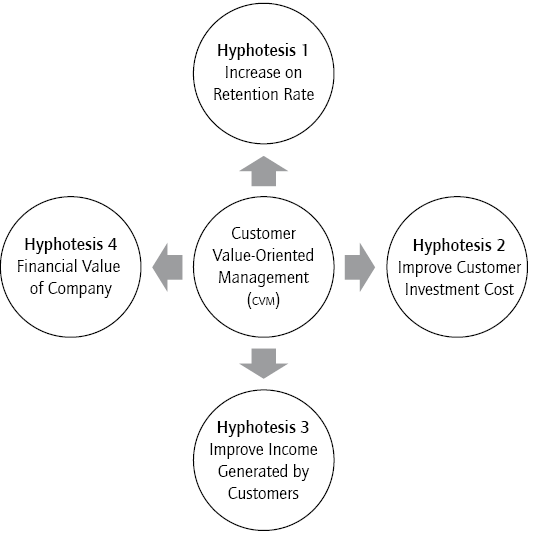
Based on the factors are associated with Customer Valueoriented Management, the hypothesis for this study will be defined as:
H1: CVM has a positive influence on the Retention Rate of their profitable customers.
The Retention Rate, defined in respect to an individual customer, refers to the probability that an individual customer will remain loyal to a particular provider or company and that the customer will keep producing the expected income and costs, within a set period of time.
Retention rates are used in order to adjust the forecasted or expected gross margins to the probability of the occurrence of the event (Dwyer, 1997). They can be estimated with the help of empirically validated loyalty factors such as customer satisfaction, barriers or the cost of changing providers, varied seeking behaviors, and attractiveness of the alternatives. Therefore, these should not be considered a stable factor. On the contrary, they should be taken as a dynamic factor that reflects changes in the purchase behavior of the customer during their lifetime (Wang & Spiegel, 1994).
According to Holehonnur, Raymond & Hopkins (2007), a customer's purchase decision and behavior are determined by a number of tangible and intangible factors. Hence, when analyzing the customer value to an organization, it is important to choose the constituents having the greatest effect on Customer Equity. In this sense, the following hypothesis is formulated:
H2: CVM has a positive influence on the optimization of costs to acquire future profitable customers.
In the process of customer attraction, organizations can only analyze unobservable metrics (Gupta & Zeithaml, 2006) of potential customers, such as product/service quality perception, customer perceived value, intentions to use product and trust in brand.
Acquisition costs should be used, when possible, to foresee the CLV of a future customer. For current customers, investment costs incurred by the company to acquire a customer should be considered.
Marketing and sales costs represent the costs of retaining and developing customers, including all activities or marketing actions aimed at improving the profitability of each customer. These are, for example, I) promotional costs (sending personalized greetings, catalogs, sales flyers, etc.); II) recovery costs incurred prior to the end of the relationship to avoid desertion or the so-called "churn costs", which are the costs incurred to persuade (Keane & Wang, 1995); and III) costs that arise after the end of the relationship derived from the efforts made to recover a customer.
H3: CVM has a positive influence on the income generated by customers during their lifetime.
This analysis should cover the dimensions of value for the customers that are involved in the decision-making process of purchasing, and how the company provides that value in order to meet the customer needs (Woodruff & Gardial, 1996; Woodruff, 1997; Flint & Woodruff, 2001). Managers should then evaluate how the value provided by the company is being communicated to customers and how resources are being distributed to maximize the CLV in the stages of acquisition and retention.
The income generated includes income from up-selling, cross-selling, and the results of gross margins. Up-selling symbolizes the retention of customer value as it can be produced as a consequence of I) a greater purchase quantity per transaction; II) more transactions per period; III) the sale of substitutes from the same category at a higher price for loyal, long-term customers that are less sensitive to price (Reinartz & Kumar, 2003); and IV) other key factors of the relationship (e.g., timely delivery, post-sales service, confidence in the quality, payment methods, trust and commitment, etc.).
Additionally, market orientation is fundamental to identify how competitors are providing value to their customers (Dawes, 2000). This information could be used to determine the organization's strong and weak points, especially in relation to the sales force and customer service.
Finally, this suggests that CVM would also influence the financial results of the company. The principal marketing metrics CLV and ce are useful when applied to financial measures such as ms, cm and re, facilitating the evaluation of marketing investment. Based on this we state that:
H4: CVM has a positive influence on the financial results of a company.
Therefore,
H4a: CVM has a positive influence on the gross margin of a company.
H4b: CVM has a positive influence on the return on equity of a company.
H4c: CVM has a positive influence on the market share.
Empirical Study in the Chilean Banking Sector
During the last decades, Chile has been doing very well in regards to information technologies (IT), especially, in service sectors such as: Tourism, finances, banking, and retail. Chilean banking system has been one of the sectors particularly more in tune with the fact that globalization and the competitive changes in the environment require businesses to be orientated toward the market and customer value in order to retain and develop those clients that offer the greatest benefits. In this regard, information technologies (data bases, analysis software, multimedia, etc.) and advances in business intelligence allow organizations to generate information on their clients and better satisfy their needs. The quantity and quality of the data have become indispensable since data is the basis for the elaboration of the diagnoses required for decision-making. Not being aware of the most frequent quality problems or not taking measures to solve them can result in the decline of the brand image, returns, confusion in customer profiles and erroneous calculations of customer value. All of these suppose higher costs and lower efficacy and profitability for the company's marketing actions.
With these strategies, systems, solutions, processes and technologies, organizations seek a way to carry out actions to build customer loyalty, optimizing the available resources. In fact, Chilean banks have developed flexible packages for superior value and to make customers happy. Seven years ago 76% of those who accessed a bank website achieved success in the transaction they wanted to make1. The same research concluded that the banking system was the fastest industry to incorporate Internet into its operations. The comparison of this data with the reality of the banking industry in December 2012 shows that the number of online transactions has increased fourfold in the past five years and is 15 times higher than the scenario in 2002 (Arroyo, 2013).
According to the website PymespracTICas of the Multilateral Investment Fund (fomin in Spanish), Chile is the leader in Latin America regarding it, and can be compared to European countries. This website also mentions the last it Report by the World Economic Forum which positions Chile in the 34th place, higher than Spain (38). In the same ranking, Uruguay is in 52nd place, followed by Costa Rica (53), Brazil (60), Mexico (63) and Colombia (66)2. Since 2002, Chile has had good legal regulations and has carried out a program on digital alphabetization, where more than a million people (Chile has a population of 16 million) have learned about Internet and e-mails3. In 2012, the government decided to carry out another program, through an agreement signed with Microsoft Chile, aimed at increasing training in digital alphabetization. This program will allow access to 1 million entrepreneurships4. Also worth noting, Chile reached a penetration of internet access of 44.4% according to OECD, being relevant to the growth level of mobile connections which reached 770% between 2009 and 20135.
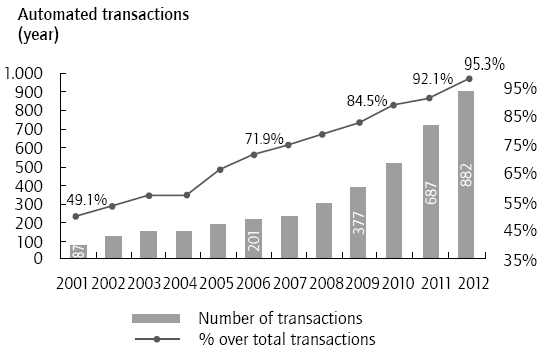
We have chosen Banco Estado because this institution is one of the largest Chilean banks and the only state bank. Therefore, it plays a fundamental role in the Chilean banking sector. In December 2012, the Bank had already done 95.3% of its total transactions through its website, teller machines and call centres (Banco del Estado, 2012). The following figure shows how electronic transactions have grown in Banco Estado (graph 1).
Methodology
Procedure and Sample
The method used in the empirical study is non-probabilistic. The data collected was used with judgment since the hypothesis was tested with the response of 107 sellers of one of the largest banks in Chile. In this study, the following roles were considered "Sellers": Business Executives, Service Executives, Sales Executives and Investment Executives. Accordingly, the hypothesis in this sample was tested keeping in mind they are executives who know about human resources managerial practices, as well as sales force policies and procedures. Moreover, these executives have an important connection with the Bank's clients.
To obtain this data, the branch director of the bank who was chosen to participate in the study was contacted by e-mail before the application of the survey. The purpose of this first approach was to inform the director about the objectives and scope of the research, which was useful to obtain a favorable disposition and cooperation with the collection of data. The survey was done during the months of April and July 2013. An English version of the questionnaire was developed and then translated to Spanish, which was later translated from Spanish to English, according to the procedure suggested by Brislin (1986). Scales were also pretested to assure validity.
A total of 150 questionnaires were distributed to the sellers of the bank. The main method used to administer the questionnaire was face-to-face interaction, used for most of the surveys (77/150 = 51.33%). The remaining 48.7% of the surveys were relater sent the questionnaire (73/150 = 48.7 %).
The response rate was 71.33 %, that is to say, 107 responses were received. Fifty-eight responses were obtained from females (54%) and forty-nine from males (46%). Respondents' ages ranged from 20 to 50, with a mean age of 35.82. The minimum sample size required was defined by the criterion recommended by Hair, Black, Babin, Anderson & Tatham (2006), which consists of an equivalent of five observations for each parameter estimation of the study. Statistical analyses were done using SPSS Amos 19.0 software for Windows.
Measures
All constructs were measured with seven-point Likert type scale (ranging from totally disagree to totally agree) and multi-item scales obtained from published studies.
To establish measuring scales with good reliability and validity, we used the procedure suggested by Deng and Dart (1994). The first stage consisted in ensuring content validity of the measuring scales included in the questionnaire, since the variables used were validated in previous empirical research regarding the environment of market orientation, relationship marketing, and customer value orientation. In addition, subsequently collected data was obtained from a representative sample. In a second stage, the data was used to analyze the psychometric properties of the measuring scales applied in this study, as shown in table 1.
Table 1 Analysis of unidimensionality.
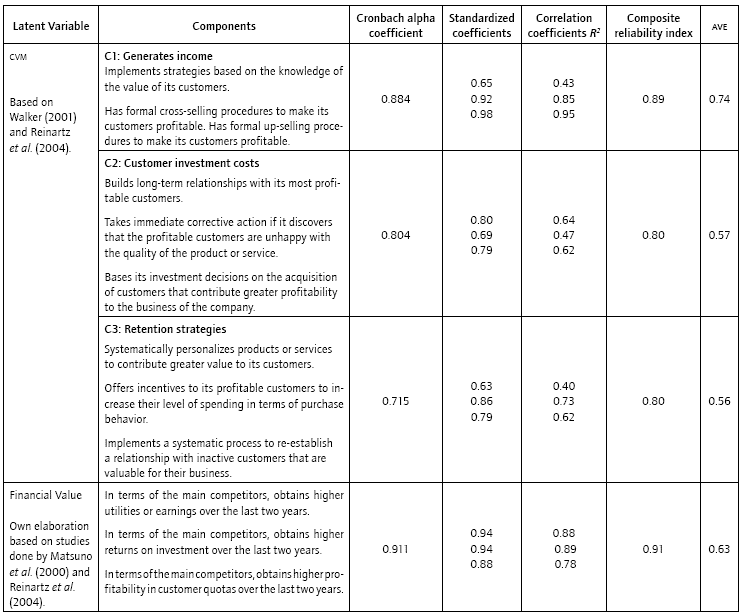
Note. The criterion of acceptance recommended for ave for each latent variable is greater than 50% according to Hair et al. (2006).
Source: Own elaboration.
Moreover, a depuration process was carried out by applying a pre-test and the expert panel method, made UP of well-known professionals and academics that work closely with the study topic.
The unidimensionality of the scales was analyzed by the Cronbach alpha model, which can prove whether the indicators measure the same latent variable. For this study, we used a conservative criterion, taking the optimum value to be greater than or equal to 0.7 (table 1). All the scales included in the study had a Cronbach's alpha higher than 0.70 (Nunnally, 1978; Hair et al., 2006).
In order to confirm the definitive reliability of each measurement scale, we applied the Compound Reliability of Construct. And for discriminating validity, the average variance extracted (AVE) test was used as a way to ensure that the dimensions had their own entity and that their content did not overlap with the content of the remaining dimensions (Fornell & Larcker, 1981). The calculation of the composite reliability index6 was also used. This index measures the internal consistency of the indicators of each construct, representing the degree to which these contribute to the common latent variable. All the results obtained exceeded the minimum limit of 0.7 for the first criterion and 0.5 for the second.
Therefore, considering these results, and the good Cronbach alpha indexes, the measurement scales have satisfactory reliability according to the recommendations made by Hair et al. (2006) to accept the hypothesis of reliability. The convergent validity was evaluated through standardized lambda coefficients for each latent variable (table 1).
Analysis of Results
Measurement Model
A confirmatory factor analysis with Amos was used to assess the properties of the latent variables (Anderson & Gerbing 1988). Given the size of the model and the sample size, results indicate an adequate fit for the data (χ 2 = 217.32; df = 95; p < 0.001; RMSEA = 0.063; GFI = 0.88; IFI = 0.92; CFI =0.93; NFI = 0.89; TLI = 0.9; PNFI =0.772). Hence, each one of the constructs are satisfactory in terms of absolute and incremental fit and have acceptable values in terms of parsimony. As shown in table 1, all standardized factor loadings were 0.6 or higher and significant at α = 0.01. Reliability was assessed with Cronbach's α and the composite reliability. Both statistics were above 0.7, which provides evidence of adequate reliability (Gerbing & Anderson, 1988). In addition, AVE statistics were above the acceptable value of 0.5 (Fornell & Larcker, 1981).
Fornell and Larcker (1981) approach was used to assess discriminant validity. A test of confidence intervals of factor correlations showed that none of the 95% confidence intervals of the factor correlations included one. In addition, the AVE for each of the factors was greater than squared correlations for all the pairs of factors.
After proving the appropriateness of the scale, we used a structural equation model with Amos to test the relationships described in figure 1. Model results indicated a good fit for the data: Χ 2 = 123.428; DF = 51; p < 0.05; RMSEA = 0.07; GFI = 0.842; IFI = 0.907; CFI = 0.905; NFI = 0.852; TLI = 0.878; PNFI = 0.658). The manuscript hypothesized that H1: CVM has a positive influence on the retention rate of profitable customers (H1: β = 0.76; t = 6.48, p < 0.01); H2: CVM has a positive influence on the optimized costs to acquire future profits (H2: β = 0.44; t = 5.109, p < 0.01) and H3: CVM has a positive influence on the income generated by current customers during their lifetime (H3: ( = 0.13; t = 2.68, p < 0.01). Therefore H1, H2 and H3 are not rejected. It can also be noted that CVM positively influences the company's financial value (H4: β = 0.65; t = 4.79; p < 0.01) using the cm (H4a: β = 0,80; t = 7,109; p < 0.01), roe (H4b: β = 0,83; t = 7,702; p < 0.01) and MS (H4c: β = 0,76; t = 6,39; p < 0.01) of the company. Hence, in this empirical study H4a, H4b and H4c are not rejected (figure 2).
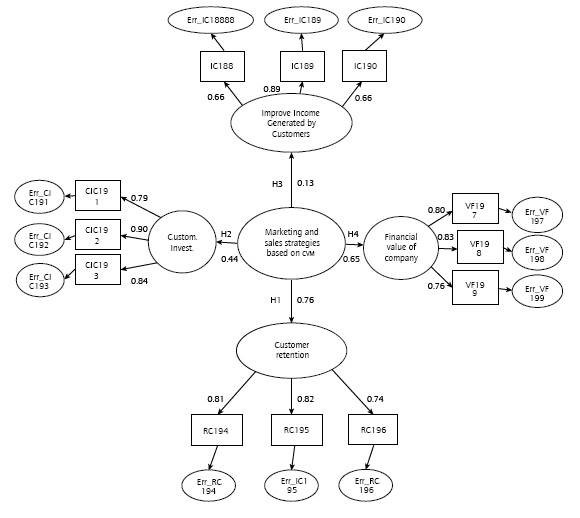
Source: Own elaboration based on data collected and results obtained in the analysis using spss amos 19.0 software for Windows.
Figure 2 Measurement Model Proposal. Note: All results significant at 0.01.
The analysis of the Chilean banking sector shows the following results:
GM: It is important to see how well the bank is doing its business, because it indicates how many Chilean pesos the bank is keeping after deducting its operational cost from its income. According to this, the bank is doing very well, its cm is growing more than the Chilean banking system.
Between 2008-2012, the cm of Banco Estado has grown 58% and the Chilean banking system's cm has grown 47% as we can see in table 2.
Table 2 Gross Margin 2008-2012.
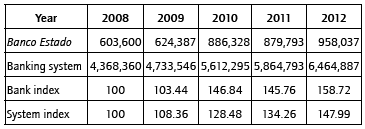
Note. Indexes were calculated by authors. Gross margin figures are expressed in millions of Chi lean pesos.
Source: Office of the Superintendent of Banks and Financial Institutions (gross margin figures).
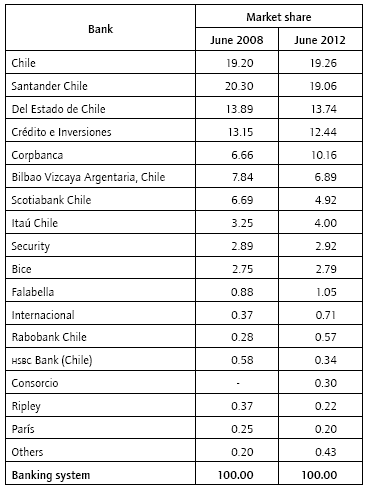
MS: There are more than 20 banks in the Chilean banking sector, but the MS is highly concentrated; four of them have almost a 67% of market participation, according to the amount of loans (table 3 shows a comparison of the MS of the entire system between June 2008 and June 2012).
ROE: This ratio is a measurement of the return on investment. Many people in the financial market believe it is the final criterion of profitability as it tells us how much a company is making from the money invested. From any point of view, it is a key indicator of overall operating efficiency and the quality of management. In this particular case, we calculated the roe before tax, considering that Banco Estado has a different tax treatment to other governmental enterprises. During the period 2004-2008, Banco Estado received, each year, a roe higher than the average for the banking system (Banco Estado's roe was 9.26% higher than the average). However, Banco Estado's roe during the period 2009-2011 decreased due to an important financial crisis and the incorporation of relevant competitors in the industry. The fall in the bank's roe would have been worse without the implementation of a strategy that focused on profiting from its client portfolio, that is to say, improving the retention rates of profitable customers and implementing more efficient practices of customer uptake and development (table 4).

Conclusions, Limitations and Future Research
This empirical study allowed the observation that, in fact, the studied bank has improved its retention rate of profitable customers and the income generated by the customers during their lifetime.
Taking into account the hypothesis formulated in the model (H1, H2, H3), it is important to mention that the CVM approach focuses on the retention of profitable customers rather than the massive uptake of customers, and that a bigger MS does not necessarily mean larger profits. This simple statement explains the failure of many uptake strategies, since the selection of client profiles is relevant due to the fact that clients with a larger profit potential for the bank are less sensitive to costs and value other aspects of the business-customer relationship like timely responses, post-sales service and trust, among others.
This may be because obtaining the loyalty of profitable customers means they continue to produce the expected income, contributing greater benefits for the Bank. On the other hand, to increase income from clients is essential to manage proactive cross-selling strategies.
This research indicates that when the bank started to base their strategic decisions on marketing and sales, in terms of customer equity, they optimized their acquisition costs and investment in customers. In general, the bank aims its marketing and sales efforts at attracting and maintaining profitable customers or those with greater potential for profitability, which in the long term allows for better allocation of the invested costs. This could be explained by the fact that keeping profitable customers loyal to the company means that they continue to produce the expected revenue or that they increase their spending, hence, contributing greater benefits to the company, which is consistent to the statement made in H4 of this model.
The heart of the matter is not to make all customers loyal in order to retain them but in knowing precisely and reliably which customers should be retained and compensated, so that marketing actions are efficient at generating the expected income and avoiding the costs incurred in persuading a customer not to abandon the company or attempting to recover a customer. Thus, the challenge is to detect with precision the relationship between value, profitability and loyalty that unites the customers and, later, to implement efficient and effective marketing strategies for each specific customer segment.
Therefore, this article advances the existent research by examining the relationship between CVM and financial results. These findings represent important challenges for the bank and for companies, in general, which must manage diverse elements in order to maintain a good trust level. Such management should specifically be based on achieving a good level of communication with clients, not only informing them about the available products and services, but mainly implementing a system of integrated marketing communication that will deliver a consistent message to them.
To interpret the findings correctly, the following limitations of this study should be mentioned. First, the data derived from the empirical study proceeds from a somewhat reduced sample, although it is sufficient to apply the assumptions of the model. In this research, the proposed explanatory model has achieved a relatively acceptable fit with a large number of degrees of freedom and if this study were applied to a larger sample, it would probably fit the model better.
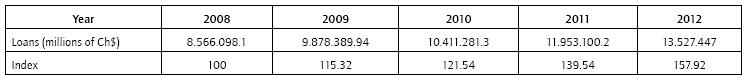
Second, the influence of time on the results by means of a longitudinal design was not contemplated. However, the empirical results have been confirmed with some financial ratios from available data in order to get a picture of the growth of Banco Estado in the last five years before the study. For example, according to the amount of loans, this bank shows a growth of almost 58% during the period (annex). Loans grew more than 5% every year, reaching 13% in 2012.
Third, this paper is a declarative study because the data obtained proceeds from the perceptions and opinions of the executives surveyed, and therefore, although surveys are useful and are the most frequently used method in Social Sciences, the survey is nonetheless a subjective method.
Future research should be carried out in order to determine whether these results can be generalized to other countries for assessing the effect of the intercultural factor. Other factors related to trust, such as commitment, perceived risk, opportunism, and familiarity with the system, could be incorporated as well.