


 English (pdf)
 Article in xml format
 Article references
 Send this article by e-mail
 Cited by SciELO
  Cited by Google
  Similars in
SciELO
Similars in
SciELO  Similars in Google
 Permalink
Introduction
This project deals with commercial management applied to health care services, a field that counts with infinite possibilities to apply modeling techniques such as the queueing theory, methods and times, and linear programming, among others. Under the current unsettled conditions, health care entities, as service-providing institutions, not only need to offer a wide range of services for their users, but also to develop strategies to provide such services appropriately. Therefore, aspects such as users' comfort are critical for success. This variable is closely related to the time a service is requested and the moment it is provided (Jiménez, 2011).
In this way, one of the parameters for estimating the demand for care at the Health Care Service Providers (HCSP) is their operating hours; that is, from 6:00 a.m. to 6:00 p.m. Evidence shows that the assistance process has serious weaknesses, since users have to repeatedly wait for services at several stations; therefore, they are subject to remain standing in multiple lines waiting for the required services. At the first station line users have to wait for the taking of a blood sample, which will be later used by physicians for the diagnosis of diseases. Afterwards, users have to wait approximately one hour for medical consultation. Finally, they have to wait almost 45 minutes to obtain the results of their examinations. Thus, time estimates by the manager are far from the actual estimates, generating a gap of two hours per user, on average. In this way, service operation costs are expected to increase, while users' satisfaction with the service provided diminishes.
Discrete Event Simulation (DES) has been widely used in modeling health-care systems for many years and the number of papers published has steadily increased since 2004 (Günal & Pidd, 2010). This methodology provides elements of judgment with a direct impact on patients' care, cost reduction and users' satisfaction, making possible to achieve an adequate distribution of resources in the health care system (Brailsford & Hilton, 2001). On this regard, Gardner and Berry (1995) carried out a research study in which simulated experiments were developed for treating three groups of patients. The integration of varying techniques is presented as a differentiating element, since the simultaneous application of industrial engineering techniques -recording time, studying demand, and studying the waiting process and discrete event simulation- have been often used separately. All of these have been applied by health service providers to find an optimal solution to their installed capacity problems, which is understood as the recommendations to implement the best response to the problem addressed (Eppen, 2000); in this case, the constant lines users have to make in the customer service area.
In this context, Duguay and Chetouane (2007) described a DES study of an emergency department in a Canadian hospital in which the objective was to reduce patient waiting times and improve overall service delivery and system throughput. In the same way, by determining the optimal number of doctors, laboratory technicians and nurses required, Ahmed and Alkhamis (2009) presented a combination of simulation techniques with optimization to maximize patient performance and reduce patient time spent in the emergency unit of a government hospital in Kuwait. In addition, Knight, Williams, and Reynolds (2012) proposed a simulation for modeling the selection of patients for knee surgery in Wales, United Kingdom. Using hierarchical models, Hall (2013) tried to resolve waiting times by establishing a sequence of activities patients must go through in order to receive attention, also including the development and implementation of performance measures for the system. Norouzzadeh, Riebling, Carter, Conigliaro, and Doerfler (2015) proposed a simulation model using DES for the optimization of the total time patients spend in a clinic in the United States. More recently, Kad, Kuvvetli, and Colak (2016) studied the blood laboratory of a university hospital via discrete event simulation to analyze processes and bottleneck operations, while Demir, Gunal, and Southern (2016) developed a DES model for capturing individual patient pathways until discharge.
After this introduction, which presents the problem, goals and justification of our study, the paper is organized as follows. The second section exposes the theoretical grounds for modeling systems and their application in business. The third section is a theoretical approach to the methodology and introduces the probability distributions that can be applied; ProModel will be used for the simulation process and Statfit and Excel for statistical analysis, so that program frameworks with information about times could be obtained for modeling the probability distributions of customer service times. The fourth section sets forth the methodology suggested, as well as the data and the information to be used; field research, analysis of information and modeling application are presented in this section as well. The last section gathers the main findings of our research, as well as its limitations, and signals future research lines.
Theoretical Framework
Work Measurement
Through a set of procedures, work measurement aims to establish the time it takes a qualified worker to carry out a defined task according to a preconfigured rule of execution (De-la-Fuente-García, Gómez-Gómez, García-Fernández, & Puente-García 2006). It is the application of diverse techniques, such as work measurement and the study of methods, to systematically study the work of man in all contexts in order to identify improvement plans by inquiring about the determinants of efficiency and productivity of the object under study (Aguirre-de-Mena, Rodríguez-Fernández, & Tous-Zamora, 2002; meyers, 2000; on, 2005). The study of methods is considered essential to decrease the proportion of work and discard the redundant processes carried out by employees, with the objective of replacing inappropriate tasks by efficient activities. Thus, when the causes of unsuccessful time are established, it is feasible to carry out strategies such as, for example, redesigning processes that do not add value or combining tasks when possible (Alfaro-Beltrán & Alfaro-Escolar, 1999; Castanyer-Figueras, 1988; Meyers, 2000; Prieto, 2007).
Work measuring general procedure is made up of six stages: (i) task selection, (ii) relevant information recording, (iii) critical data analysis, (iv) work measurement, (v) standard times collection, and (vi) definition of the operational method. It is important to note the strict observance of the previous stages when defining the standard time (Neira, 2006).
Queueing Theory and Work Measurement
To define a queue line service, the arrival of the customer and a service provision must be occurring at irregular intervals. Most of them follow the basic process for formulating a queueing model, that is, units requiring a service arrive at the system. Such units enter the system and join the line. At certain points in time an element from the line is selected to be provided with a service by means of a rule known as "queueing discipline". Then, the "service discipline" provides the unit selected with the service requested (Thierauf, 1995). Lines are common phenomena in diverse industrial and commercial activities, such as banks and stores, production orders, service stations, and others (Calderón, 1979). Healthcare services are not the exception, since various research studies on the field have reviewed the application of queueing theory in specific categories.
The use of the standard M/M/s model, its conjectures, extensions, and implementation in HCSPS is crucial to establish the necessary number of servers to offer an adequate service and increase consumer satisfaction. We found several studies on waiting queue models, such as the McClain model (1976), which analyzed different techniques to determine the incidence of bed allocation policies on utilization, waiting time, and the probability of rejecting patients. Nosek and Wilson (2001) focused the use of queueing theory in pharmacy applications with a special emphasis on identifying tactics to improve client fulfillment by predicting and reducing waiting times and adjusting staffing. Green (2006) approached queueing theory to show its application in healthcare by means of models, which argued the correspondence of variables such as time delays, installed capacity, and number of nurses. In addition, Fomundam and Herrmann (2007) studied the application of queueing theory in specific variables, such as waiting time and utilization analysis, system design, appointment systems, and system size. Meanwhile, two research papers reviewed the existing academic literature in the field of discrete simulation in healthcare settings. In the first instance, Jacobson, Hall, and Swisher (2006) report that a significant number of papers are devoted to understand the relationship between health systems inputs (hours and routes of care, triage, installed capacity, and human capital) and their products (waiting times and evolution of patients, designation of medical personnel, and use of facilities). Additionally, Lakshmi and Appa-Iyer (2013) established three categories for the classification of methods in health care systems: (i) design (type of care, facilities, pharmaceutical services); (ii) operation (scheduling of resources and patients); and (iii) analysis (waiting times and utilization, duration, and costs).
Basic Structure of Queueing Models
The queueing phenomenon is comprised of six main elements: (i) population source; (ii) the mechanism used by customers to arrive at the service facilities; (iii) the characteristics of the lines created; (iv) the mode of selecting customers waiting in line; (v) the characteristics of service facilities; and (vi) the conditions in which a customer leaves the system [the customer returns or does not return to population source] (De-la-Fuente-García & Díez, 2000). The specific case of the population, as the set of potential users of the system, can assume two conditions: restricted or indeterminate. In the first case, when the number can be limited but there is a marginal condition where the arrival of an additional client does not affect the possibility of arrival of another user, it is considered infinite (Miranda, 2003).
Lines are a tool where customers wait before being served and they have a maximum permitted amount of customers admitted. Lines may be delimited or unrestricted, depending on the identification of the number of patients. Standard models are based on the existence of a finite number, even when the number of clients tends to increase exponentially (relatively high) beyond a certain predetermined threshold, as dealing with such a number can complicate the analysis of information. The queueing discipline is the system through which customers in line receive the service (Render & Hanna, 2006). Frequently, the queueing systems that reach their maximum amount of customer tend to be very low and, therefore, need to assume a finite line (Calderón, 1979). Service Discipline
The service discipline is the procedure used to provide customers with a service requested. To determine the service procedure completely, the number of servers in the discipline and the probability distribution of the time each server needs to complete the service should be known (Abad, 2002). As such, the operating time is registered from the moment a patient receives assistance in the facility until the end of the procedure. Then, to define a queueing system, the probability distribution of operating time must be specified for each server and different types of users, although it is common to assume the same distribution for all servers (Roscoe & McKeown, 1986). In this context, the exponential distribution function has been the most used technique for the time variable due to its employability and adjustment conditions (Hiller & Lieberman, 2002).
Table 1 shows the mathematical formulation used to determine the service discipline, in which the formulae correspond to the queueing system M/M/s: Multiple-channel Queueing Model, a multiple-channel queueing system adjusted based on patients' arrival. In this way, it is assumed that users waiting for the service form a single line are assigned to the nearest server with vacancies. Single-phase multichannel waiting lines are currently found in several HCSPS, where customers start from a frequent line to later advance towards the first available auxiliary nurse. Thus, two conditions are assumed for the model: (i) a Poisson probability distribution and an exponential distribution of service times, and (ii) the first to arrive is the first to be taken care of, since all servers work at a constant speed. In addition, the other assumptions stated above are applied to the proposed model.
Table 1 Mathematical Formulation Used for the Model.
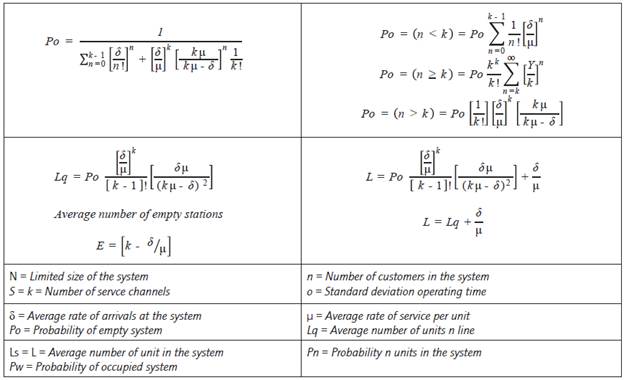
Source: own elaboration with data from Thierauf (1995)
Simulation
In spite of the unquestionable advantages of econometric models they present some limitations. The first is the estimation technique as such, considering that once the parameters and the exogenous and dependent variables have been determined the causal relations to endogenous variables may be estimated. However, once these values are established, the link is always the same. For example, if a relation between consumption and income is established, as long as no other estimation is executed, the quotient will always be the same, and the same independent variables will always operate as well. The second limitation is that econometric models are very unspecific and fundamentally contain linear equations. The inclusion of nonlinear relations in some of these models is an exception (Pindyck & Rubinfeld, 1998). This is due to the difficulty and, in some cases, the impossibility of finding solutions with non-linear systems. Finally, non-economic factors cannot be included in econometric models.
In view of the aforementioned limitations, it is possible to use experimental procedures in the quest for particular solutions. This is the case of methods used in engineering that do not seek to find general mathematical solutions, but to apply forms of numerical, graphical or other types of solutions, as simulation models do. For this reason, the use of simulation tools for business problems has become very popular in the last decade (Funke & Frensch, 1995; Sternberg & Frensch, 2014) due to their innovative and dynamic focus, which differs from static models. With this approach, it is possible to simulate scenarios, offering an incomparable opportunity to study human and organizational behavior and support decisions in work environments where both subjects and their actions are changing constantly and simultaneously (Funke, 1991).
Then, the process through which the computational model of a system is sketched and implemented is conceived as simulation, making possible to carry out experiments in order to understand the behavior of the system or evaluate strategies for operating the system (Banks, Carson, Nelson, & Nicol, 2005; Coss-Bu, 1993). Another way of conceptually understanding the concept of simulation was proposed by Dunna, Reyes, and Barrón (2006, p. 3), who refer to this phenomenon as "the set of logical, mathematical and probabilistic relationships that integrate the behavior of a system under study when a certain event occurs". It is also defined as the process of devising computer models that describe the essential part of the behavior of a system, as well as designing and conducting experiments with such models for supporting decision-making based on the conclusions derived from results analysis (Ríos, Ríos, Martín, & Jiménez, 2008).
In summary, simulation is considered an essential tool for verification in different fields of knowledge. Thus, from statistics, computer science, engineering, physics, chemistry, and, of course, economics and management, this method shows a wide range of applications in commercial, service, financial, and industrial scenarios (Ríos et al., 2008).
Methodology
Making decisions about the problem already described are part of a sequence of interdependent choices made throughout a changing process, according to the sequence of decisions or in both directions (Edwards, 1962). Since the process is dynamic, decisions should be made based on information collected in real time (Brehmer, 1992). Thus, this study is an analytical research with a quantitative approach. Queueing theory and discrete simulation are applied to find the probability distributions of operating time and demand in order to design a customer service module. Most of the variables used are summarized in the literature review, specifically in Fomundam and Herrmann (2007), and Lakshmi and Appa-Iyer (2013), who describe some waiting time indicators, such as leaving without treatment ratio, variable arrival rate, priority queueing discipline, and minimum waiting time.
Under the premise that the institution is subject to a strong and permanent competition, the improvement process of system performance requires an efficient service provision that contributes directly both to retain and to obtain new users. High quality and efficiency are directly correlated with the volume of users served, the reduction of both waiting times and the total permanence, the reduction of extra payments made to staff, coupled with reasonable rates of staff utilization and reduction of system downtime. Thus, queuing models support management decision making by providing information required to balance service costs with wait-line costs (Jacobson et al., 2006). In this sense, a high percentage of waiting line analyses uses both different measurements and system performance variables. The most common are: average time spent per customer in the queue; average queue length; average time per customer in the system, considering both waiting time and service; average number of customers in the system; percentage of service inactivity; system utilization rate; and percentage of customers in the system. In addition, this work relied on historical information that exceeded 380,000 records and the methodology brought together different activities, which are described below.
Diagnosing the Current Situation
At this stage all the institution processes have been examined and the data from previous studies collected for analysis in order to create a comparative basis of the "before" and "after" the project.
Making a Study of the Methods and Times
Customer service activities were analyzed. The protocol followed is based on the standards by the International Labour Organization (ILO). Flowcharts were created for the operations and processes, and supplements were valued for each task. Then, times were measured with a chronometer and standard times for each of the described operations were recorded.
Analyzing Demand
Data was collected through direct observation and time was recorded between the arrivals of users at the system for analysis and modeling. Historical information of the company was used to adjust the demand and propose the theoretical probability distributions that best suit the company.
Queueing Study
Current queueing system was analyzed with data for the demand, allowing to develop the model according to the nature of the system. An M/M/n model, which should be contrasted with the study, has been proposed as a hypothesis.
Creating a Simulation Model
The simulation was carried out using the information of the aforementioned processes and the queueing system analysis. ProModel software was used for running a simulation that describes current reality as accurately as possible.
Validating the Simulation
Random characteristics were validated with the first model using hypothesis testing and confidence intervals. In order to determine the consistency of the model, it was compared with real data. In case of discrepancies, variables that "make noise" were adjusted in the initial model.
Experimenting with the Simulation Model
After verifying the consistency of the model the system was tested using different improving scenarios, whose behavior was analyzed in order to identify the best adjustment to reality.
Analyzing Results
Once improved results for the different scenarios were obtained, the effectiveness of suggested improvements was contrasted. In addition, some strategies that contribute to solve the problem of long-waiting lines were proposed.
Hypothesis
Diagnosis of the situation suggests different sources are causing this problem. The first is focalized in the lack of knowledge about system's capacity, since times for processes (both old and new) have not been determined. The second is the variability on the quantity of available doctors, their shifts and their distribution in the system. A third source is the lack of demand studies to formulate an efficient service model.
Field Research
Input data analysis was carried out using the historical database of a HCSP for the period 2014-2015, which includes 384,237 records with information about patients and the tests they were subject to.
Types of Patients
With the aforementioned information, 10 types of patients were defined along with the potential combinations of tests they could take. This covers 80.25% of the patients in the database and 69.78% of the tests performed during 2015.
Data Collection
Times of the activities performed for each type of customer were recorded. These activities are: calling out the patient, taking a pre-sample of blood, drawing blood, weighing the patient, performing a vision pre-test, taking measurements, applying a spirometry questionnaire to the patient, performing an audiometry test, performing a medical assessment, and printing the results of examinations.
Times
Information was adjusted according to the variability in times to define probability distributions with the best fit to the real data. This procedure required a descriptive analysis of data by means of frequency histograms and central trend measures. Table 2 shows an example of the descriptive statistics and the frequency histogram for the analysis of the activity "calling the patient".
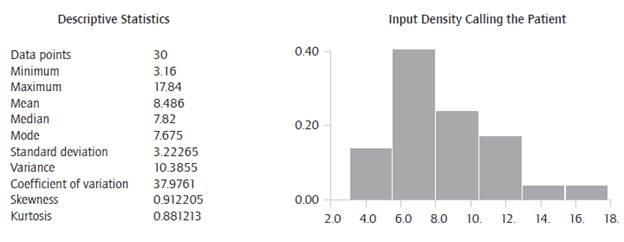
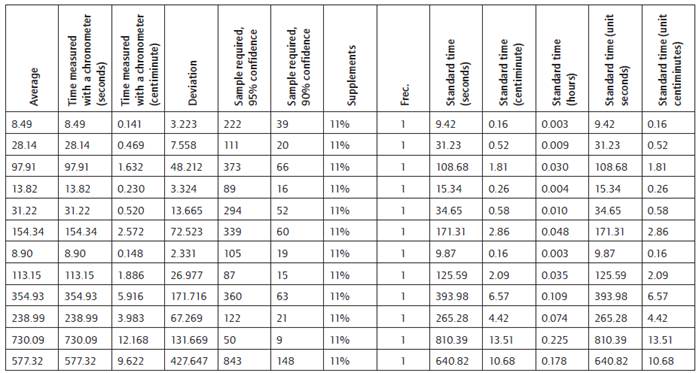
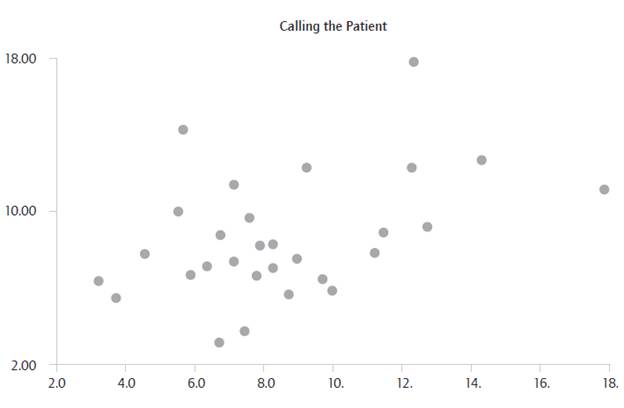
Table 3 shows the variability of operating times, which suggested adjusting the data to probability distributions. Then, an independence analysis was performed both for times and demand for each type of customer using scatter plots and runs tests to verify the lack of correlation of data. Graph 1 shows the independent analysis for the activity "calling the patient".
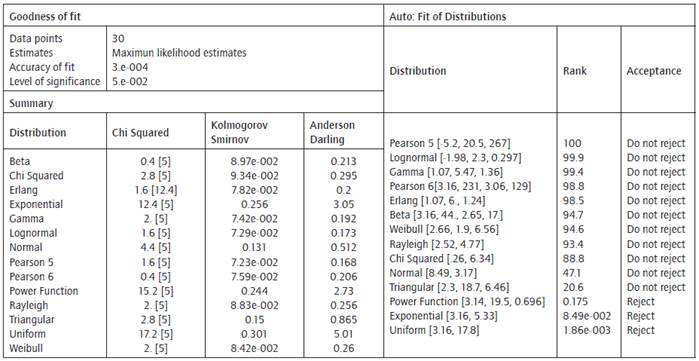
After statistical analysis and independence tests, the adjustment of distributions was performed applying Chi-squared, Anderson-Darling, and Kolmogorov-Smirnov tests. These were applied using the maximum likelihood estimation. It is remarkable that all the times, which are continuous, adjusted to known distributions. The activity "calling the patient" is presented again as an example.
Statistical Analysis of Demand
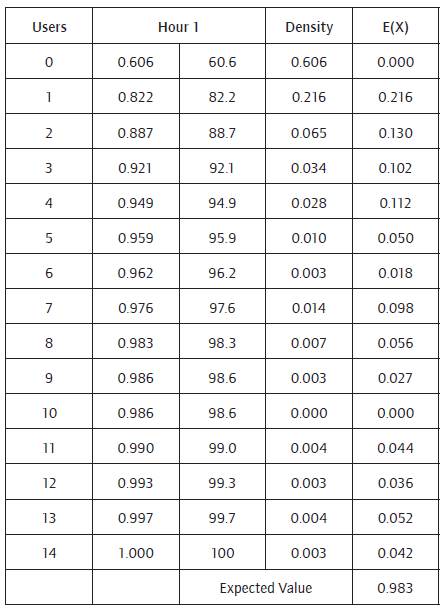
The demand has been adjusted for each type of customer according to the data collected. For this purpose, time was divided into hours and each hour adjusted to a probability distribution. In the case of demand, it was found that the arrival of patients did not adjust to known discrete distributions, as the theory states; especially in the case of the Poisson distribution. In view of this situation, an empirical discrete distribution was created for each customer in each of the defined windows of time (Harrell, Gosh, & Bowden, 2000). The adjustment for the type of customer 1 at hour 1 is showed below. There was a total of 123 probability distributions to model demand and 12 to model operating times.
Results
Presentation of the Model
The proposed system is made up by 48 entities, as follows: one line for arrivals, three cubicles for samples, 6 cubicles for vision tests and spirometry, 14 offices for doctors, 3 offices for audiometry, 1 weighing scale, 1 place for measuring patients, 4 waiting rooms, and 15 spots for assistants. Additionally, we develop a pilot test with an electronic device in order to test the response time and develop strategies to improve the process for calling patients.
Entities
The model has 10 types of entities that represent and match the types of customers defined above.
Networks
A total of 36 networks were created to simulate all the referrals that take place in the customer service area. Networks were defined based on speed and distance, a task that demanded real measures between each place of work where patients, doctors, and assistants circulate. Networks were defined as follows: 6 networks for spirometry and vision tests, 3 for speech therapists, 14 for physicians, 3 for laboratory samples, and 10 networks for users to pick up diagnosis.
Resources
A total of 26 resources were modeled, which correspond to the number of staff that provides services in the facilities of the HCSP. The resources proposed get a speed of 20 users per minute. In the same way, 6 resources were proposed for vision and spirometry tests, 3 for laboratory samples assistants, 14 for physician specialists, and 3 for speech therapists.
Process
The process describes all the procedures that patients have to go through in the system (figure 1). The process varies depending on the type of customer. The programming of the process required 341 lines of code to model the whole system with the 10 types of customers. In addition to the ProModel codes, some codes were created to guarantee that the model accurately represents the process intended to be modeled. Arrivals were created for each of the 10 types of selected customers, who arrive at a line with arrival cycles that will be explained later. The arrival frequency is 24 hours. Eight types of turns were defined according to the services currently provided at the HCSP. Figure 1 describes the procedures that each patient has to go through and the process carried out within the system.
Global Variables
A total of 12 global variables were created; among these, the records of arrivals for each type of customer to accumulate the total of customers per day.
Arrival Cycles
Ten arrival cycles were created, one for each type of customer, as to represent the demand of customers per day and hour. Each hour is represented by a discrete empirical probability distribution.
User Distribution
The demand of each type of patient was adjusted for each hour of care provided. The resulting empirical distributions of the aforementioned adjustment were entered as user distributions in ProModel (Blanco & Fajardo, 2003). In total, 123 user distributions were created. These will represent the demand of entities in the model.
Stream
A seed was provided for ProModel's random number generator in order to change the seed in each of the runs and carry out the statistical validation of the model. In this simulation streams were added starting with number 1.
Model Validation
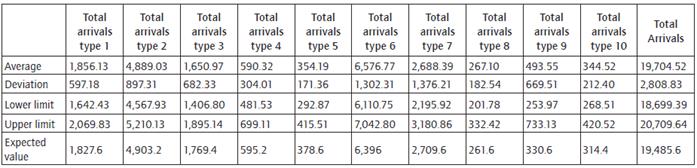
The model was run independently 30 times throughout a year for validation. Besides, 30 different seeds were used. The total amount of arrivals was counted for each run and each type of patients in order to determine the mean and standard deviation of total arrivals per type of patient. The statistical significance was 5%, which represents a value of Z = 1.96. For this case, N = 30. Table 6 shows simulation data with a statistical significance of 95%. With the data provided above, a confidence interval was developed for each patient type. Additionally, patients' expected value in each confidence interval was compared in order to verify its position within the limits created. As a result, 100% of the cases placed within the limits of the confidence interval, suggesting that the model works as expected.
Analysis of Model Results
The simulated year of operation allowed concluding that, on average, users wait 44.72 minutes to be taken care of by the auxiliaries, whether for spirometry or vision tests or in blood sampling. In the results area, the user stays an average of 36.34 minutes. Laboratory sampling process records the longest waiting time with a total of 64.45 minutes. This data is relevant, considering that users have further vision or spirometry tests that take 44.72 minutes on average. Therefore, a user with laboratory, vision or spirometry tests waits for 109.17 minutes in the system, adding up the waiting for the results (36.4 minutes); this means that an individual must wait 145.51 minutes in the system, without counting the times for other processes.
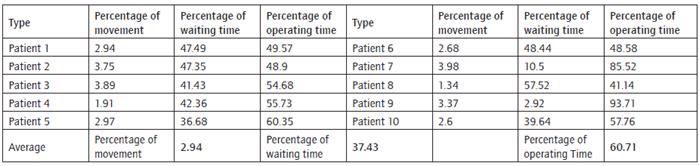
Along those lines, vision and spirometry tests assistants have been involved the most, with an average of 85% of the occupation, which partly explains the bottleneck in the waiting room. The referral percentage consumed about 2%, an idle period due to the interruption of the activity in motion in order to call the next user. Something similar happened with doctors, who take a similar time to call the next patient. Table 7 summarizes the behavior of the several patient types and shows time consumption percentage for a user in the system. Average waiting time represents 37.43% of the total time users spend at the HCSP, while average operating time is 60.71%, and average referral time 2.94%.
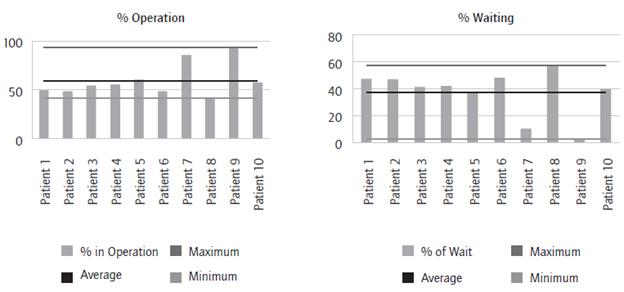
Patient types 7 and 9 waited the least in the system due to the number of processes they required, while costumer type 8 waited the longest, with a 57% of waiting time, as seen in graph 2. The chart on the right shows that patients had an average operating time of 59.6%, except users 7 and 9, who had the best care percentage. The graph on the right allows us to infer that, on average, 59.6% of the time clients were receiving some type of service. Therefore, the remaining 40.4% they were waiting for a service. Patients 7 and 9 presented effective service times (+ 85%).
Discussion
Different studies on the subject that were reviewed in this work allow concluding that the theory of queues has been recurrently applied in companies of different sectors for the evaluation of processes that involve waiting lines. Several works show its application in different hospital activities, such as emergency services, cardiology units, surgery services, and operating theatres. Its greatest application has taken place in the allocation of scarce resources (Fomundam & Herrmann, 2007) and health care management (Lakshmi & Appalyer, 2013). Health policy researchers have even tried to apply these techniques in the analysis of the value chain of health systems. However, a large percentage of the formulated queueing models do not count with validation mechanisms, possibly restraining their application among physicians and hospital administrators (McManus, Long, Cooper, & Litvak, 2004). In this sense, this work is a great contribution for exploring the usefulness and implications of the theory of queues in the supply and demand of health services, as it shows how work measurement techniques, queuing models, and discrete simulation are combined in the analysis of health care processes in a private institution.
Our results show very important practical implications, as they demonstrate that the current capacity of the health institution analyzed overestimates the use of measures that do not consider the randomness of the demand, represented in the random arrival of users. Therefore, utilization percentages can be more accurately determined using probability distributions.
Another important finding of our research is that the probabilities of providing a good service are mathematically determined by the duration of tests and the arrival rate of users when a fixed number of doctors and nurses are available; although common capacity utilization measures, such as daily arrivals and average occupancy, do not capture the deficiencies and delays related to flow in the system, thus representing a failure that often leads to wrong decision making.
Finally, although results can be generalized to peer institutions with similar demand patterns, they are not necessarily applicable, since other HCSPS may be operating below their real capacity or count with specialized sub-units. In particular, our results can significantly underestimate the conditions of small institutions, whose rejection levels could be higher compared to large institutions. Similarly, the sensitivity analysis included in this paper describes the expected performance under an arrival rate that is consistent with the observed service times in the sample, which may differ from one institution to another, as it also could happen with results.
Conclusions
The discrete event simulation is able to model complex situations that in many cases have no analytical solutions. These models allow representing a particular analytical scenario and its management in a more flexible way and with fewer restrictions, enabling a closer look at reality, as required by this type of context. The model, as a final product of this study, allows decision makers to improve service operations in their organizations through the insertion of several types of mechanisms that expedite the process, ranging from the patient call and the use of some technological devices. Based on the discrete simulation model proposed in this research, waiting times at the HCSP studied have decreased around 50% by decreasing the number of operative tasks that physicians and nurses should perform and implementing an electronic ticket dispenser.
The main cause of long waiting times for users at the HCSP studied was the multichannel organization process followed by this institution and the high frequency of users; i.e. the time running between the submissions in every channel until the final discharge of the user. This is usually a long process when patients show particular health problems. Therefore, the reconfiguration of the administrative processes is approached as a possible solution to reduce the time of service. By experimenting with the HCSP'S current system was possible to evaluate a configuration corresponding to the improvement plan that should be defined by the institution.
With the results obtained from the simulation event, the following alternatives have been presented in order to reduce the waiting time users are exposed to:
Hire personnel to call out patients so that assistants do not interrupt their work. The results of this scenario showed that when assistants did not interrupt their activities for calling the next user there was an increase in the use of resources thanks to the elimination of downtime.
Establish overlapping shifts for doctors. This scenario generates an increase in doctors' availability during times of high flow of patients. This alternative produces a reduction in lines and increases the rate of resource utilization.
Design a dashboard to depict operation efficiency indicators. This option arises from a brainstorming session with the management, which emphasized the need of a system for the control and measurement of results.
Arrange appointments to reduce the random effect of demand. This option is executed under the assumption that the commercial area must schedule at least 40% of the demand for the services offered. In this scenario, times are significantly reduced for users, and there is less need for full-time doctors and assistants, and work under the appointment method.
Install an electronic ticket dispenser so doctors do not interrupt their activities to call the next user. This scenario was contrasted with the option of having a person calling patients, showing greater benefits both in time and money.
Limitations
The main limitation of this study lies in the resistance to change that emerged in the operating staff, since the idea of implementing control measures makes them feel there is a high risk of losing their jobs. In that sense, was necessary to carry out awareness sessions to explain that measures were only intended to improve customer service.
Future Research
Colombia has experimented radical changes in its health system during the last decade, represented in an accelerated increase in competition, an increase in service coverage that affects the occupancy rates of public and private hospitals, and a larger number of organizations dedicated to health care services. In this context, contracting methods, service provision, and forms of payment for health care have also evolved, converging in a crisis in the hospital system that calls for research about its response capacity. To this end, it is possible to integrate simulation and optimization techniques in the evaluation of support models for the formulation of health policies aimed at improving the use of resources in the operation of emergency units in Colombian hospitals.

