English (pdf)
 Article in xml format
 Article references
 Send this article by e-mail
 Cited by SciELO
  Cited by Google
  Similars in
SciELO
Similars in
SciELO  Similars in Google
 Permalink
Introduction
Quinoa (Chenopodium quinoa Willd.) is a food native to the Andean region of South America that has become popular worldwide due to its healthy attributes (IICA, 2015). Quinoa proteins contain all the essential amino acids for human nutrition (Fotschki et al., 2020; Vega-Galvez et al., 2010), which is why it is considered a complete food (Maradini-Filho, 2017) . Quinoa grain is comparable to milk protein (Hussain et al, 2021) as it contains amino acids such as lysine, threonine and methionine (MINAGRI, 2017), in addition to fiber, minerals, phenolics, saponins, phytosterols (Li et al, 2018) and vitamins (Hussain et al, 2021; Tang et al, 2015). This food is also effective in reducing total cholesterol (Yao et al, 2014). Data published by FAOSTAT (2019) indicate that Peru, Bolivia and Ecuador are the main quinoa producing countries, accounting for 80% of the total world production.
In the first half of the 2010s, Peru registered a gastronomic boom amidst a context of economic growth. Additionally, the United Nations (UN) declared 2013 to be the International Year of Quinoa (IYQ) in order to promote this nutritious grain and increase global consumption (FAO, 2013), stating that quinoa was an ally in the fight against hunger and food insecurity (MINAGRI, 2017). This combination of events led to greater visibility of Andean products. Indeed, during this period, there were strong efforts to boost Peruvian quinoa consumption internationally. Once Western countries began promoting the consumption of this "superfood" because of its high nutritional values, the price of quinoa increased. Gamboa et al. (2020) found that while traditional quinoa farm-households in the central highlands of Peru increased quinoa production as a response to the new price, they did not necessarily increase consumption.
The COVID-19 pandemic has increased the perceived importance of a healthy and balanced diet as a shield against current and future diseases (Borsellino et al, 2020; Eftimov et al, 2020; Encalada-Añazco et al, 2021; WHO, 2021). Thus, eight out of ten Ibero-American consumers now spend more on healthy food than before the pandemic (Financial Food, 2021). Specifically, in Spain, health was the main concern of 19% of the population by the end of 2019, a percentage that reached 50% by the middle of 2020 (pandemic time) (Reason Why, 2020). Peruvians are not far behind this trend. In one survey, more than 70% of Peruvians stated that they are now more conscious of the food they consume as a result of the pandemic (El Peruano, 2020). Current knowledge encourages the use of quinoa among all people, especially those who are more vulnerable to COVID-19, like children and the elderly (Hussain et al, 2021).
According to Higuchi and Maehara (2021), studies related to food choice reveal that non-sensory aspects have an impact over consumption decisions, which is similar to Carrillo et al. (2011) and Rozin (1996) findings. The decision-making process, for instance, also considers the frequency of consumption of a product, or even where to buy a certain kind of food. During such a process, consumers consider other intrinsic and extrinsic factors before opting for a product (Ragaert et al, 2004). Many of these factors are associated with trends in consumption patterns (Verbeke & Vackier, 2005) that are based on variables such as greater health consciousness. For example, some studies have found that consumers with a greater concern for the effect of diet on health are eating more foods that promise to extend their life and improve its quality (Rojas-Rivas et al., 2019). Moreover, many review studies have revealed significant influences of the socioeconomic characteristics and consumers' behavior towards food (Encalada-Añazco et al, 2021; Rivaroli et al, 2020). For instance, attitudes of urban dwellers are highly dependent on nutritional aspects, which is prompting demand for better health services (Muziri et al., 2021).
In an attempt to explain the consumer decision-making process with regard to quinoa, this research follows a theoretical and quantitative approach, inserted within the context of the COVID-19 pandemic in Peru. In order to design appropriate policies to expand domestic demand, it is important to identify the range of motivations, attitudes, reasons, behaviors and demographics of Peruvian quinoa consumption (Higuchi & Maehara, 2021). Moreover, studying the consumption of domestic quinoa and identifying factors that impact on the propensity to purchase this product during the pandemic is considered relevant for the current literature, even more so in a country where this is considered a traditional food. Therefore, the objective of this study is to analyze the factors involved in quinoa consumption in Peru during the COVID-19 pandemic. To our knowledge, this is the first study conducted in Peru that combines the health factor, concepts from the theory of planned behavior (TPB), and socioeconomic characteristics of Peruvian quinoa consumption decisions during the COVID-19 pandemic. This empirical approach contributes to a better understanding of consumers' expectations and perceptions of their behaviors regarding quinoa consumption during pandemic times.
The remainder of this article is organized as follows: the second section presents a literature review on the subject, the third section explains the methodological approach adopted, section four describes the results and discussion points, and the last section includes the main conclusions and policy recommendations derived from our main findings.
Literature review
Impact of international trade on Peruvian quinoa
Quinoa (Chenopodium quinoa Willd.) is an ancestral food grain native to the Andean region of South America (MINAGRI, 2017). Quinoa consumption precedes the era of the Incas (15th and 16th centuries), being a staple food of Andean people for more than 5,000 years (MINAGRI, 2017). Quinoa has gained worldwide popularity and growing demand in international markets (FAO, 2013; IICA, 2015) because of its nutritional properties, the values and traditions associated with its production, and the wide range of food preparation methods and recipes (Furche et al, 2015; McDonell, 2020).
The UN declaration of the IYQ in 2013 marked the beginning of a period of unprecedented growth in Peruvian quinoa exports (McDonell, 2020). Rural farmers who had long produced quinoa increased their production to take advantage of the soaring prices, and the cultivation of potatoes or legume crops was replaced by quinoa (McDonell, 2020).
In 2014, Peru became the world's leading quinoa exporter, with 36,600 tons, displacing Bolivia to the second position (29,500 tons). Bedoya-Perales et al. (2018) reported that between 2008 and 2014 quinoa exports increased approximately 18 times, while its price doubled. In 2010, quinoa production exceeded 40,000 tons, and in 2012 it surpassed 44,200 tons, with exports of 10,000 tons that year (MINAGRI, 2017). Between 2012 and 2016, the value of quinoa exports increased 190%, while production volumes (tons) had a growth of 216%.
In Peru, because of this revived awareness of the "golden grain of the Incas," there was a dramatic change in the distribution of consumption of this superfood within the domestic market. Peruvian consumers on lower incomes, who are mainly located in the Andean region, were negatively affected by the higher prices and began to substitute highly nutritious quinoa with other less nutritious foods (Bellemare et al., 2018; Eduardo-Palomino, 2018; Gamboa et al., 2020; McDonell, 2020). These patterns have created concerns about the welfare of rural households in the Andean region (Bellemare et al., 2018; Eduardo-Palomino, 2018; Gamboa et al, 2020). On the contrary, people in the city of Lima consumed higher levels of quinoa than those consumed by people in the Peruvian Andean region. As the A and B socioeconomic sectors (Peruvian classification) have more access to communication and technology, people are highly informed and motivated to care about their health and nutrition. For instance, in a survey conducted in 2013 in Lima, the Peruvian capital, and Callao (the country's leading port city), 85.4% of households declared they consumed quinoa (Andina, 2013).
Despite the intense advertising campaigns associated with the IYQ, quinoa was already known and consumed by Peruvians because it is a traditional Andean food. Thus, we formulated the following hypothesis:
H1: Quinoa consumption in the capital was related to tradition even before the 2013 IYQ declaration.
Relationship between quinoa, nutrition and COVID-19
The COVID-19 crisis accelerated the trend towards healthy eating globally, which was driven by the greater concern of consumers over the quality and nutrition of their food. The desire to consume nutritional foods emerged in this period because many consumers became increasingly aware of the importance of maintaining good health (Borsellino et al., 2020). Graziano da Silva (2020) reports that the relationship between nutritional status and immunity has been widely demonstrated, while the WHO (2021) reported that people with chronic diseases, such as cardiovascular and respiratory diseases, obesity, diabetes and cancer, are particularly vulnerable to the COVID-19 virus. Thus, a good diet provides better protection against COVID-19, both by reducing mortality and increasing recovery without chronic health problems. This good nutrition is seen as necessary to combat the virus and undoubtedly involves access to a variety of more nutritious foods (Borsellino et al., 2020).
Access to nutritious food was a major challenge under the lockdown measures that were imposed in many countries because of the pandemic (Graziano da Silva, 2020). The distribution chains of fresh products such as fruit and vegetables were affected by the constraints of social distancing due to COVID-19 (Borsellino et al., 2020). Moreover, a survey carried out in May 2020 by the Peruvian Institute of Statistics and Informatics (INEI) to citizens from Lima and Callao indicated that 14% of households lacked the economic means to purchase the necessary protein foods for a balanced diet (Presidencia del Consejo de Ministros de Perú, 2020). Nonetheless, the nutritional quality of quinoa as a whole grain stands out when compared to other staple foods, such as wheat, corn or rice (Hernández et al., 2020), for being an amino-acid complete product that is easy to digest, thus meeting the growing expectations of consumers regarding healthy diets (FAO-ALADI, 2014; Gamboa et al., 2018; Muziri et al., 2021). Furthermore, quinoa is found in a wide range of processed foods and beverages, such as snacks, bars, functional drinks, breakfast cereals, liqueurs, baby foods and whole grain foods, being also suitable for vegan diets (Hernández et al., 2020; MINCETUR, 2019). Therefore, to analyze this topic, we formulated a second hypothesis:
H2: Peruvian people who are concerned about their health and nutrition needs tended to consume more quinoa during the COVID-19 outbreak.
Theory of planned behavior (TPB) applied to the health and socioeconomic aspects influenced on quinoa consumption
Based on the precautionary principle alone, choosing quinoa appears to be an entirely rational decision (Higuchi & Maehara, 2021). One of the most important assumptions of TPB is that consumers are rational in their decision-making processes and their actions, so that cognitive approaches can be used to anticipate behaviors (Ajzen, 1991; Lee & Yun, 2015). This theory presumes that the likelihood of a certain behavior is a function of the human being's conscious intention to perform it (Scholderer & Grunert, 2001), which in turn is assumed to be a weighted average of three conceptually independent variables: (i) attitude towards the behavior, which is determined by beliefs about its outcomes and their evaluation (Higuchi & Maehara, 2021) and entail consideration of the outcomes of performing that behavior; (ii) subjective norms (or social norms), which are determined by beliefs about the expectations of others (perceived social pressure) and motivation to acquire a behavior (Ajzen, 1991); and (iii) perceived behavioral control, determined by self-efficacy and beliefs about the controllability of facilitating conditions, past experience and inhibitory factors or anticipated difficulties (Ajzen, 1991).
The diverse non-sensorial factors have a significant influence on a consumer's food choice. Therefore, understanding the role of these factors enhances the comprehension of dietary behavior (Carrillo et al., 2011). Recent studies have classified the attributes of foods into those that accomplish healthy nutritional and functional attributes (Bedoya-Perales et al., 2018; Lee & Yun, 2015; Zevallos et al., 2014), convenience (Marquart et al., 2008), health and safety guarantees (FAO-ALADI, 2014; Nasir & Karakaya, 2014), and special characteristics like expression of cultural traditions (FAO-ALADI, 2014). As a result, when clients make food purchasing decisions, health-related attributes and non-health-related attributes, such as taste, familiarity and convenience (Lee & Yun, 2015), become relevant. Consumers' perceptions towards the health benefits of foods are important for understanding preferences (Carrillo et al, 2011; Mitterer-Daltoé et al, 2013; Muziri et al, 2021; Ragaert et al, 2004; Rojas-Rivas et al, 2019; Verbeke & Vackier, 2005). Quinoa can meet at least two of these features: it is a healthy food and it has ethnic characteristics associated with cultural traditions (FAO-ALADI, 2014; Hernández et al, 2020).
Additionally, reviews of the socioeconomic variables used in the literature to study the influence of numerous factors on the behavior of specific groups of people have been widely developed (Füsun-Tathdil et al, 2009; Misra et al, 1991). For instance, Hjelmar (2011) suggests including demographic characteristics as explanatory variables to describe, for example, a typical organic food consumer, where Nosi et al. (2020) explored the quinoa case. There is some evidence that demographic characteristics such as age, gender, education and income influence consumers' attitudes and purchasing behavior towards superfoods (Encalada-Añazco et al, 2021), specifically craft food (Rivaroli et al., 2020). In the specific case of quinoa consumption, it is related to the demographic consumers belong to, their regional location, and the price of the product (Ayala-Macedo, 2003). It is also said that the demand for healthy food increases at higher income levels (FAO-ALADI, 2014; Nosi et al, 2020). As an example, Park et al. (2007) mention that the "health-aimed stage" correlates income with an increased consciousness of the effect of food on human health, which means that the attainment of beauty and healthy living has a direct association with class level in society (Muziri et al, 2021). Moreover, the income factor seems to influence the choice of the location and the quantity of craft food consumed (Rivaroli et al., 2020). Consequently, we formulated a third hypothesis:
H3: The frequency of quinoa consumption is related to TFB factors and demographics.
Methodology
Data from interviews were collected between September 2020 and August 2021 (during the COVID-19 pandemic context) in the area known as Top Lima and Modern Metropolitan Lima, Peru. This area comprises 12.9% of the population of Lima. On average, this group has the highest levels of education and income in the city (Ipsos Apoyo, 2015). The share of the population with the socioeconomic level known as "A" (upper class) in 2019 corresponded to 1.8% of the total Peruvian population (the current population is approximately more than 33 million), which in 2021 decreased to 1%. The "B" population group (upper-middle class) in 2019 was approximately 10.5% of the Peruvian population, and in 2021 it decreased to 9% (Ipsos Apoyo, 2021). These population groups tend to consume higher levels of quinoa and also are willing to buy more expensive products to maintain a healthy lifestyle.
The survey was conducted online in non-probabilistic conditions. An online purposive sample was conducted (Barratt et al., 2014; Meltzer et al., 2016), considering only purchase decision makers and quinoa consumers aged 20 to 75. It was emphasized that participation in the study was anonymous, so no reimbursements or other incentives were offered. Given the absence of a stimulus, the motivation to respond to the survey deliberately more than once was reduced. Thus, the result was 170 completed questionnaires. A high proportion of women were interviewed, as in many households in Lima women are in charge of food purchasing. In addition, the substantial proportion of respondents with a technical or university degree was due to the higher level of education and income of citizens of Top Lima and Modern Metropolitan Lima. The overall descriptive statistics are shown in table 1.
Table 1 Overall demographic characteristics of quinoa consumers in Top Lima and Modern Metropolitan Lima.
Source: authors.
The questionnaire consisted of a set of questions (based on the TPB) about motivational factors for quinoa consumption, measured on 5-point Likert scales from 1 (Totally disagree) to 5 (Totally agree). Measures of attitude, subjective norms, perceived behavioral control and health were included in the questionnaire. Items on motivations that affect quinoa consumption were originally drawn from Verbeke and Vackier (2005), Mitterer-Daltoé et al. (2013), Carrillo et al. (2011), and Ragaert et al. (2004), and were used in a previous study conducted by Higuchi and Maehara in 2021. The scales were originally published in English and then translated into Spanish. In order to check the validity of the translations, the questionnaire was then translated back to English (Carrillo et al, 2011; Higuchi & Maehara, 2021). Table 2 shows the dimensions and measures used for the operationalization of the studied structural model. In addition, the survey included a set of demographic and quinoa shopping behavior questions (table 2).
Lockie et al. (2004) and Steptoe et al. (1995) note that while the scales have high internal reliability, there are also strong enough correlations between some scales to suggest that collapsing them into a smaller number of factors may be appropriate. Thus, we first used exploratory factor analysis (EFA) through the unweighted least squares (ULS) method with orthogonal rotation varimax to obtain the main factors that influence quinoa consumption. Secondly, the main model used for corroborating the principal hypothesis was the logistic binomial analysis specified below (Field, 2012):
Where Y in the model is specified with a dichotomous dependent variable that denotes (i) whether the consumer shifted his/her quinoa consumption during the COVID-19 outbreak (Yes = 1, No = 0), (ii) consumer's final choice in terms of consumption frequency, taking values of 1 for 'daily to weekly' consumption and 0 for 'fortnightly to monthly,' (iii) whether the consumer buys quinoa at a supermarket (1) or at other stores (0), and (iv) if the consumer consumed quinoa before the IYQ (2013) (0) or afterward (1), in order to determine if quinoa consumption was related to the recent quinoa boom (FAO, 2013; McDonell, 2020) or part of the Peruvian tradition. The linear combination of the regression parameters with the explanatory variables appears in parentheses. In addition, consumption frequency in all the models presented was explained by a set of demographic factors or socioeconomic factors (Al-Mazrooei et al., 2003). The independent socioeconomic variables used in the model are described in tables 3 and 4. The topics on the questionnaire were based on several surveys previously conducted to assess the socio-demographic characteristics of households in terms of age, income and size, among others. Finally, the relationships between the qualitative variables (table 4) were evaluated using cross tables with chi-square test statistics (Burns & Burns, 2009). The whole analysis was performed using R software.
Table 2 Scales used for analysis.
| Dimension | Item | Definition | Origin of the scales |
|---|---|---|---|
| Attitude (4 items) |
|
Refers to the degree to which a person has a favorable or unfavorable evaluation of the behavior. | Verbeke and Vackier (2005) |
| Subjective norms (3 items) |
|
Refers not only to social pressure but also personal feelings or moral obligation or responsibility to act certain ways. | Verbeke and Vackier (2005) |
| Perceived control behavior (4 items) |
|
Self-efficacy and beliefs about the controllability of facilitating and inhibitory factors. | Verbeke and Vackier (2005) |
| Health (3 items) |
|
Refers to the inherent role of diet in wellbeing. To understand consumers' behavior and ability to provide food that contributes to the well-being, studies about the role of diet in health are necessary. | Carrillo et al. (2011); Ragaert et al. (2004) |
Source: authors.
Table 3 Summary statistics of the quantitative socio-demographic factors of the sample.
| Variable | Description | Mean (n = 170) | SD* |
|---|---|---|---|
| Years of study | Years of formal schooling of the respondent | 6.91 | 6.24 |
| Age | Age (in years) of the respondent | 49.82 | 8.72 |
| Number of children | Number of children of the respondent | 2.02 | 1.10 |
| Monthly consumption of quinoa | Total monthly consumption of quinoa by the respondent | 956.48 | 909.34 |
* Standard deviation. Source: authors.
Table 4 Summary statistics of the qualitative socio-demographic factors of the sample.
| Variable | Description | Frequency (n = 170) | Share (%) |
|---|---|---|---|
| Consumption frequency |
|
78 | 46 |
| 92 | 54 | ||
| Pandemic quinoa consumption |
|
121 | 71 |
| 49 | 29 | ||
| Quinoa place of purchase |
|
42 | 25 |
| 128 | 75 | ||
| Influence IYQ on quinoa consumption |
|
103 | 61 |
| 67 | 39 | ||
| Reason for quinoa consumption |
|
35 | 21 |
| 135 | 79 | ||
| Family income (Peruvian soles* [PEN] per month) |
|
9 | 5 |
| 12 | 7 | ||
| 17 | 10 | ||
| 17 33 | 10 19 | ||
| 82 | 48 |
*Average exchange rate between September 2020 to August 2021 was 1 USD = 3.7 PEN.
Source: authors.
Results and discussion
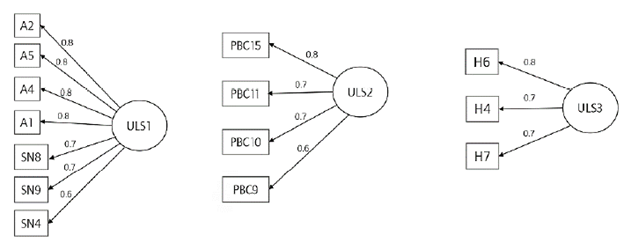
In the first phase, exploratory factor analysis (EFA) with varimax rotation was performed to detect the loading of each item and the relationship with the factor (see appendix). Latent variables were correctly displaced in their respective factors. Likert items were included in the EFA with the aim of exploring the structure of all belief variables in the data. When the 14 Likert variables were included in the EFA model (called SN&A-H-PBC model), one construct of the three contained the attitude and subjective norms items in the same latent variable. To determine the effect only of the attitude variable and the subjective norms variable in the logistic binomial regression models, two more EFA models were applied: one model had only attitude items (excluding subjective norms items, called the A-H-PBC model) and the other model only had subjective norms (excluding attitude items, called the SN-H-PBC model). Table 5 shows the constructs of the three models obtained from the varimax rotation method for ULS.
Table 5 Results of EFA models.
Source: authors.
The Kaiser-Meyer-Olkin (KMO) statistics in the three models were over 0.9 and the Bartlett's test statistics were significant (p-value < 0.01). Cronbach's alpha (a) test measures internal consistency, indicating how closely related a set of variables is as a group (Field, 2012). All the constructs presented an a value higher than 0.9, which is regarded as excellent.
Results of the binomial logistic models
Factors and demographic characteristics were incorporated in the four logistic regression models. Socio-demo-graphic characteristics were used to measure the Peruvian frequency of quinoa consumption by means of a logit model, where the dependent variable was quinoa consumption frequency (Al-Mazrooei et al., 2003).
Influence of IYQ on quinoa consumption
It is important to determine whether this consumption pattern occurred before the 2013 IYQ or afterward. Many initiatives aimed at increasing quinoa consumption were carried out, mainly by Peruvian government institutions. Indeed, during this period, there was extensive dissemination campaigns to promoting Peruvian quinoa consumption internationally (Higuchi & Maehara, 2021). Among other activities, there was further research on quinoa and the launch of new varieties, enactment of laws on food provenance and safety, and promotion of food fairs and partnerships with renowned chefs (Higuchi & Maehara, 2021). Following these policies, there was an apparent increase in the internal demand by Peruvian population for Andean grains such as quinoa, mainly because of its multiple nutritional factors. Table 4 shows that 61% of the sample consumed quinoa before the IYQ. This means that consumers were already familiar with and consumed quinoa because they had the perception that quinoa is a traditional functional food. For instance, in the Ecuadorian highlands, particularly in Latacunga, quinoa is consumed as a tradition in typical dishes, but it is not associated with healthy lifestyle elements (Hernández et al., 2020). The remaining 39% consumed quinoa only after the IYQ (table 4), which is associated with nutrition and health factors. It seems that nutrition and health have been the main reasons for consuming quinoa as a superfood (Encalada-Añazco et al., 2021), with influences on the probability of consuming quinoa after the IYQ (table 6).
Table 6 Influence of IYQ on quinoa consumption.
| Variables | SN&A-H-PBC model | A-H-PBC model | SN-H-PBC model | |||
|---|---|---|---|---|---|---|
| β | Exp(β) | b | Exp(β) | β | Exp(β) | |
| Constant | -2.2638[N.S] | 0.1040 | -2.1810[N.S] | 0.1129 | -2.4586[N.S] | 0.0856 |
| ReasonsForConsuming (1) | 0.9635* | 2.6208 | 0.9281• | 2.5297 | 1.0806* | 2.9464 |
| YearsOfStudy | -0.0565• | 0.9451 | -0.0555• | 0.9460 | -0.0546[N.S] | 0.9469 |
| Gender (1) | -0.3051[N.S] | 0.7370 | -0.3148[N.S] | 0.7299 | -0.2669[N.S] | 0.7657 |
| FamilyIncome (2) | 1.6567[N.S] | 5.2421 | 1.6849[N.S] | 5.3917 | 1.6329[N.S] | 5.1190 |
| FamilyIncome (3) | -0.3729[N.S] | 0.6887 | -0.3656[N.S] | 0.6938 | -0.3475[N.S] | 0.7065 |
| FamilyIncome (4) | 1.2767[N.S] | 3.5846 | 1.2544[N.S] | 3.5057 | 1.3554[N.S] | 3.8782 |
| FamilyIncome (5) | 1.5649[N.S] | 4.7823 | 1.5665[N.S] | 4.7899 | 1.5803[N.S] | 4.8565 |
| FamilyIncome (6) | 1.2110[N.S] | 3.3567 | 1.2179[N.S] | 3.3799 | 1.2240[N.S] | 3.4007 |
| Age | -0.0134[N.S] | 0.9867 | -0.0144[N.S] | 0.9857 | -0.0111[N.S] | 0.9890 |
| NumberOfChildren | 0.1555[N.S] | 1.1682 | 0.1561[N.S] | 1.1689 | 0.1339[N.S] | 1.1433 |
| Marital Status (1) | 1.3373* | 3.8086 | 1.3299* | 3.7807 | 1.2590* | 3.5220 |
| MonthlyQuinoaConsumption | -0.0002[N.S] | 0.9998 | -0.0002[N.S] | 0.9998 | -0.0002[N.S] | 0.9998 |
| Health | 0.1630[N.S] | 1.1771 | 0.1442[N.S] | 1.1551 | 0.1183[N.S] | 1.1256 |
| PBC | -0.4076* | 0.6653 | -0.4090* | 0.6643 | -0.4003* | 0.6701 |
| SN-Attitude | -0.4951* | 0.6095 | ||||
| Attitude | -0.4679* | 0.6263 | ||||
| SN | -0.4956* | 0.6092 | ||||
| AIC | 223.62 | 224.26 | 224.08 | |||
| Null deviance (d.f) | 227.99 (169) | 227.99 (169) | 227.99 (169) | |||
| Residual deviance (d.f) | 191.62 (154) | 192.26 (154) | 192.08 (154) | |||
| N | 170 | 170 | 170 | |||
Significance levels: *p-value < 0.05; »p-value < 0.10; [N.S] not significant; d.f: degrees of freedom.
Source: authors.
The perceived behavior control (PBC) factor was linked to quinoa consumption before the IYQ (table 6). The like li-hood of eating traditional meals made with typical ingredients relates to the attitudes of family members (Romo & Gil, 2012). Family members are the most influential in terms of encouraging adolescents to eat healthily (Chan et al., 2011; Grønhøj et al., 2013). Therefore, it is essential to make parents more aware of their role as socialization agents of quinoa food choices (Higuchi & Maehara, 2021). Moreover, outcomes show that consumers who have the attitude-subjective norms or the attitude or subjective norms independently as the main factors also had a higher probability of consuming quinoa before the quinoa boom (IYQ). In contrast, being married or cohabiting is coupled with the probability of consuming quinoa more after the IYQ. This finding coincides with that of Hernández et al. (2020), who mention that married people are more likely to consume quinoa, whereas the opposite was found for widowed or divorced people. For the SN&A-H-PBC and the A-H-PBC models, higher education corresponded to the probability of consuming quinoa before the IYQ, and in the SN-H-PBC model, the subjective norms factor had the strongest influence on the probability of consuming quinoa before the IYQ.
Increased quinoa consumption in Peru during the pandemic
Just 29% of Peruvian consumers mentioned that their quinoa consumption increased due to COVID-19 (table 4). Those consumers who previously had high monthly quinoa consumption (grams/month) showed a high probability of increasing quinoa consumption during the pandemic. Earning between 7,501 and 10,000 PEN/month, the second highest level of income in Peru, also impacted positively the probability of increasing quinoa consumption during the pandemic. Quinoa is a food that is in high demand in more affluent areas, as people with a higher income tend to stay well-informed of health trends and foods that make healthy living possible (Encalada-Añazco et al., 2021; Gonzalez, 2015). As a result, the quantity and frequency of consumption are related to people's level of income (Ayala-Garay et al., 2020; Encalada-Añazco et al., 2021), which is particularly the case of people in Top Lima and Modern Metropolitan Lima, who are aware of the nutritive qualities of trendy Andean crops.
The results are in line with the expectation that education or income level (proxied by a district dummy involving household income) would be reasonably homogeneous within small residential areas (Hanley & Morgan, 2008), and that these factors could have a positive effect on quinoa consumption, as is the case of healthy foods such as fish (Can et al., 2015). Additionally, while the health construct connects to the probability of increasing quinoa consumption during the pandemic in the SN&A-H-PBC and the A-H-PBC models, in the SN-H-PBC model, the main reason for consuming quinoa was also health and nutrition (table 7). It can be said that Peruvian people who are concerned about their health and nutrition needs consumed more quinoa during the COVID-19 outbreak. Hernández et al. (2020) explain that, in Ecuador, knowledge of quinoa's nutritional value and its use as a dietary ingredient increases the probability of consumption. The benefits of consuming more nutritious food emerged particularly during COVID-19 because many consumers became increasingly aware of maintaining good health (Hernández et al., 2020) and boosting the immune system (Borsellino et al, 2020).
Table 7 Increased quinoa consumption in Peru during the pandemic.
| Variables | SN&A-H-PBC model | A-H-PBC model | SN-H-PBC model | |||
|---|---|---|---|---|---|---|
| β | Exp(β) | β | Exp(β) | β | Exp(β) | |
| Constant | -3.8044* | 0.0223 | -3.8790* | 0.0207 | -3.9578** | 0.0191 |
| ReasonsForConsume (1) | 0.7212[N.S] | 2.0570 | 0.7176[N.S] | 2.0495 | 0.7573• | 2.1326 |
| YearsOfStudy | -0.0151[N.S] | 0.9850 | -0.0153[N.S] | 0.9848 | -0.0109[N.S] | 0.9892 |
| Gender (1) | 0.1008[N.S] | 1.1061 | 0.1085[N.S] | 1.1147 | 0.1302[N.S] | 1.1390 |
| FamilyIncome (2) | 1.0636[N.S] | 2.8968 | 1.1026[N.S] | 3.0119 | 1.2104[N.S] | 3.3548 |
| FamilyIncome (3) | 0.8847[N.S] | 2.4222 | 0.9122[N.S] | 2.4899 | 1.0254[N.S] | 2.7882 |
| FamilyIncome (4) | 1.6309[N.S] | 5.1085 | 1.6413[N.S] | 5.1621 | 1.7501[N.S] | 5.7552 |
| FamilyIncome (5) | 1.7668• | 5.8522 | 1.8041• | 6.0744 | 1.8581 • | 6.4117 |
| FamilyIncome (6) | 0.9769[N.S] | 2.6563 | 1.0140[N.S] | 2.7567 | 1.0983[N.S] | 2.9990 |
| Age | 0.0286[N.S] | 1.0290 | 0.0299[N.S] | 1.0303 | 0.0296[N.S] | 1.0300 |
| NumberOfChildren | -0.1241[N.S] | 0.8833 | -0.1275[N.S] | 0.8803 | -0.1542[N.S] | 0.8571 |
| Marital Status (1) | 0.7036[N.S] | 2.0210 | 0.6814[N.S] | 1.9767 | 0.5886[N.S] | 1.8015 |
| MonthlyQuinoaConsumption | 0.0007* | 1.0007 | 0.0007* | 1.0007 | 0.0007** | 1.0007 |
| Health | 0.3582• | 1.4308 | 0.3824• | 1.4658 | 0.3210[N.S] | 1.3785 |
| PBC | 0.2392[N.S] | 1.2702 | 0.2134[N.S] | 1.2379 | 0.1667[N.S] | 1.1814 |
| SN-Attitude | -0.2310[N.S] | 0.7938 | ||||
| Attitude | -0.2204[N.S] | 0.8022 | ||||
| SN | -0.1362[N.S] | 0.8726 | ||||
| AIC | 233.43 | 233.37 | 235.4 | |||
| Null deviance (d.f) | 234.52 (169) | 234.52 (169) | 234.52 (169) | |||
| Residual deviance (d.f) | 201.43 (154) | 201.37 (154) | 203.40 (154) | |||
| N | 170 | 170 | 170 | |||
Significance levels: **p-value < 0.01; *p-value < 0.05; »p-value < 0.10; [N.S] not significant; d.f: degrees of freedom.
Source: authors.
Consumption frequency and purchasing at supermarkets
The results of the consumption frequency model are presented in table 8. As the family's primary dietary decision maker, women's purchasing attitudes are important (Duncan et al, 2015). Consequently, in the three proposed models, women were primarily the ones who connected with the probability of quinoa consumption on a daily to weekly basis. It can be said that the frequency of consuming quinoa is related to the TPB factors and demographics. In the SN-H-PBC model, the constructs subjective norms, years of study and monthly quinoa consumption increased the probability of daily to weekly frequency of consumption.
The frequency of quinoa consumption was then cross-referenced with the variable "quinoa consumption during COVID-19" (table 9). It is said that quinoa is eaten in the homes of all socioeconomic strata once a day on average (Ayala-Macedo, 2003). Nonetheless, approximately 46% of the sample stated they eat quinoa only once every fortnight or month (table 4). Moreover, Peruvians in the sample did not increase their quinoa consumption level during the COVID-19 pandemic in Peru. This is because quinoa is perceived as a traditional product, even though it has been shown that many traditional foods have characteristics of functional foods that help to improve health or prevent illness (Rojas-Rivas et al., 2020). Additionally, prior to the pandemic, quinoa consumption had already been promoted by the United Nations Food and Agriculture Organization (FAO) (MIDAGRI, 2020).
Table 8 Consumption frequency model.
| Variables | SN&A-H-PBC model | A-H-PBC model | SN-H-PBC model | |||
|---|---|---|---|---|---|---|
| β | Exp(β) | β | Exp(β) | b | Exp(β) | |
| Constant | -3.8138* | 0.0221 | -3.8676* | 0.0209 | -3.7406* | 0.0237 |
| ReasonsForConsume (1) | 0.6829[N.S] | 1.9797 | 0.6946[N.S] | 2.0030 | 0.5858[N.S] | 1.7964 |
| YearsOfStudy | 0.0378[N.S] | 1.0385 | 0.0375[N.S] | 1.0382 | 0.0379[N.S] | 1.0386 |
| Gender (1) | 1.0196* | 2.7719 | 1.0344* | 2.8134 | 0.9657* | 2.6265 |
| FamilyIncome (2) | 1.6677[N.S] | 5.3001 | 1.6550[N.S] | 5.2331 | 1.8780• | 6.5407 |
| FamilyIncome (3) | -0.6563[N.S] | 0.5188 | -0.6566[N.S] | 0.5186 | -0.4613[N.S] | 0.6304 |
| FamilyIncome (4) | 0.1140[N.S] | 1.1207 | 0.1310[N.S] | 1.1400 | 0.1269[N.S] | 1.1353 |
| FamilyIncome (5) | -0.9415[N.S] | 0.3901 | -0.9355[N.S] | 0.3924 | -0.8202[N.S] | 0.4403 |
| FamilyIncome (6) | 0.2100[N.S] | 1.2337 | 0.2134[N.S] | 1.2378 | 0.3401[N.S] | 1.4051 |
| Age | 0.0173[N.S] | 1.0175 | 0.0181[N.S] | 1.0183 | 0.0154[N.S] | 1.0156 |
| NumberOfChildren | -0.3303[N.S] | 0.7187 | -0.3312[N.S] | 0.7180 | -0.3265[N.S] | 0.7214 |
| Marital Status (1) | 0.9237[N.S] | 2.5187 | 0.9262[N.S] | 2.5248 | 0.8939[N.S] | 2.4445 |
| MonthlyQuinoaConsumption | 0.0003[N.S] | 1.0003 | 0.0003[N.S] | 1.0003 | 0.0004- | 1.0004 |
| Health | 0.1762[N.S] | 1.1927 | 0.2092[N.S] | 1.2328 | 0.1869[N.S] | 1.2056 |
| PBC | 0.0661[N.S] | 1.0683 | 0.0533[N.S] | 1.0547 | -0.0080[N.S] | 0.9920 |
| SN-Attitude | 0.2819[N.S] | 1.3257 | ||||
| Attitude | 0.2490[N.S] | 1.2828 | ||||
| SN | 0.4152• | 1.5147 | ||||
| AIC | 208.6 | 208.72 | 206.85 | |||
| Null deviance (d.f) | 204.19 (169) | 204.19 (169) | 204.19 (169) | |||
| Residual deviance (d.f) | 176.60 (154) | 176.72 (154) | 174.85 (154) | |||
| N | 170 | 170 | 170 | |||
Significance levels: *p-value < 0.05; -p-value < 0.10; [N.S] not significant; d.f: degrees of freedom.
Source: authors.
Finally, to know where consumers purchase quinoa, table 10 shows the outcomes of purchasing at supermarkets or other shops. It has been found that the general preference for shopping in the central regions of Latin American cities has shifted away from more traditional outlets to more "modern" channels, such as super/hypermarkets and drugstores, due to a perception of cleanliness and safety (Borsellino et al, 2020). This is the main reason consumers prefer to purchase quinoa at supermarkets. Factors such as earning between 7,501 and 10,000 PEN/month and more than 10,000 PEN/month impact on the probability of purchasing at supermarkets during the COVID-19 pandemic. This means that people with the highest income have more probability of purchasing at supermarkets (p-value < 0.001) than other people who earn less income.
Table 9 Relationship between the frequency of quinoa consumption before and during the COVID-19 pandemic in Peru.
| Frequency of quinoa consumption (n = 170) | ||||
|---|---|---|---|---|
| Frequent consumption (n = 92) | Infrequent consumption (n = 78) | |||
| Quinoa consumption during coviD-19 pandemic | Frequency (n) | Percent (%) | Frequency (n) | Percent (%) |
| Consumption increased due to coviD-19 | 33 | 36 | 16 | 21 |
| Consumption did not increase due to coviD-19 | 59 | 66 | 62 | 79 |
|
|
|
|||
Significance level: *p-value < 0.05; d.f: degrees of freedom.
Source: authors.
Table 10 Purchasing at supermarkets or other shops.
| Variables | SN&A-H-PBC model | A-H-PBC model | SN-H-PBC model | |||
|---|---|---|---|---|---|---|
| β | Exp(β) | β | Exp(β) | β | Exp(β) | |
| Constant | -3.7479* | 0.0236 | -3.7657* | 0.0232 | -3.7060* | 0.0246 |
| ReasonsForConsume (1) | 0.6489[N.S] | 1.9135 | 0.6410[N.S] | 1.8984 | 0.6024[N.S] | 1.8265 |
| YearsOfStudy | 0.0023[N.S] | 1.0023 | 0.0019[N.S] | 1.002 | 0.0001[N.S] | 1.0001 |
| Gender (1) | -0.0848[N.S] | 0.9187 | -0.0800[N.S] | 0.9232 | -0.1125[N.S] | 0.8936 |
| FamilyIncome (2) | 2.0605[N.S] | 7.8496 | 2.0549[N.S] | 7.8057 | 2.1150[N.S] | 8.2918 |
| FamilyIncome (3) | 0.9542[N.S] | 2.5966 | 0.9637[N.S] | 2.6214 | 0.9615[N.S] | 2.6156 |
| FamilyIncome (4) | 0.2826[N.S] | 1.3266 | 0.2874[N.S] | 1.3329 | 0.2236[N.S] | 1.2506 |
| FamilyIncome (5) | 2.5765* | 13.1510 | 2.5785* | 13.1770 | 2.5610* | 12.9470 |
| FamilyIncome (6) | 4.1641*** | 64.3360 | 4.1686*** | 64.6240 | 4.1900*** | 66.0240 |
| Age | 0.0516• | 1.0529 | 0.0519• | 1.0532 | 0.0514• | 1.0527 |
| NumberOfChildren | -0.1124[N.S] | 0.8937 | -0.1127[N.S] | 0.8934 | -0.1124[N.S] | 0.8937 |
| Marital Status (1) | 0.1673[N.S] | 1.1821 | 0.1723[N.S] | 1.1881 | 0.2452[N.S] | 1.2779 |
| MonthlyQuinoaConsumption | -0.0003[N.S] | 0.9998 | -0.0003[N.S] | 0.9998 | -0.0003[N.S] | 0.9997 |
| Health | -0.1528[N.S] | 0.8583 | -0.1226[N.S] | 0.8846 | -0.1008[N.S] | 0.9041 |
| PBC | -0.4710[N.S] | 0.6244 | -0.4804• | 0.6186 | -0.4555[N.S] | 0.6341 |
| SN-Attitude | 0.2499[N.S] | 1.2839 | ||||
| Attitude | 0.2465[N.S] | 1.2796 | ||||
| SN | 0.2185[N.S] | 1.2442 | ||||
| AIC | 153.69 | 153.67 | 154.01 | |||
| Null deviance (d.f) | 190.09 (169) | 190.09 (169) | 190.09 (169) | |||
| Residual deviance (d.f) | 121.69 (154) | 121.67 (154) | 122.01 (154) | |||
| N | 170 | 170 | 170 | |||
Significance levels: ***p-value < 0.001; **p-value < 0.01; *p-value < 0.05; -p-value < 0.10; [N.S] not significant; d.f: degrees of freedom.
Source: authors.
The reasons for this trend could be the convenience of shopping at supermarkets compared to other options such as small markets, street fairs or biofairs. Also, since packaged foods are easier to store and prepare, they can be more attractive to consumers (Graziano da Silva, 2020). Due to the lockdown and the increasing need for people to cook at home, some preferences for less healthy foods may have declined (Borsellino et al, 2020; Eftimov et al, 2020). In addition, being older (up to 65 years) was related to the probability of purchasing at supermarkets during the pandemic. This behavior is likely due to higher consumption rates of superfoods among people with an average age over 56 years, because of the nutritional quality of these foods (Delicato et al, 2019; Encalada-Añazco et al, 2021) and the wide range of them being sold at supermarkets. Moreover, middle-aged individuals with a higher income level are more likely to purchase craft food (Rivaroli et al., 2020). Corroborating this, Hernández et al. (2020) found that households headed by younger people tend to consume more of these foods.
Conclusions
This study explored consumers' behavior during the COVID-19 pandemic in Peru regarding their underlying perceptions and the demographic aspects that influence quinoa consumption. This empirical approach contributes to a better understanding of consumers' demographics and perceptions of their behaviors regarding quinoa consumption during COVID-19. The main results of this study showed that (i) quinoa consumers in Peru ate this food even before the IYQ, with the PBC factor being the main influence (being married or cohabiting is associated with the probability of consuming more quinoa after the IYQ); (ii) consumers who are concerned about their health and nutrition needs increased quinoa consumption during the pandemic; (iii) women are the main individuals with a higher probability of a daily to weekly quinoa consumption trend; and (iv) people with the highest income have more probability of purchasing their food at supermarkets rather than those with less income.
Two recommendations can be made from the findings of this study. First, that quinoa marketing campaigns such as "eat local, eat Peruvian quinoa," promoted by the government, should be reinforced to improve clinical outcomes caused by diseases like COVID-19 or to enhance the nutrition and health of the population and support Peruvian farmers. Second, because of the origin and the high nutrition of quinoa, it is recommended to target young children in public campaigns, such as introducing quinoa in schools and universities.
The methodology adopted in this study can be potentially applied to any kind of population. This work established relationships between Peruvian quinoa consumers' perceptions and demographics and their quinoa consumption behavior during the COVID-19 pandemic. However, researchers are encouraged to use the results of this study as a basis for similar research on different products.
The main limitation of this study is that results are valid only for customers interviewed in Top Lima and Modern Metropolitan Lima. These findings cannot be inferred or generalized for all Peruvian consumers. Similar studies in different geographical zones should be undertaken to broaden the scope of this research and, therefore, increase the knowledge focused on consumer behavior.