


 Inglés (pdf)
 Articulo en XML
 Referencias del artículo
 Enviar articulo por email
 Citado por SciELO
  Citado por Google
  Similares en
SciELO
Similares en
SciELO  Similares en Google
 Permalink
Introduction
SEVERAL STUDIES have identified road accidents as a global problem due to the number of deaths and injured individuals resulting from this phenomenon. In addition, it is also worrisome that for many years increased road congestion has been detected in many cities of the world (Kurzhanskiy & Varaiya, 2015), via the expansion in the vehicle fleet and an increase in driving times, with consequent health risks (Tse, Flin, & Mearns, 2006; Taylor & Dorn, 2006; Liu, Ettema, & Helbich, 2022).
In front of these situations, many public and academic efforts have been directed towards the development of traffic status estimating systems, necessary for the institutions responsible for managing traffic (Leduc, 2008; Kurzhanskiy & Varaiya, 2015) as well as for road users (Gokasar & Bakioglu, 2018) when it comes to making decisions about when to start a journey, which route to follow from the available options, foresee the arrival time, duration of the journey, among other uses (Astarita, Festa, & Giofré, 2018). So, driving efficacy is not simply a self-perception matter (Bannach & Bianchi, 2021); mobile technologies also have something to say.
Seo, Bayen, Kusakabe, & Asakura (2017) report that more than one hundred models have been developed to estimate the traffic status. The models differ in two aspects: on the one hand, the greater or lesser number of principles or theoretical assumptions they incorporate, and on the other hand, the nature of the data sent to the servers that analyze the information (Barata, Ferro, & Ferreira, 2014). Theoretical principles are taken from physics and/or human behavior, thus finding certain models that admit the uncertainty or irrationality of human behavior in decision-making (Seo et al., 2017). As for the data, it can be historical or direct. The latter may come from stationary sources (fixed devices, such as sensors or radars on the roads) or from different types of mobile sources, such as devices installed in vehicles (Factor, 2018), mobile telephone networks antennas (Demissie, de Almeida Correia, & Bento, 2013), Geographic Positioning Systems (GPS) (Shi, Zhang, Feng, & Svirchev, 2018) or smartphones (Leduc, 2008; Jannusch, Shannon, Völler, Murphy, & Mullins, 2021).
GPS is one of the technologies most often mentioned in literature as a source for obtaining real time data to feed the traffic status estimating methods (Kurzhanskiy & Varaiya, 2015), as well as specific devices, such as the ones incorporated in mobile phones (Astarita et al., 2018; Wickens, Toplak, & Wiesenthal 2008). As for smartphones, there are many applications in different operating systems that offer diverse driver assistance services; these applications usually use the GPS incorporated in most of these phones. Thus, there are applications such as Waze* or Google Maps*, both characterized by being free, having a simple installation, and not requiring another device or own maps. Waze*, for instance, includes visualization and audio guidance of the route. It is based on the users' collaboration by direct participation or by indirect or passive drivers' participation, and it provides information on the vehicle's position only by activating the application (Barata et al., 2014). As for Google Maps®, it is a pre-installed application on most android system phones, which perhaps explains why this is one of the most used applications in some countries (Gokasar & Bakioglu, 2018) and interacts with other applications (Barata et al., 2014; Shi et al., 2018). In addition, it does not require direct registration and provides visualization and audio guidance of the route. Furthermore, it allows users to interact by mentioning places such as restaurants, generating a whole network of useful information for mobility.
Both GPS systems and mobile phone applications have several advantages as data collection systems for estimating traffic status: its relative low cost regarding other stationary data collection systems and its wide coverage precisely due to the popularization of such devices. In this sense, it is enough that a 3-5% of road users utilize a mobile phone application to obtain a highly reliable estimate of the traffic status (Astarita et al., 2018), which is one of the most frequent uses of the models and traffic data.
Now, in relation to human behavior, there have been developments of applications and devices to study the drivers themselves. Along the same line, through the data provided by the GPS or mobile applications, the study of decision-making while driving has approached, to change lanes, to accelerate or to follow or not the route indicated by the mobile application (Gokasar & Bakioglu, 2018) driving styles (Stoichkov, 2013; Astarita et al., 2018), distractions (Astrain, Bernaus, Claverol, Escobar, & Godoy, 2003), or the level of aggressiveness when driving (Valana, Luele, Astartita, & Caruso, 2014).
Thus, in terms of driving styles, Stoichkov (2013) proposes an application for android system smartphones, in which three styles are clearly differentiated: (1) the calm-economic style of drivers that anticipate other road users, adjust to the lights and speed limits, and avoid sudden acceleration, (2) the normal style of drivers that accelerate moderately and brake to the same extent and, (3) the sporting style represented by drivers with sudden accelerations and sudden braking. Regarding aggressiveness, it can be evaluated by measuring forward and lateral accelerations (Valana et al., 2014), which are related to the risk of road accidents (Hennesy & Wiesenthal, 2004; Ilie et al., 2015).
Furthermore, it is worth wondering about the relationship between the use of this type of models, devices, and data by direct users (drivers), the probabilities of accidents and the users' mental health. In this framework, it must be recognized that the use of mobile phones should not be studied only from the perspective of its relative contribution as a risk factor to road accidents (Bendak, Alali, Alali, & Alshehhi 2017) but also as an assistance tool for road mobility. A greater use of such applications could shorten the duration of journeys or trips and this, in turn, can reduce the risk of physiological stress. For example, research has found a direct relationship between trip length and more negative mood in drivers (Morris & Guerra, 2015) and in female drivers (Feng & Boyle, 2014). However, the use of such devices to find the fastest route can add cognitive load to the driver due to active use -having to be aware of the manipulation of the device, entering the address of destination, for example- or due to its passive use -for example, being aware of visual or auditory directions on the road-, which could increase driving stress, in addition to being associated with distractions while driving (McCartt, Hellinga, & Bratiman, 2006; World Health Organization, 2011; Bradley & Nesy, 2020).
Consequently, as from the above considerations and due to the absence of international or local Colombian studies on this issue, the first objective of this investigation is to determine the frequency of use of driving assistant technologies -GPS, mobile, and radar applications- by Colombian public transportation and private drivers. The second objective is to explore the relationship between the use of driving technologies and the level of anger when driving. Driving rage has been linked to a higher frequency of driving rule violations (Precht, Keinath, & Krems, 2017), and the use of mobile phones and other devices can constitute driving violations if they are activated and used while driving, therefore constituting distracting agents while driving, from the perspective of cognitive load due to multitasking. Texting or calling while driving are actions associated to major risk of driving violations and errors (Shaaban, Gaweesh, & Ahmed, 2020; Jomnonkwao, Uttra, & Ratanavaraha, 2021), however, the relationship between anger and the use of technologies that guide the route to reach the destination has not been studied. The third objective is to recognize the relationship between the use of technologies and the level of subjective well-being as mental health indicators, as these technologies promise shorter driving and journey times that have been associated with fewer negative emotions (Feng & Boyle, 2014; Morris & Guerra, 2015). Finally, our fourth objective is to understand the relationship between the use of these technologies and the risk of road accidents and fines.
Research on these subjects has found that certain attributes of navigation devices, such as a small screen size, are associated with a higher cognitive load (Yared & Patterson, 2020) and cognitive overload is a risk agent for accidents (Wong & Huang, 2010). However, this study is only exploratory, so the frequency of use of various mobile navigation technologies and road accidents is studied without evaluating cognitive overload in driving.
Methodology
Design and participants
Design is cross sectional, comparative, and correlational. TA non-randomized convenience sample was obtained, and participants were public transportation and private drivers ( n = 1149). Participants were located in public transportation buses and taxi companies, in driver recognition centers (DRC), and in training centers for drivers sanctioned with traffic tickets. All participants were voluntaries and answered individually battery. No rewards were given for answering the survey as it was showed as an independent process to those from DRC. The participants were 93.2% men, the mean age for the whole sample was 36.69 ±10.20 years old, ranging between 17 and 77 years old, although with 70% of the people between 17 and 24 years old. In correspondence to age tendencies, the majority (41.2%) declared being married or in civil union (34.2%), followed by single individuals (19.2%), divorced (4.4 %), and widowed (.9%). As for social class, 50.9% of the participants are classified as low class, 44.3% in middle social class, 3.8% in upper-middle class and 1.0% in upper class. Regarding educational level, 3% declared that they had not studied formally, 5.6% finalized primary school, 39.1% high school, 43.7% technical or technological studies, 6.9% have a university degree, and 1.6% completed postgraduate studies.
Materials and instruments
We developed, printed and applied individually a battery of instruments that include the following scales and questions:
Use of Mobile Driving Applications and Devices (MDAD). Nominal type, ad hoc scale, in which the respondent should indicate the use (yes or no) of each of the following applications and devices: Google Maps ®, Waze®, georeferencing device (gps), vehicle radar, other devices. Although there are other mobile applications as driving assistants, not all of them transmit information in real time. However two of the chosen applications transmit vehicle positioning, traffic conditions, and suggested route in real time.
Driving Anger Scale (DAS) by Deffenbacher, Stephens, & Sullman (2016). This fourteen-item Spanish version (Herrero-Fernández, 2011; in Useche, Cendales, Alonso, Montoro, & Pastor, 2019) of the scale has yielded an internal reliability of 0.80 for the total of the instrument. Three partial scores can be extracted, related to "Anger at not being able to advance", "Reckless driving", and "Hostility towards other drivers". Cronbach's α = 0.93 is obtained for the whole instrument in the current study.
Aggression Questionnaire (AQ) by Buss & Perry (Serge-Rodríguez, Ruíz-Pérez, & Gómez-Díaz, 2018). The version used consists of 29 items structured in four dimensions: verbal aggression, physical aggression, anger, and hostility. It can also generate a total score. The internal reliability of the scale has been satisfactory in driver samples (Serge-Rodríguez et al., 2018). The Cronbach's alpha coefficient of α = 0.914 in the current study is highly reliable.
Subjective Well-Being, measured with the Scale of Personal Well-Being (SPWB) by Ryff (Cobo-Rendón, Pérez-Villalobos, Páez-Rovira, & Gracia-Leiva, 2020). This test consists of 39 items that evaluate six constructs: (1) self-acceptance as the ability to feel good and have positive attitudes towards oneself, (2) autonomy or the mechanisms that people have to be independent and resist group pressure, (3) positive relationships, referring to necessary stable social relationships based on love, (4) sense of dominance, which as a skill, allows the person to develop in favorable environments to progress, (5) vital purpose, central element for an individual to feel that his/her existence has a meaning in the world, and that it is achieved through the formulation of personal goals, and (6) personal growth, marked by the desire to exploit the maximum personal potential. The reported internal reliability of the spwb for Colombian population is .87 (Serge-Rodríguez et al., 2018) and, for confirmation in this study, an α = 0.89 was obtained.
Scale of Perceived Difficulties in Driving (EDC) in Ruiz & López (2010) and Serge et al. (2018). It consists of 35 items that evaluate the perceived difficulty degree when performing driving maneuvers -for example, entering and leaving a roundabout or joining a main road from a parking lot- and tolerating other road users' maneuvers -Bus drivers, taxi drivers, motorcyclists, other drivers, etc. Higher scores indicate greater perceived ease to drive. The internal reliability of the scale has ranged from .95 and .96 (Serge et al., 2018). For this study, the reliability analysis shows α = 0.956, which indicates that the instrument is highly reliable. The factorial structure of this scale is associated to five dimensions: (1) the degree of difficulty in driving without consuming hallucinogens, respecting traffic signals, and performing maneuvers, (2) to park in shopping centers and maneuver to make way for ambulances or to join the road from parking lots, (3) to join the road from home and change lanes, (4) to show tolerance to public service drivers, as well as the conditions of the roads, and (5) to tolerate other road drivers and Peak and Plate restrictions during the day (Ruiz-Pérez, Gómez, Lamus, Beltrán, & Leal, 2014).
Variables related to driving. These variables include: the number of years driving, the number of days and hours per week and weekdays in this activity, and the type of driver: full-time or as a profession (prod), occasional driver (od), and private driver (prid) were recorded. prod drivers are those whose job is to drive, carrying passengers or goods. od drivers are the ones that drive to fulfill tasks related to their job but whose earned income does not depend on driving, such as a furniture salesman that may have to carry the furniture to the address of a buyer. prid drivers use their cars for private purposes (for example, home and workplace trips, leisure activities, etc.). Additionally, test subjects were asked about the number of accidents and the number of fines they received in the last two years.
Health variables. These questions have dichotomous response (yes or no) and are related to suffering diabetes, hypertension, dyslipidemia, overweight, and cancer. Likewise, subjects were asked about the consumption of alcohol, cocaine, methamphetamines, barbiturates, or other substances.
Ethical considerations
The battery of instruments was applied in accordance with the Colombian College of Psychology's ethical regulations. Participants were asked to answer the survey anonymously in the places where they were contacted and had to fill-out an informed consent form. Anonymity of the respondents was respected, and it was made clear to them that answering the survey did not imply any positive or negative consequences on their official driving records. The authors affirm that there are no conflicts of interest.
Procedure
This study carried out a descriptive analysis of the sample regarding sociodemographic background, driving experience, and the use of technologies as driving assistants. The sample was divided into four groups, crossing the type of vehicle -private transportation vs. public transportation- and gender. It also calculated the internal reliability of the scales used, compared groups among the variables studied, and performed a logistic regression analysis on the use of each technology (Waze®, GPS, and Google Maps®), in order to know what variables may influence its use.
Results
When analyzing the variables related to driving experience (see Table 1), we found that most of the participants are professional drivers, although this is mainly due to the subsample of men, since in women the most prevalent category is private drivers. Additionally, the analysis revealed that women drive especially cars and motorcycles, while most men drive especially buses and trucks. Likewise, women have, on average, few years driving, drive fewer days, both on weekdays and on weekends, and report fewer road accidents and traffic fines in the last two years.
Table 1 Differences Between Genders in Variables of Driving Experience
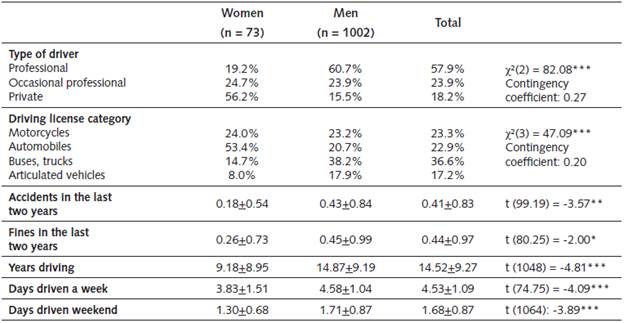
* p < .05; ** p < .01; *** p < .001.
Regarding health, there were no significant differences between gender or type ofdriver. For its part, in relation to drug use, 33.1% of the sample indicates having consumed alcohol sometimes, with 34.1% of men compared to 19.7% of women [X2(1) = 6.18 p < .05; contingency coefficient = 0.08]; .2% indicated having used marijuana, and .1%, barbiturates.
In respect to MDAD, GPS devices are the most used (25.9%), followed by Google Maps® (16.5%) and Waze® (14.1%); radars are only used by 6% of the respondents, and other devices by 3.5% of the participants, without significant differences between men and women. However, differences were found in the use of these technologies according to the type of driver. On the one hand, PRODS make greater use of GPS, radars, and other devices than the other groups, while PRIDS tend to use more Waze®, and ODS, Google Maps®, although the differences between groups are not significant or only trends (Table 2).
Table 2 MDAD Usage, Driving License Type, Comparing Types of Drivers
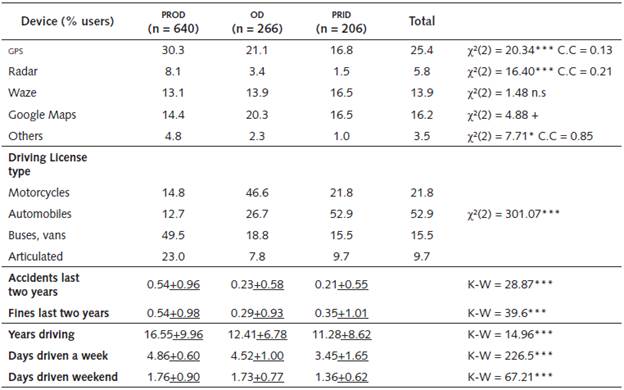
+ p < .10; * p < .05; ** p < .01; *** p < .001.
Note: PROD: Professional Drivers, OD: Occasional Drivers, PRID: Private drivers.
On the other hand, correlations between sociodemographic variables, driving experience, accident rate, personality, and health, with the use of MDAD, for each group of drivers -full-time professionals, occasional and private- and each type of device or application used (Table 3), show a significance level of at least p < .01. Due to the fact that the Kolmorov-Smirnov normality test was significant for all variables (z values among 2.81 and 15.61, p < .001), Spearman correlations were computed, as seen in Table 3.
Table 3 Spearman Correlations Between Sociodemographic Variables, Driving Experience, Personality, and Health With the Use of Technological Devices for Driving Assistance
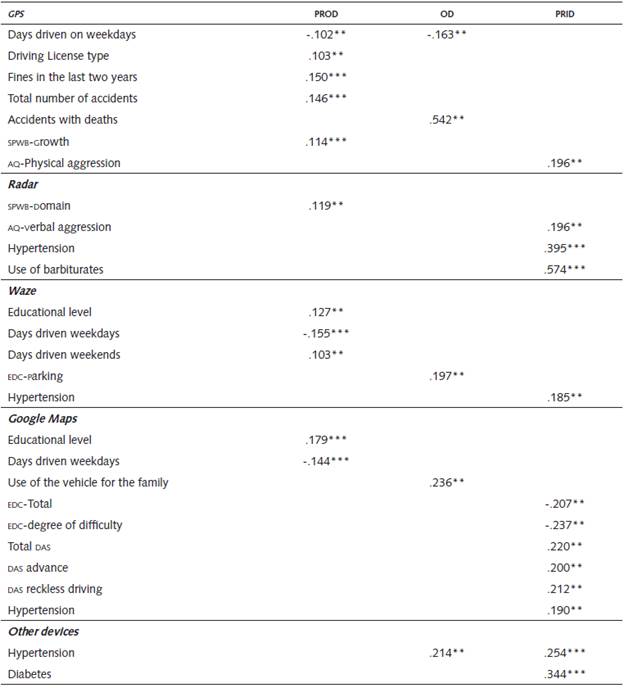
** p < .01; *** p < .001.
Note: The use of Google Maps®, Waze®, and Radar was computed as dummy variables (0: Not use; 1: Use).
On the other hand, correlations between sociodemographic variables, driving experience, accident rate, personality, and health, with the use of MDAD, for each group of drivers -full-time professionals, occasional and private- and each type of device or application used (Table 3), show a significance level of at least p < .01. Due to the fact that the Kolmorov-Smirnov normality test was significant for all variables (z values among 2.81 and 15.61, p < .001), Spearman correlations were computed, as seen in Table 3.
Regarding GPS, this is less used by PROD and OD, as they spend more days driving during weekdays. Among PROD, use is more frequent between those who drive larger vehicles, have more fines in the last two years, a greater total number of road accidents, and show higher scores in the "Growth" dimension of the Subjective Well-being Scale. Among ODS, GPS use is higher in those who have had fatal accidents, and among PDS, a higher level of general physical aggression (AQ) is associated with higher GPS use.
In relation to radars, among PRODS, its use is greater between those who have higher scores in domain well-being, and in PRIDS, in those who express more verbal aggression, in those who indicate they have hypertension, and in those who consume barbiturates. For its part, the use of Waze® is lower in PRODS that drive more days during weekdays and fewer days on weekends, and in those with a higher educational level. ODS that use this application more frequently indicate greater ease of parking, while in PDS its use is more frequent among those with hypertension.
With respect to Google Maps®, its use is greater in PRODS with a higher academic level and that drive fewer days during weekdays; in ODS that use their vehicle for their own and their family's transportation; and in PRODS who perceive less ease of driving, who show more anger when driving -especially anger for not being able to move forward and for the reckless driving of other drivers-, and in those who suffer from hypertension. Lastly, the use of other devices is related to a higher probability of suffering from hypertension in ODS and PDS, and diabetes in PDS.
As a complement and due to its possible clinical interest, it is worth noting some significant correla tions at the p < .05 level related to the use of these technologies. For example, in prods, anger at the reckless driving of others is directly related to the use of radars (r = .082, p < .05) and to the use of other devices in ods (r = 0.146, p < .05); and anger due todifficulties when driving is directly associated with the use of Waze® in prods (r = 0.080, p < .05), while verbal aggression (aq) is associated with increased use of gps in ods (r = .25, p < .05) and anger (aq) is related to the use of Google Maps® in prid (r = .148, p < .05). On the other hand, in relation to health variables, suffering from cancer is associated with the use of Waze® (r = .162, p < .05), GPS (r = .159, p < .05), and Google Maps (r = .162, at p < .05) in PRIDS. These drivers also show a higher probability of marijuana consumption associated to the use of Waze® (r = .157, p < .05), together with the use of barbiturates (r = .157, p < .05) and GPS (r = .163, p < .05), while in ODS, there is a greater probability of overweight (r = .146, p < .05) and dyslipidemia (r = .096, p < .05), associated to the use of other devices, and more risk of hypertension in GPS users (r = .132, p < .05). For PRODS, direct relationships were found between taking medications and using Waze® (r = .079, p < .05), and having cancer with the use of radars (r = .086, p < .05).
Moreover, a series of logistic regression analyzes were conducted, taking as criterion variables each of the devices included in this study, and as predictor variables, those shown in Table 3 for each type of driver. Tables 4, 5 and 6 show the resulting models with significant beta values. PRODS reveal that the greater the number of days driven during the week, the fewer applications such as GPS and Google Maps® are used; that to a higher educational level corresponds the use of applications such as Waze® and Google Maps®; and that a greater subjective well-being (although in different dimensions) is related to using devices as GPS or radars (Table 4). For ODS, the use of GPS is related to a greater perceived ease of parking, the use of Google Maps® when using the vehicle with the family, with a higher educational level, and hypertension as a variable is associated with the use of other devices (Table 5).
Table 4 Logistic Regression Analysis on the Use (or Non-use) of Assistive Technologies for Driving-Professional Drivers
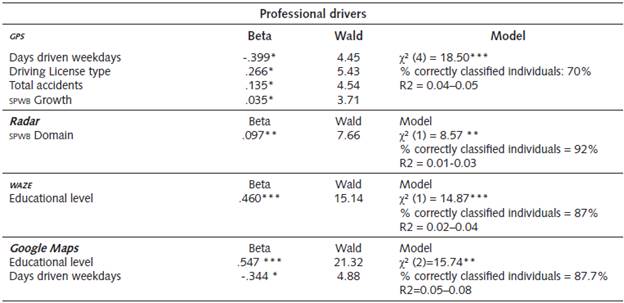
* p < .05; ** p < .01
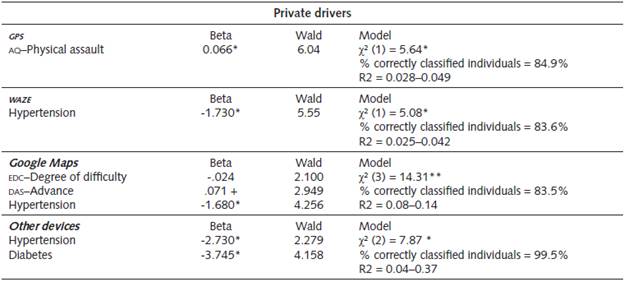
Finally, among PRIDS, the findings show that general or specific anger at not being able to move forward is related to a greater use of applications such as GPS or Google Maps®, and hypertension problems appear related to the use of the three devices included in this study. For the set of analyses presented in Tables 4 to 5, the variance of the models reflected in the R2 of Cox and Snell and of Nagelkerke is low, oscillating between 2% and 5%, reaching higher predictive values than those models that include health variables.
Table 5 Logistic Regression Analysis on the Use (or Non-use) of Assistive Technologies for Driving-Occasional Drivers
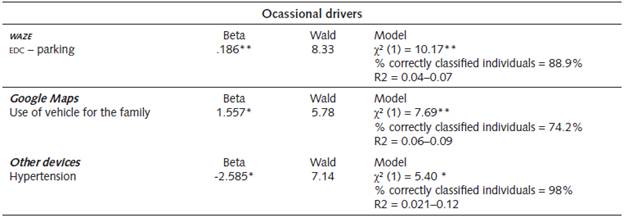
* p < .05; ** p < .01
Discussion and conclusions
Mobile technologies applied to traffic status estimation can provide useful information to both public administrators and road users (Kurzhanskiy & Varaiya, 2015). On the one hand, these technologies may help drivers to find faster routes to reach their destinations (Astarita et al., 2018). However, as certain traffic estimation models assume, decision-making in traffic can be affected by non-rational and uncertainty factors (Kurzhanskiy & Varaiya, 2015). These factors can be emotional such as anger, or cognitive, such as beliefs that justify irresponsible behavior and lack of empathy towards other road users (Ruiz-Pérez et al., 2014; Pérez, Navas-Sánchez, & Martinez, 2018). On the other hand, it would be expected that if the use of these devices indeed saves driving time, this would have an impact on health (Tse et al., 2006; Feng & Boyle, 2014; Morris & Guerra, 2015), although such relationships should be studied in greater depth and clarified (Liu et al., 2022).
The results obtained in this study show that (1) variables associated with the use of driving devices and applications are diverse, and (2) these associations are shown according to the type of driver. For analysis purposes, a differentiation was made between professional drivers (PRODS) -those whose job is to drive-, occasional drivers (ODS) - those who drive out of need to fulfill their jobs-, and private drivers (PRIDS) -those who use their vehicles for their private and family trips, not for working purposes-. Thus, in professional drivers the use of these technologies is related to a higher level of education, driving fewer days a week, greater subjective well-being, and more accidents and fines.
Results obtained do not allow us to conclude if this relationship is due to the fact that a higher educational level favors the use of these technologies, which would therefore require certain skills that are less present in other people, or that people with higher educational levels have better mobile phones, which are those that include internet connections, pre-installed applications such as Google Maps®, or the ability to download others to the device, such as Waze®. In our data, age was not significantly associated, directly or indirectly, with the use of these devices.
In terms of days driven, perhaps the drivers who drive more days make fixed routes or journeys which they know well and in which there are not many possibilities to choose alternative routes. Regarding subjective well-being, the reasons for its relationship with the use of these technologies are not clear: it could be that their use gives Professional Drivers a sense of control over road events, together with the perception that they save time if they follow GPS instructions.
It could be expected that these drivers' responses to the SPWB scale would be affected by some level of social desirability. Although surveys were applied by university staff, respecting the anonymity of participants, and stating explicitly that the results of this survey would not be used by the collaborating transportation companies for job evaluation purposes, Professional Drivers might have felt evaluated for their health conditions.
The direct correlation between the use of GPS and higher rates of accidents and fines is striking. In this regard, GPS locates the position and trajectory of the vehicle itself, but not those of other drivers, so perhaps drivers who use more these devices distribute their attention between driving and GPS indications, therefore capturing fewer signs from the road environment about the risk of accidents or committing infractions -for example, running a red light due to not detecting it on time-. The results also show that Professional Drivers have been driving for more years and drive more days during a week. Correspondingly, they have had more accidents and more fines in the last two years.
In reference to Occasional Drivers, there are fewer variables associated with the use (more or less) of the devices and technologies mentioned in this study. Among the relationships found it is striking that a greater use of GPS is related not to suffering more accidents but to suffering more severe accidents -accidents with fatalities-. These drivers use such devices and technologies in a greater proportion than Private Drivers, especially Google Maps®. In relation to this situation, Table 2 shows that almost 50% of Occasional Drivers have a motorcycle license. The number of motorcycles in Bogotá has grown almost exponentially in recent years, and motorists are the group of users on the road with most fatalities in Colombia in recent years (Colombian National Road Safety Observatory, 2019). These drivers have less experience -fewer years of driving- and drive more days a week than Private Drivers with similar levels of accidents and fines than the previous ones. For these drivers, the Private ones, direct correlations were found between general (AQ) or specific (DAS) measures of anger, with the use of MDAD.
In terms of health, certain variables appear related to the use of devices and applications for driving. Specifically, diabetes and hypertension appear to be associated with the use of these MDAD; and even the suffering of cancer appears to be associated at a low but significant level. The reasons for these relationships are beyond the scope of the present investigation. As a hypothesis, advances can be made by stating that individuals with worse health conditions seek supports that facilitate driving to their destinations, as an ultimately form of self-care. Our data show that it is drivers who drive fewer days a week in whom this direct relationship between illnesses with the use of MDAD is most clearly shown. Therefore, this relationship cannot be attributed to variables of the driving itself. However, it should be considered that Professional or Occasional drivers would not have been equally sincere when answering questions about health, due to apprehension of possible employment consequences on maintaining their job with respect to their results.
Thus, social desirability appears as a variable that should be controlled in this and future investigations on the use of devices and applications for driving assistance. Several of these models include human behavior and its irrationality and uncertainty in decision-making (Seo et al., 2017). The role of anger in driving (Pérez et al., 2018), stress (Serge-Rodriguez et al., 2018), or moral disconnection (Pérez et al., 2018) are some variables that can determine the decision taken in terms of calm/safe vs. risky driving style (Stoichkov, 2013; Ruiz-Pérez et al., 2014) and decision-making in relation to MDAD, such as to use them or not, follow their indications or not, etc.
Explanatory models of the use of each MDAD by each type of driver found in this investigation explain a low percentage of the variance of its use. This is partially due to the fact that the current study only investigates the use/non-use of each device. Investigating the frequency and function of use of these applications (Gokasar & Bakioglu, 2018) could lead to models with greater explanatory capacity on the use of such MDAD. Even within the evolution of road mobility towards more autonomous vehicles, knowledge of drivers' psychological, emotional, and cognitive variables will be necessary to accommodate the maneuverability design of these vehicles and of mobile applications to the psychological competencies required for driving, taking into account the variables that may condition its use: impulsiveness (Wickens et al., 2008; Lazarus, Richard, Poulter, Powell, & Ypsilanti, 2019), tendency to road relapse (Lijarcio, Bosó, & Marti Belda, 2018), or, in our case, the educational level required to use and take advantage of the functions of these mobile applications. Finally, the results obtained allow us to propose future lines of investigation about the relationships between the use of MDAD with individual health styles and road accidents fields.
According to our results, it does not seem that the use of MDAD is related to the prevention of road accidents. MDADS make it easier to shorten travel times and save fuel (Astarita et al., 2018), but they do not necessarily change driving styles, except for those mobile applications that are aimed at training safe driving skills (Ferreira, Moreira, Santos Pereira, & Durão, 2015), and can even become distraction hazard agents (Wells, Briggs, & Savigar-Shaw, 2021). These devices require minimal attention from the user, which can lead to diminishing cognitive resources necessary for driving the vehicle and to attend to information on the road environment. And some of their characteristics, as the size of the screen, can make it difficult to take advantage of the information provided by the device (Tamer & Patterson, 2020). This could explain the positive relationship found in this study between the use of devices such as a GPS and road accidents with deaths. MDADs can shorten the travel journey, but can also be a distraction hazard (Wells et. al., 2021). Future research with larger samples may deepen and broaden the knowledge on the relationships between driving styles, use of MDADS, road accidents and health.

