


Services on Demand
Journal
Article
 English (pdf)
 Article in xml format
 Article references
 Send this article by e-mail
Indicators
-
 Cited by SciELO
 -
 Access statistics
Related links
-
 Cited by Google
 -
 Similars in
SciELO
Similars in
SciELO -
 Similars in Google
Share

 Permalink
Revista Facultad de Ciencias Económicas: Investigación y Reflexión
Print version ISSN 0121-6805
Rev.fac.cienc.econ. vol.21 no.2 Bogotá July/Dec. 2013
THE ENVIRONMENTAL KUZNETS CURVE (EKC): AN ANALYSIS LANDFILLED SOLID WASTE IN COLOMBIA*
LA CURVA AMBIENTAL DE KUZNETS (EKC): LA DISPOSICIÓN DE RESIDUOS SÓLIDOS EN COLOMBIA
A CURVA AMBIENTAL DE KUZNETS (EKC): A DISPOSIÇÃO DE RESÍDUOS SÓLIDOS NA COLÔMBIA
JUAN CARLOS TRUJILLO LORA**, BLADIMIR CARRILLO BERMÚDEZ***, CARLOS ANDRÉS CHARRIS VIZCAÍNO**** & WILMAN JAVIER IGLESIAS PINEDO*****
UNIVERSIDAD DEL ATLÁNTICO (COLOMBIA)
* This article is the product of the research project "The Environmental Kuznets Curve: An analysis for the solid waste sector in Colombia" linked to the group Desarrollo Económico, Instituciones y Políticas Públicas para el Progreso del Caribe Colombiano (PROCARIBE) classified in category D of COLCIENCIAS. The research was funded entirely by the group's own budget and its execution was carried out between October 2012 and January 2013.
** BS in Economics, Universidad del Atlántico, Barranquilla, Colombia. Master of Science in Economics, Universidad Nacional de Colombia, Bogotá, Colombia. Assistant Professor of the Department of Economics at Universidad del Atlántico. E-mail: juantrujillo@mail.uniatlantico.edu.co
*** BS in Economics, Universidad del Atlántico, Barranquilla, Colombia. Research Fellow of PROCARIBE. Department of Economics, Universidad del Atlántico. Barranquilla, Colombia. E-mail: bcarrillo@mail.uniatlantico.edu.co
**** BS in Economics, Universidad del Atlántico, Barranquilla, Colombia. Research Fellow of PROCARIBE. Department of Economics, Universidad del Atlántico. Barranquilla, Colombia. E-mail: ccharris@mail.uniatlantico.edu.co
***** BS in Economics, Universidad del Atlántico, Barranquilla, Colombia. Research Fellow of PROCARIBE. Department of Economics, Universidad del Atlántico. Barranquilla, Colombia. E-mail: wilmaniglesias@mail.uniatlantico.edu.co
Recibido/ Received/ Recebido: 01/03/2013 - Aceptado/ Accepted / Aprovado: 03/09/2013
Abstract
Environmental Kuznets Curve (EKC) hypothesis states that relation between environmental degradation and per capita income follows an upside down U path. This article aims to demonstrate EKC for Colombian case, using solid waste data from municipal landfills. The analysis is based on information from 707 towns during 2008 - 2011. Among main results there is evidence that supports the EKC hypothesis. This hypothesis is stable after controlling variables, such as population density and altitude above sea level. Results also show that inflection point is not homogeneous cross region.
Keywords: Economic growth, Environment, Solid waste disposed in landfills, Non-lineal model, Colombia.
Resumen
La hipótesis de la curva ambiental de Kuznets (EKC) sostiene que la relación entre la degradación ambiental y el ingreso per cápita sigue una trayectoria en forma de U invertida. El propósito de este artículo es probar la EKC para Colombia utilizando datos de residuos sólidos dispuestos en rellenos sanitarios municipales. El análisis se basa en información procedente de 707 municipios en el período 2008-2011. Entre los principales resultados, se encuentra evidencia que apoya la hipótesis de la CKA. Esta hipótesis se mantiene después de controlar variables, tales como la densidad poblacional y la altitud sobre el nivel del mar. Los resultados también indican que el punto de inflexión no es homogéneo a través de todas las regiones del país.
Palabras clave: Crecimiento económico, Medio ambiente, Residuos sólidos dispuestos en rellenos sanitarios, Modelo no lineal, Colombia.
Resumo
A hipótese da curva ambiental de Kuznets (EKC) sustenta que a relação entre a degradação ambiental e o rendimento per capita segue uma trajetória em forma de U invertido. O propósito deste artigo é provar a EKC para Colômbia utilizando dados de resíduos sólidos dispostos em terrenos sanitários municipais. A análise se baseia em informação procedente de 707 municípios no período 2008-2011. Entre os principais resultados, encontra-se evidência que apoia a hipótese da CKA. Esta hipótese se mantém depois de controlar variáveis, tais como a densidade populacional e a altitude sobre o nível do mar. Os resultados também indicam que o ponto de inflexão não é homogêneo através de todas as regiões do país.
Palavras chave: Crescimento econômico, Meio ambiente, Resíduos sólidos dispostos em terrenos sanitários, Modelo não linear, Colômbia.
Trujillo, J. C., Carrillo, B., Charris, C. & Iglesias, W. (2013) The environmental kuznets curve: ananalysis ofthe landfilled solid waste in Colombia. En: Revista de la Facultad de Ciencias Económicas de la Universidad Militar Nueva Granada. rev.fac.cienc.econ, XXI (2)
JEL: Q50, Q53, Q56.
1. Introduction
There has been an increasing interest in solid waste management in recent years. According to World Bank (2012), the world currently produces approximately 1.3 billion tons of solid waste per year. Of this total, Latin America and the Caribbean contribute 12%. Colombia produces approximately 10 million tons of waste annually, and in 2025, it is expected to exceed 24 million tons of waste (Hoornweg & Bhada-Tata, 2012). Once collected,waste can be assigned to various transformation processes, including recycling, energy recovery, compost, biogas production alternative fuels and other transformation processes.1 Although these processes should be framed within comprehensive solid waste management in a way that represents health, environmental and socioeconomic benefits, when using garbage is not possible, the landfill appears as an option for final disposal. However, the emphasis has increasingly turned to reducing waste in landfills by increasing recycling and composting. Therefore, the goal of many countries, particularly European ones, is not to use landfills. Nevertheless, in Colombia landfill disposal is the most widely used system. These landfills receive the garbage of 763 municipalities but often have problems with leachate treatment, management of gases and daily coverage of the deposited material, as well as other problems (Noguera & Olivero, 2010). Furthermore, because this system is the most used in the country, its implementation reduces the amount of land available for use for alternative activities.
Because of the increasing environmental pollution, there has been considerable interest in studying the economic relationship between the standard of living of society and environmental degradation. In the early nineties, the EKC hypothesis was formulated by Grossman & Krueger (1991) and Shafik & Band-yopadhyay (1992). This hypothesis raises an inverted U-shaped relationship between economic growth and some indicators of environmental degradation2. There are various arguments that explain the shape of the curve. Dinda (2004) groups them into the following categories: scale effects, technological progress, composition effect, elasticity of demand for environmental quality, international trade, market mechanism and regulation. In the study by Grossman & Krueger (1991), it is argued that economic growth implies a negative scale effect on the environment. According to the hypothesis of the scale effect, the amount of pollution generated increases when economic activity expands. However, this trend can be reversed via technological progress and changes in the productive structure. Regarding the latter, these occur when the continuous increases in income drive the transition from capital-intensive heavy industry activities to a service economy, which generates less pollution. This phenomenon is called composition effect (Shafik, 1994).
Another argument that helps explain the EKC is the elasticity of demand for environmental quality. There is evidence that the growth of GDP per capita leads to further deterioration of the environment in early stages of economic development. However, income growth stimulates demand for a cleaner environment by increasing the resources available to combat pollution (World Bank, 1992). According to Roca (2003), the willingness to pay for improvements in environmental quality increases in greater proportion than income, after meeting a certain income threshold. In this sense, environmental quality can be considered a luxury good for certain income levels. When the basic needs of people are met, their concern for the environment increases (Dasgupta et al., 2002). As such, when a community moves toward achieving its social objectives, its institutions are strengthened to improve the regulatory framework and the effectiveness of the control agencies that enforce existing legislation. That is why individuals change their consumption habits towards more environmentally friendly products and pressure the authorities to implement stricter environmental regulations (Dinda, 2004). According to Dinda (2004), the weak regulation in developing countries leads to a reduced ability to enforce the rules established, which attracts multinational companies that develop highly pollutant production processes.
While pollution activities in developed countries face higher regulatory costs than those of poor countries, international trade and globalization stimulate the relocation of polluting industries to countries with less regulated economies (Mani & Wheeler, 1998). This is called the pollution haven hypothesis. This hypothesis can explain, according to Mani & Wheeler (1998), the reductions in levels of environmental degradation in developing countries and increases in the level of environmental degradation in middle-income countries. Meanwhile, Andreoni & Levinson (2001) reinforce the idea that the EKC depends more directly on the existence of economies of scale in the elimination of pollution rather than externalities, institutional policies and growth dynamics.
Several studies have empirically proven the existence of the EKC in solid waste. In a global context, Johnstone & Labonne (2004), using a panel data of countries in the Organization for Economic Cooperation and Development (OECD), examined the economic and demographic determinants of solid waste production. These authors found that urbanization and population density have a positive effect on the generation of municipal solid waste, whereas the percentage of children in the household has a negative effect. At the national level, and using cross-sectional data of 1991 for 3,141 counties in the United States, Berrens et al. (1997) found evidence supporting the existence of the EKC for the hazardous waste sector. These authors estimated that the turning point is US$20,253.3 Meanwhile, Mazzanti, Montini & Zobolini (2008) provided empirical evidence of the relationship between the amount of solid waste generated and socioeconomic variables by analyzing a panel of 103 Italian provinces during the period 1999-2005. The results showed evidence for the EKC for solid waste with a turning point between 22,586 and 31,611 euros of income per capita. One of the conclusions of this study argued that the identification of the EKC depends largely on the availability of disaggregated national data. Finally, the policy implications of Mazzanti et al. (2008) noted that developing countries should not expect the implementation of policies to reduce solid waste until obtaining high levels of consumption and individual income. Following the approach of Mazzantiet al. (2008), Ichinose, Yamamoto & Yoshida (2011) used disaggregated municipal solid waste information for Japan in 2005. They found evidence supporting the EKC for solid waste from households, but no evidence for the waste produced by businesses. The turning point for the waste disposed of in land fillsstoodat 3.48 million yen.
Despite the importance of determining the existence of the EKC in solid waste, little research has been formally conducted on the subject. In fact, studies are more scarce at the country level. In the case of developing countries, the lack of environmental indicators has hindered the ability to test the hypothesis, although the effects of environmental degradation are higher in these countries (Zilio, 2012). Colombia is no exception. However, there is a study that proves the existence of the EKC for other pollutants. Correa et al. (2005) studies the EKC thesis using time series data for three indicators of environmental degradation: Sulfur Dioxide, Carbon Dioxide and biochemical oxygen demand. The authors conclude that Colombia is in the growing phase of the EKC. In other words, the country's economic growth means more environmental damage. Nevertheless, this finding should be interpreted with caution for at least one reason. As it has been empirically tested per capita income and pollution indicators tend to be non-stationary variables. This suggests that the strong correlation found between per capita income and pollution indicators could be spurious since they do not specify a cointegration test4. Apart from Correa et al (2005) there is no other study that brings evidence on the EKC. The aim of this paper is to provide empirical evidence of the existence of the EKC in the sector of solid waste disposed of in Colombia's municipal landfills. The analysis is conductedon707 municipalities using an unbalanced panel data during the period 2008-2011. In recent decades, the effects of economic activity on environmental degradation have been increasingly examined in the context of national economies. For this reason, the identification of these effects may contribute to the development of more effective policies for environmental management and particularly those related to solid waste. Specifically, this research seeks to answer the following questions: Does it meet the EKC hypothesis for the solid waste sector? How is solid waste generation related to geographic and demographic variables? Are there increasing, constant or decreasing returns between consumption and the disposal of byproducts or residues?
This article proceeds as follows. Section 2 presents the solid waste situation in Colombia. Section 3 describes the empirical strategy used for estimation of the EKC in two specifications, namely, conventional and non-linear. Section 4 provides the results of the estimates. Section 5 concludes this article.
2. Solid waste in colombia
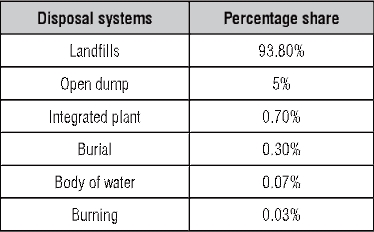
Solid waste is a heterogeneous mass resulting from human activity or from other living organisms andis largely comprised of waste from materials used in the manufacturing or the use of consumer goods (Fernández & Sánchez, 2007). Solid waste contributes to the contamination of underground water streams and the production of methane, which is a greenhouse gas. According to figures from Hoornweg & Bhada-Tata (2012), solid waste contributes approximately 5% of total greenhouse gases in the atmosphere. In Colombia, according to figures from the Superintendencia de Servicios Públicos Domiciliarios (SSPD) for 2011, the largest department's producers of waste at a national level were Cundinamarca, Antioquia, Valle del Cauca, Atlántico and Bolívar. The Colombian capital cities contribute 65.3% of total solid waste. It is worth noting that the country currently manages its waste using various disposal systems: landfills, open dump, integrated plant, burial, body of water and burning, which account for 93.8%, 5%, 0.7%, 0.3%, 0.07%, and 0.03% of the waste, respectively (see Figure 1).
Figure 1. Distribution of disposal systems for 20115.
In Colombia, there are 1,112 municipalities, of which only 1,098 have reports on the type of disposal they use for their waste. As indicated in Table 1, in 2011, 762 municipalities used landfills, 190 used open dumps, and 67 used integrated plants for the treatment of solid waste.
Table 1. Disposal systems for 20116
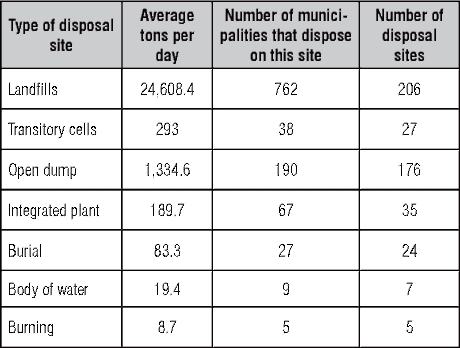
The use of landfills in 2011 increased by 4.7% (between 764 and 800 municipalities), whereas the use of integrated plants for the treatment of solid waste decreased by 20% (from 83 to 67 municipalities). This decrease can be attributed to the result of the surveillance conducted by the SSPD over the last few years. This entity encourages municipalities to use suitable sites for disposal of their waste, to employ the appropriate infrastructure, and to fulfill current regulatory requirements.
The environmental problems associated with solid waste have increased in recent years. These problems have been regulated over time to address the collection, transportation, treatment and disposal of this waste. The policy for solid waste management is based on the Constitution of Colombia, Law 99 of 1993 and Act 142 of 1994. This policy has supported the establishment of the regulatory framework for the structuring of a methodology with which Integrated Solid Waste Management Plans (Planes de Gestión Integrada de Residuos Sólidos, PGIRS, in Spanish) are designed. Municipalities must submit these plans and implement them under the supervision of the relevant control bodies. All these actions aim to achieve sound management of waste by imposing restrictions to end open dumps while fostering the use of landfills.
3. Empirical strategy
To elucidate the relationship between solid waste disposed of in landfills and economic growth, we utilized two types of models: the conventional model and the nonlinear model proposed by Andreoni & Levinson (2001).
3.1. conventional model
Following Cole (2004) and Dinda (2004), we analyze the EKC hypothesis using the following expression:
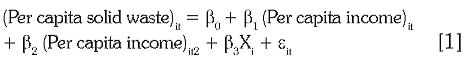
in which β0 represents the intercept parameter, per capita income is the municipal gross domestic product per inhabitant, Xi is a vector of geographic and demographic variables, and ε is the random error term. The last term has the properties of a conventional panel data, which differs between fixed and random effects. In order to satisfy the EKC hypothesis the sign of β2 should be negative.
3.2. structural model
From Andreoni & Levinson (2001) we assume an economy with a single utility maximizing individual and no externalities. In addition, the agent only receives utility from consumption of a private good (c) and of waste not recycled (Rnr). Therefore, the representative individual has a utility function of the form:
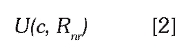
in which U is increasing in c and decreasing in Rnr.7 Here, Rr is the fraction of the total waste generated that is recycled and interpreted as an indicator of pollution abatement. Thus, the total waste is expressed as Rtot = Rnr + Rr. The specification of the utility function of the representative individual is:

in which z is the rate of constant disutility of Rnr4. Thus, an individual can reduce pollution by spending resources. This is known as environmental effort (E).8 Therefore, the pollution caused by solid waste is an increasing function of c and a decreasing function of E. Furthermore, assuming that Rtot is a fraction δ (0<δ<1) of c and Rr is a Cobb-Douglas function of the form Rr=cαEβ, it is possible to express Rnr as:

in which cα indicates the proportion of consumption that can be recovered and the parameter a represents a technological component, which is derived from the possibility of recycling the consumption. If α = 1, then all consumption is separable and represents the maximum amount of recycling. When α = 0 the consumption is not recyclable. Thus, when a increases, Rr increases and Rnr decreases given E. A similar intuition applies for Eβ. In this case, as it increases, β, Rr increases while Rnr decreases. This is due to a greater effect of E given c. In [3], c has a double effect. First, c increases Rnr and, second, c reduces it. So the effect of consumption on non-separated waste is ambiguous. The primal problem facing the individual is:
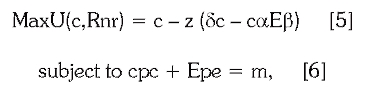
in which m is the income, pc is the price of consumption and pe is the price of effort. The optimal choices of consumption (c*) and effort (E*) forz = δ = 1, are: 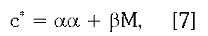

in which M=mPc is the real income and π= PePc is the relative price of effort. Replacing [7] and [8] in [6], we obtain the optimal choice of non-recycled waste (Rrn*):
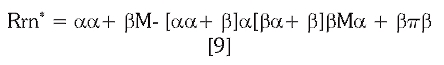
Regarding the path of the relationship of income-non-recycled waste, this will depend on the values of parameters α and β. If α + β > 1, then the removal of contamination will display increasing returns to scale; therefore, the tendency will be an inverted U-shaped curve described by the EKC.9 The turning point from which Rrn* decreases is equal to:

Equation [10] indicates that the turning point depends on the relative price of effort, π, which is a function of demographic and geographic factors such as population density and altitude. Moreover, the price of effort varies between individuals and in the context of the community.
Thus, the estimate of [9] addresses the specific objectives proposed. First, we determine the effecto f demographic and geographic variables in the generation of solid waste disposed of in landfills. Second, we test the hypothesis of increasing returns to scale in the production function of solid waste. The analysis is conducted on 707 municipalities using an unbalanced panel data during the period 2008-2011. The data are obtained from the following sources: Departamento Administrativo Nacional de Estadística (DANE), Sistema Único de Información (SUI) of the SSPD, Departamento Nacional de Planeación (DNP) and Federación Colombiana de Municipios (FCM)10.
4. Results
Table 2 presents the estimation of the conventional model. It is observed that the results support the existence of the EKC for solid waste disposed of in landfills. The introduction of geographic and demographic variables does not alter the results evidencing the EKC for solid waste disposed of in landfills of the municipalities of Colombia. More over, population density and altitude were statistically significant and have a negative and positive effect, respectively. These results imply that the most densely populated areas and with a lower elevation relative to sea level tend to increase the generation of waste in the national context. Turning points in the range of observation were estimated for the three geographical regions. Nationally, the turning point is at approximately US$ 13,682. The Andean region exhibits a turning point around US$ 14,359. Finally, in the rest of the country, the turning point reaches US$ 14,012.11
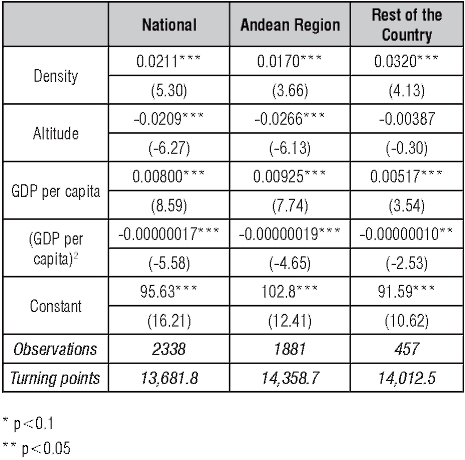
The second part of our empirical analysis concerning the nonlinear model is presented in Table 3. The purpose of this assessment was to strengthen the relationship between the empirical and theoretical analysis of the EKC. One of the implications of the estimation using nonlinear least squares is the appropriate allocation of initial values to the parameters. This implication becomes more important when the number of parameters to be estimated is large. Given this, we assume a=1, which indicates that all consumption can be recycled. As observed in Table 3, the sum of the estimated coefficients a andb> 1 for the three regions. This condition indicates that the elimination of pollution from solid waste disposed of in landfills shows increasing returns to scale. Thus, as shown in Figures 1, 2 and 3, the trend is observed in the form of an inverted U as described by the EKC.
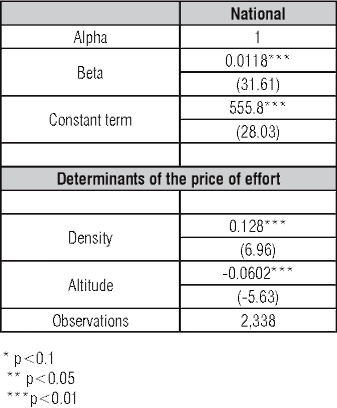
Furthermore, Table 3 shows that the population density and altitude determine the price of effort in each of the regions examined. Regarding population density, we can see that the cost of the effort of reducing pollution is higher in more densely populated areas. However, when interpreting the effect of altitude on the price of effort, we can see that the cost of reducing pollution decreases at higher altitudes above sea level.
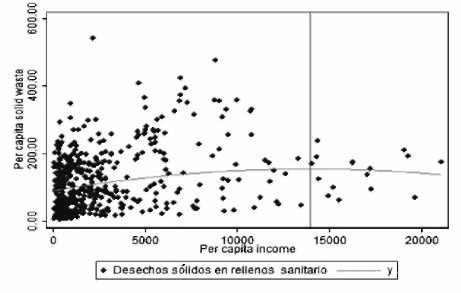
Figures 2, 3 and 4 show graphically a U-inverted relationship between solid waste disposed of in landfills and income per capita in the contexts of the nation, the Andean region, and the rest of the country, respectively. Moreover, the turning points in each of these three contexts are between U.S. $ 10,000 and U.S. $ 15,000 of income per capita. Another observation is that most of the municipalities in all areas analyzed are concentrated in the growing segment of the curve.
Figure 2. National Environmental Kuznets Curve for solid waste disposed of in landfills14

Figure 3. Environmental Kuznets Curve for solid waste disposed of in landfills in the Andean Region15
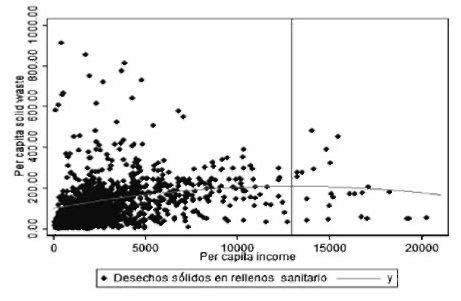
Figure 4. Environmental Kuznets Curve for solid waste disposed of in landfills of the Rest of the Country16
5. Conclusions
This article is an application of the hypothesis of Environmental Kuznets Curve to solid waste disposed of in landfills at a municipal level. For other empirical models, we take a step forward by including variables such as altitude and population density as factors affecting the income-pollution relationship with solid waste. The results indicate that the less densely populated areas with higher elevations relative to sea level tend to decrease the production of solid waste disposed of in landfills in Colombian municipalities. Moreover, estimates for the turning points include US$13,682, US$14,359, and US$14,012 for Colombia, the Andean region and the rest of the country, respectively.
The recycling effort is a key indicator to verify the improvement in the quality of the environment. That is why we define a nonlinear model to explain the main variables that influence the pricing of the effort to reduce pollution. This price depends on the altitude and population density in each of the regions studied. The main finding of this study is the obtainment of the Environmental Kuznets Curve for both the conventional model and the nonlinear model proposed. Further studies could verify the existence of the Environmental Kuznets Curve for other pollutants and control for other factors such as energy consumption and policy variables.
1 According to US Environmental Protection Agency (2012), compost "is organic material that can be used as a soil amendment or as a medium to grow plants. Mature compost is a stable material with a content called humus that is dark brown or black and has a soil-like, earthy smell. It is created by: combining organic wastes (e.g., yard trimmings, food wastes, manures) in proper ratios into piles, rows, or vessels; adding bulking agents (e.g., wood chips) as necessary to accelerate the breakdown of organic materials; and allowing the finished material to fully stabilize and mature through a curing process.'"
2 The scenario is similar to the originally raised by Kuznets (1955), in which the distribution of income is related to economic growth.
3 The turning point refers to the critical level of income at which environmental degradation decreases, ceteris paribus.
4 For a deeper analysis on spurious regressions see Johansen (1988).
5 SSPD (2011).
6 SSPD (2011).
7 Rnris considered a public bad and can be interpreted as an indicator of environmental pollution that brings about disutility to the individual. Furthermore, Rnris a byproduct of c. Thus, an increase in the consumption implies a higher degree of pollution.
8 Effort comes at a price, so called price of effort, which may depend on various factors, such as geographic and demographic factors.
9 For more details see Appendix.
10 Database is available upon request by sending an e-mail to the corresponding author.
11 The income is in constant prices in dollars of 2005. One dollar at the time of this study costs 1,794.63 Colombian currency.
12 Research data.
13 Research data.
14 Note: Solid waste is in pounds per capita. Research data.
15 Source: Research data. Note: Solid waste is in pounds per capita.
16 Source: Research data. Note: Solid waste is in pounds per capita.
6. References
Andreoni, J. & Levinson, A. (2001)"The simple analytics of the environmental Kuznets curve". In:Journal of Public Economics, 80(2):269-286. [ Links ]
Berrens, R., Bohara, A., Gawande, K. & Wang, P (1997)"Testing the inverted-U hypothesis for US hazardous waste: An application of the generalized gamma model". In: Economics Letters, 55(3):435-440. [ Links ]
Cole, M. (2004) "Trade, the pollution haven hypothesis and the environmental Kuznets curve: examining the linkages". In: Ecological Economics, 48 (2004) 71- 81 [ Links ]
Correa, FF, Vasco, A. & Pérez, C. (2005) "La Curva Medioambiental de Kuznets: Evidencia Empírica para Colombia". In: Semestre Económico, 8(15):13-30. [ Links ]
Dasgupta, S., Laplante, B., Wang, H. & Wheeler, D. (2002)"Confronting the environmental Kuznets curve". In: The Journal of Economic Perspectives, 16(1):147-168. [ Links ]
Dinda, S. (2004) "Environmental Kuznets curve hypothesis: A survey". In: Ecological Economics, 49(4):431-455. [ Links ]
Fernández, A. & Sánchez M. (2007) "Guía para la gestión integral de los residuos sólidos urbanos". Organización de las Naciones Unidas para el Desarrollo Industrial (UNIDO). Available at: www.unido.org/fileadmin/import/72852_Gua_Gestin_Integral_de_RSU.pdf [ Links ]
Grossman, G. & Krueger, A. (1991) "Environmental impacts of a North American free trade agreement". The National Bureau of Economic Research.NBER Working Paper No. 3914.Available at:http://www.nber.org/papers/w3914 [ Links ]
Hoornweg, D. & Bhada-Tata, P (2012)"What a waste: A global review of solid waste management". World Bank.Urban Development Working Paper No. 15. Available at: http://go.worldbank.org/BCQEP0TMO0 [ Links ]
Ichinose, D., Yamamoto, M. & Yoshida, Y. (2011) "Reexamining the waste-income relationship". GRIPS National Graduate Institute for Policy Studies. Discussion Paper No. 10-31. Available at: http://r-center.grips.ac.jp/gallery/docs/10-31.pdf [ Links ]
Johansen, S. (1988) "Statistical analysis of cointegration vectors". In: Journal of Economic Dynamics and Control, 12:231-254 [ Links ]
Johnstone, N. & Labonne, J. (2004)"Generation of household solid waste in OECD countries: An empirical analysis using macroeconomic data". In: Land Economics, 80(4):529-538. [ Links ]
Mani, M. & Wheeler, D. (1998) "In search of pollution havens? Dirty industry in the world economy: 1960-1995". In: Journal of Environment and Development, 7(3):215-247. [ Links ]
Mazzanti, M., Montini, A. & Zobolini, R. (2008)"Municipal waste generation and socioeconomic drivers".In: Journal of Environment and Development, 17(1):51-59. [ Links ]
Noguera, K., & Olivero, J. (2010) "Los rellenos sanitarios en Latinoamérica: caso colombiano". In: Revista de la Academia Colombiana de Ciencias Exactas, Físicas y Naturales, 34(132):347-356. [ Links ]
Presidencia de la República (Retrieved December 15, 2012). "$2.700 Millones para apoyar planes de gestión integral de residuos sólidos". Available at: http://www.presidencia.gov.co/sne/2004/agosto/09/21092004.htm [ Links ]
Roca, J. (2003) "Do individual preferences explain the environmental Kuznets curve?" In: Ecological Economics, 45(1):3-10. [ Links ]
Superintendencia de Servicios Públicos Domiciliarios. (Retrieved November 4, 2012) "Situación de la disposición final de residuos sólidos en Colombia: Diagnóstico 2011".Available at: http://www.superservicios.gov.co/c/document_library/get_file?uuid=eef29b3e-9d73-4adb-8fdd-1e526981c01c&groupId=10122 [ Links ]
Shafik, N. & Bandyopadhyay, S. (1992) "Economic growth and environmental quality: time series and cross-country evidence". World Bank.Policy Research Working Paper Series No.WPS904). Available at: http://go.worldbank.org/8RO2WVHGN0 [ Links ]
Shafik, N. (1994)"Economic development and environmental quality: an econometric analysis". In: Oxford Economic Papers, 46(Special issue):757-773. [ Links ]
US Environmental Protection Agency (2012) "Composting for Facilities".Available at: http://www.epa.gov/compost/basic.htm [ Links ]
World Bank (1992).World development report 1992: Development and the environment. New York: World Bank and Oxford University Press. [ Links ]
World Bank (2012) "What a Waste: Time to Pick It Up". Sustainable Cities.Available at: http://blogs.worldbank.org/sustainablecities/what-a-waste-time-to-pick-it-up [ Links ]
Zilio, M. (2012)"Curva de Kuznets ambiental: La validez de sus fundamentos en países en desarrollo". In: Cuadernos de Economía, 35(97):43-54. [ Links ]
Appendix
Equation [9] describes the role of non-recycled waste. The curvature depends on the values of the parameters α and β and the price of effort. The path income-waste shows a U-shaped inverted if these parameters satisfy the following conditions: the higher the price of effort the greater the turning point, ceteris paribus. The first derivative of the non-recycled waste function is greater than zero:

The second derivative allows extracting the conditions that define the shape of the curve:
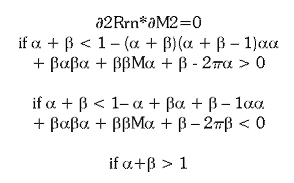
In the first condition, the function is linear and increasing. The second function is convex, and it does not adopt the form of the EKC. In the latter, there are increasing returns to scale in eliminating pollution. Therefore, in the latter case, the relationship of income-waste has an inverted U -shaped curve.
