


 Spanish (pdf)
 Article in xml format
 Article references
 Send this article by e-mail
 Cited by SciELO
  Cited by Google
  Similars in
SciELO
Similars in
SciELO  Similars in Google
 Permalink
Introduction
Profitability analysis for the electricity, gas, and oil sectors is a decision-making tool for those agents that compete in these sectors. Identifying the determinants of profitability for such companies allows optimal resource allocation and business strategy orientation to increase the value of invested capital. Regulated companies must meet requirements for calculating and presenting the return on invested capital. From this point of view, it is crucial to know the determining factors of profitability to improve financial performance and follow the regulation.
In this work, we analyze companies engaged in energy, gas, and oil generation/production, transport, distribution, and trading in the American continent. The study’s primary objective is to identify the factors that differentiate profitability in electric energy, natural gas, and oil companies, mainly Colombian ones. According to our literature review, there is no empirical evidence on the determining factors of oil and gas companies’ profitability in America. Therefore, our results shed light for the first time on financial issues essential to policymakers, investors, and companies in this sector.
We employed information of public companies operating in the continent and private and public companies in Colombia. We organized our information into three levels: company, sector, and country. At the company level, we retrieved financial ratios. At the sector level, we calculated dynamism and munificence indicators for each sector per country. Finally, at the country level, we used macroeconomic and institutional variables.
The analysis was performed on homogeneous groups of companies using cluster analysis. The cluster structure revealed considerable detail of the profitability analysis for companies in the electricity and gas sector, allowing adequate resource allocation for greater efficiency.
An econometric panel data model was used to analyze the determining factors of profitability in the energy sector. Based on the findings, we present detailed conclusions and several strategies nedero improve performance measured through profitability.
The rest of this document is organized into five sections. In the second section, we provide the literature review necessary to provide the background on the determining factors of profitability in America and worldwide. In the third section, we describe the data and method used for this analysis. The fourth section presents the results obtained from the application of the clustering technique. In the last section, we discuss and analyze the results of applying the econometric models and, finally, list our conclusions and recommendations.
Literature review
Companies’ financial performance is measured using the profitability ratio given its explanatory power (Romero et al., 2011). It is commonly used in companies’ financial analysis due to its simplistic interpretation and possibility of determining their value drivers (Eslava, 2010). These ratios let us find relationships between financial performance and variables such as asset turnover. Modi and Mishra (2011) study the financial performance of more than 3,600 companies in the United States between 1991 and 2006 using profitability ratios such as Return on Assets (ROA) and Return on Equity (ROE).
Recent research in the field has found potential relationships between companies’ financial performance and financial ratios (Delen et al., 2013). For example, recent studies reveal that financial leverage improves financial performance and, therefore, decision-making regarding the capital structure is determining for this performance (Akhtar et al., 2012). In this way, Restrepo et al. (2020) analyze the oil sector’s capital structure and find changes in companies’ capital structure over time. One crucial finding is firms’ sensitivity to investment decisions depending on their decision to raise capital by issuing more or less debt.
For energy companies, some studies have been carried out on financial performance (Capece et al., 2013) using profitability ratios. The performance measures are diverse, and they can be used at convenience according to the analysis to be carried out. Neder et al. (2005) found that using a standard performance indicator, such as the cost-to-income ratio, is quite limited as it does not reveal the causes of a company’s good or poor performance. Instead, they recommend the use of performance measures which make it possible to obtain greater detail on the causes of good or poor performance and its behavior; in their particular case, cost-to-income ratio measured in detail through each of the components Neder et al. (2005).
According to Reynaud and Alban (2013), regulation is a central aspect of measuring utility companies’ profitability. The regulation imposes different types of restrictions on the tariff systems to guarantee public access to services. These restrictions imply a remuneration regulated by the shareholders of companies providing services in these sectors. However, measuring profitability in regulated companies is complex, as it implies investment decisions and production plans and restrictions related to the level of competition and economic growth (Reynaud & Alban, 2013). For Roberts et al. (1978), regulated companies’ rates-of-return heavily depend on their strategies to guarantee the minimum return rates imposed by regulators. The energy sector’s profitability analysis sight considers the particular sector characteristics as geographic zones and the available oil reserves since both characteristics impact these firms’ revenues (Restrepo et al., 2018).
Property rights can affect companies’ financial results. In this sense, the property structure, be it private or public, affects the companies’ profitability (Hollas & Stansell, 1994). Along with the maximization of wealth goal, public companies can have different social purposes, probably not considered a priority in private companies. National oil companies have objectives such as price subsidies and employment, constituting a trade-off between non-commercial objectives and value maximization for shareholders (Cabrales et al., 2017).
Lee et al. (1999) found that regulation changes in the United States have led to a small increase in productivity but have not substantially affected companies’ profitability. For instance, some specific accounting practices regarding amortizations, affect not only performance but the market value of the companies (Bandyopadhyay, 1994). More recent studies on the value relevance of GAAP and non-GAAP practices are in the same line (Misund & Osmundsen, 2015).
There are several innovations in developing energy companies’ performance indicators. Some sophistication reveals technical forms of interpreting performance in the energy sector. For example, the return on investment in energy allows an interpretation of the companies’ efficiency in the sector regarding productivity and resource allocation (King & Hall, 2011). However, these indicators are reflected in common financial ratios, such as ROA or ROI when interpreting their economic impact for the companies.
One of the international references in literature is studying the Arctic oil and gas industry development determinants. International market development and global geopolitical tensions have been found as the main determinants for such development (Keil, 2017). On the other hand, Hazarika (2015) found that fluctuating oil prices do not significantly impact the profitability and financial performance of oil and gas companies worldwide. Additional recent literature developments on the determinants of profitability for oil and gas companies have been developed, mostly for specific regions. For example, there is a study on the Norwegian continental shelf centered on investment decisions. The research found the geological characteristics and oil prices the main variables for oil and gas companies (Bertsen et al., 2018).
For the United States oil and gas industry, a study by Seunghyun (2017) finds a positive correlation between oil price volatility and firms’ earnings volatility. Along the same line, Dayanandan and Donker (2011) positively and significantly impact firms’ performance in this US industry using accounting performance measures. Such results contrast with the previous international findings of Hazarika (2015). However, Mohanty and Nandha (2011) consider that such sensitivity varies over time and across firms and industry subsectors.
In Canada’s case, there is a study regarding the effect of oil prices and reserves on the return of stocks of oil and gas companies (Boyer & Filion, 2007). A recent study by Restrepo et al. (2020) is related to oil and gas companies’ capital structure in the NYSE. Nonetheless, there is no evidence on additional research about determining factors of profitability for oil and gas companies in the American Continent. Some specific works in Latin America refer to determinants of credit ratings for such companies (Broker Bone, 2019) as well as some studies about the political economy of oil production (Manzano & Monaldi, 2008) and the financial performance of national oil companies (Cabrales et al., 2017).
Method
First, we describe our sample of companies and the sources of information. Then, we present the method used in this analysis; particularly the variables used and our econometric model.
Sample
We retrieved information of companies listed in America’s energy sector and companies belonging to Colombia’s energy sector (public and private). For public data, we used the Thomson Reuters database; for Colombia, we used the information reported by companies to the Single Information System (SIS) for utilities, managed by the Superintendencia de Servicios Públicos1 in Colombia. We used companies’ financial in the energy sector (energy, oil, and gas) of the American continent from 2003 to 2014. We use several filters to validate the data retrieved: 1) the income from sales must be greater than zero, 2) the property, plant, and equipment must be equal to or greater than zero, 3) the liability must be greater than zero, and below the assets, and 4) the asset turnover must not exceed 100. In the end, we found around 500 companies (see Table 1).
Table 1 Number of companies per year
| Year | Number of companies |
|---|---|
| 2003 | 459 |
| 2004 | 472 |
| 2005 | 480 |
| 2006 | 488 |
| 2007 | 511 |
| 2008 | 519 |
| 2009 | 492 |
| 2010 | 504 |
| 2011 | 498 |
| 2012 | 500 |
| 2013 | 507 |
| 2014 | 427 |
Source: Own elaboration
We can see that the year with the most significant number of observations is 2008. To have a reference base, we present the number of companies per sector for each country in 2014 (see Table 2).
Methods of analysis
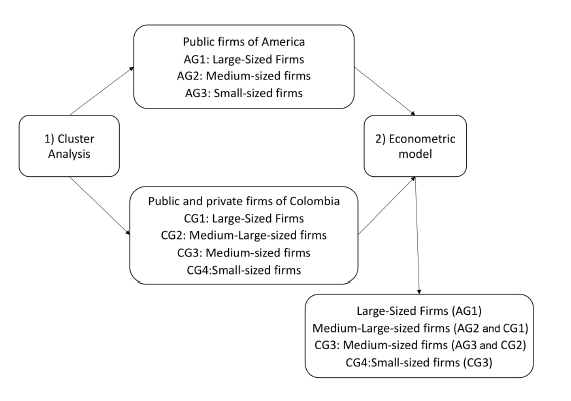
We employ two methods to find the determinants of profitability for the companies in the energy sector in America: on the one hand, cluster analysis for all the companies in the database and the Colombian companies and on the other hand, an econometric model (see Figure 1).
1) Cluster analysis: We use a cluster analysis method to classify our data depending on some sort of similarity. In the first step, we ran a factor analysis to identify the relationship between the individuals’ characteristic variables (companies) in the dataset.
Then, we choose five variables for clustering: size, the tangibility of assets, leverage, and efficiency of assets. Firm size is the logarithm ofthe assets. Asset tangibility is the share of property, plant, and equipment in total assets. Leverage is the percentage of the assets financed by third parties. Asset turnover is the division of sales on total assets. The current ratio is the current portion of assets and liabilities. We use the most recent year (2014) as the base year for clustering data.
Our model was based on a hierarchical analysis, and we employed Ward’s Method to clustering each point in our dataset (Ward, 1963). This method is based on a classical sum-of-squares criterion (an ANOVA-based approach) and minimizes within group dispersion (Murtagh & Lagendre, 2014). Ward (1963) proposes the Minimum Variance Criterion, which is focused on minimizing the total variance within the cluster. In the initial step, all clusters contain a single (lone) point. The algorithm under this objective function is recursive, and the initial distance between the individual objects must be proportional to the square of the Euclidean Distance (Ward, 1963). According to Ward (1963), the initial cluster distances in the Minimum Variance Criterion are defined as the square of the Euclidean distance between points so (Equation 1):
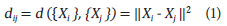
where d ij denotes the Euclidean distance between the points X i and X j .
The cluster analysis was done for America and Colombia independently. For the firms from America, we obtain three statistically significant groups, for which the variables discriminate between the groups. In the case of the firms from Colombia, we obtain four statistically significant groups.
We join the cluster results obtained for America and Colombia. The large companies from America formed the first group of analyses (AG1). The medium-sized companies from America (AG1) with the large ones from Colombia (CG1) formed the second group of analysis. Finally, small companies from America (AG3) and the medium-large and from Colombia medium-sized from Colombia (CG3 and CG2) companies formed the third group of analysis. Finally, we decided not to analyze Colombia’s small companies (CG4) because they report information to the Regulator that is not reliable.
2) Econometric model: Our base model relates the firm’s financial performance, measured by ROE, ROA, and EBITDA margin, tp the firm, sector, and country-level variables. Variables were depurated considering the following criteria: i) ROA, ROE, and the EBITDA margin must fall between -1 and 1, ii) the indebtedness must level fall between 0 and 1, and iii) the quotient between the long-term asset and the total asset, used as and indicator of asset tangibility, must be between 0 and 1. The following is a description of the dependent and independent variables used in the model.
Dependent variable: Financial performance (FP) is measured by ROA and ROE, calculated by dividing the net income by the total asset and the net income on equity. In the literature, these indicators have been broadly used to measure financial performance (McConell & Servaes, 1990; Rhoades et al., 2001; Sandoval, 2001), and even in more recent studies, these ratios and other similar measurements, such as ROA, serve to assess the companies’ financial performance (Delen et al., 2013; Modi & Mishra, 2011). We also use earnings before interest, taxes, depreciation, and amortizations (EBITDA). Although the literature does not strictly consider this measure as a performance indicator, it is recognized as a value creation measure (Bastidas Méndez, 2007).
Control variables: The control variables were defined at the firm, industry, and country levels. At the firm level, we included leverage and asset tangibility. More leverage has a significant impact on financial performance, in particular for regulated companies (Gordon & McCallum, 1972; Patterson, 1983). Asset tangibility is related to investments, one of the most critical decisions for regulated companies; in fact, some literature points to an underinvestment effect given the regulation (Cambini & Rondi, 2012).
At the industry level, we control munificence and dynamism. Munificence is defined as the availability of resources and how the environment is compatible with stability or sustained growth (Sutcliffe, 1994). We first run a regression analysis of temporary sales trends; then, we calculate the quotient between the non-standardized regression coefficient and the mean of the dependent variable (revenues). A munificent environment provides opportunities for the organization to succeed, rather than operating in a hostile environment (Junquera et al., 2008).
Meanwhile, dynamism reflects an industry’s stability or instability and is a measure of sector turbulence (Aldrich, 2008; Dess & Beard, 1984). We use the transparency index variable at the country level, built based on the reverse of transparency data per country. We also control it by country risk. The model is as follows (Equation 2):
where:
DF ijt is the financial performance of company i in country j at time t, and is measured using ROA, ROE, and the EBITDA margin
Tang Actijt is the asset tangibility of company i in country j, at time t.
RLever ijt is the leverage of firm i in country j at time t.
Muni jt represents the munificence of sector x in country j at time t.
Dinam jt represents the dynamism of sector x in country j at time t.
ITrans jt refers to the reverse transparency index of country j at time t.
Stab_risk jt is the risk stability of country j at time t.
We use panel data with information for 12 years (from 2003 to 2014).
Results and discussion
This section is divided into three parts. The first contains the descriptive statistics of the variables of the study. The second contains the results of cluster analysis for both Colombia and America. Finally, the regression results are presented and analyzed for each cluster.
Descriptive statistics
We present the descriptive statistics of the main variables used in the analysis (See Table 3).
Table 3 Descriptive statistics
| Variable | Mean | Standard deviation | Min | Max |
|---|---|---|---|---|
| ROA | 0.0566 | 0.0646 | 0 | 0.7934 |
| ROE | 0.1484 | 0.1608 | 0 | 1 |
| Munificence | 0.0922 | 0.0831 | 0 | 0.3615 |
| Dynamism | 0.0605 | 0.0563 | 0 | 0.4203 |
| EBITDA margin | 0.1820 | 0.1636 | 0 | 0.9805 |
| Size | 5.0155 | 3.9316 | -7.0259 | 12.7642 |
| Asset tangibility | 0.7125 | 0.2541 | 0 | 0.9953 |
| Leverage | 0.5563 | 0.2104 | 0.0029 | 0.998 |
| Asset turnover | 1.3795 | 2.0722 | 0 | 14.864 |
| Current ratio | 1.2613 | 0.7037 | 0.0115 | 3.9837 |
| Risk stability | 4.0841 | 1.6036 | 0.0010 | 6.4160 |
| Transparency index | 0.0249 | 0.0055 | 0.0112 | 0.0529 |
Source: Own elaboration
In general, the variables do not reveal problems related to their stationarity. Exceptionally, the size and asset turnover variables show a reasonably high standard deviation, indicating differences in companies’ size and not an average asset turnover for all.
Cluster analysis
The clusters were grouped using size, asset turnover, and a current ratio of firms. The firm size was measured as an indicator of risk (Fama & French, 2002) and market power. Pure trading companies are generally small since companies involved in distribution, generation/production or transport require more significant amounts of investments in fixed assets.
Asset tangibility is related to company activity; mature and capital-intensive industries exhibit low asset turnover levels (Amat, 2001). A firm’s indebtedness level may be used as an indicator company risk in the energy sector. Previous studies on company decisions regarding indebtedness are related to company activity for reasons such as the volatility of income (Rajan & Zingales, 1995).
Asset turnover is the relationship between assets and sales and provides a way to measure a company’s operating efficiency. Companies with a high level of fixed assets usually exhibit low asset turnover levels, in contrast to trading companies, whose investment in fixed assets can quickly be recovered through revenues.
Finally, we used liquidity as the firm’s current ratio. This measure is related to performance as firms with better performance tend to produce high cash levels and vice versa (Irina & Nadezhda, 2009). Below are the results of cluster analysis.
Colombia: There are 195 companies in different activities and sectors such as electric energy, natural gas, and Liquefied Petroleum Gas (LPG) in our dataset (see Table 4).
Below are the averages of each variable per cluster (see Table 5).
Table 4 Distribution per sector and activity in 2014
| Sector/ Activity code | Electricity | Natural gas | LPG | Total |
|---|---|---|---|---|
| 1 | 18 | 9 | 21 | 48 |
| 2 | 40 | 21 | 36 | 97 |
| 3 | 32 | 5 | 1 | 38 |
| 4 | 4 | 8 | 0 | 12 |
| Total | 94 | 43 | 58 | 195 |
Note. 1: Companies that carry out marketing activities (wholesale and retail in the case of LPG). 2: Companies that carry out marketing activities- distribution, trading-distribution-generation, trading-distribution-generation-transmission, distribution-transport (in the case of natural gas). 3: Companies that carry out generation activities (production in the case of natural gas), generation-transmission (transport in the case of natural gas), trading-generation, trading-generation-transmission.4: Companies that carry out electricity transmission activities and transport of natural gas.
Source: Own elaboration
Table 5 Mean of the study variables per cluster for 2014
Source: Own elaboration
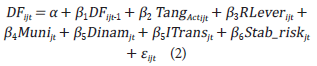
To better understand the cluster composition, we present a graphic representation of variables analyzed in each cluster (see Figure 2).
The first cluster (CG1) comprises 32 companies: in distribution (integrated with other activities), generation (integrated with other activities), and transmission or transport (integrated with other activities). Distributors in the energy and natural gas sectors are 58% (18 of 32) of this cluster, being the country’s largest distributors with an average size of 6.04 and an average asset turnover below 1. There are seven generators from the energy sector, with an average size of 6.14 and an average asset turnover below 1. Finally, this cluster includes three natural gas transporting companies and four electricity transmitting companies, with an excellent average of assets that goes up to 6.62 and an average asset turnover below 0.3.
These companies were the largest Colombian companies in 2014, with the lowest average asset turnover and a high capacity to cover their shortterm debts. The cluster gathers companies in the sectors intensive in fixed assets investments, implying low levels of asset turnover. These companies do not show liquidity problems with current ratios between 0 and 10, minimizing their risk of falling into illiquidity at some stage.
The second cluster (CG2) comprises 54 companies, 48 of them engaged in distribution and generation, integrated with another activity. The size of distributors is, on average, 3.47, larger than the size of generators (3.16); in both cases, asset turnover is below 2. Only three companies are energy traders, with an average of 2.85 and an asset turnover lower than 1. According to Table 5, this cluster includes companies with an average size of 3.35, asset turnover below 2, and the lowest liquidity, even though, on average, they can cover their short-term debts.
The third cluster (CG3) has 77 companies; 24 involved in trading, with an average size of 0.73 and turnover levels under 3. Fifty companies in this cluster are distribution or generation companies, integrated with another activity with similar average sizes (0.18 for distributors and 0.20 for generators). Most of these companies belong to the GLP2 and energy sectors that provide services in non-interconnected zones. Distributors are more efficient in asset turnover (levels below 3) than generators (levels below 1.5). Finally, the remaining three companies are small-scale natural gas transporters (average size 1.13) with an asset turnover below 1.4. This cluster has the highest current ratio.
Finally, the last cluster (CG4) has 33 companies; 21 are pure energy, natural gas, and GLP trading companies and electricity companies that operate in interconnected zones, with an average size of -0.61 and turnovers over 3 in all cases.
America: To build clusters, we use as reference the last year in our dataset (2014) with a total of 151 companies (see Table 6).
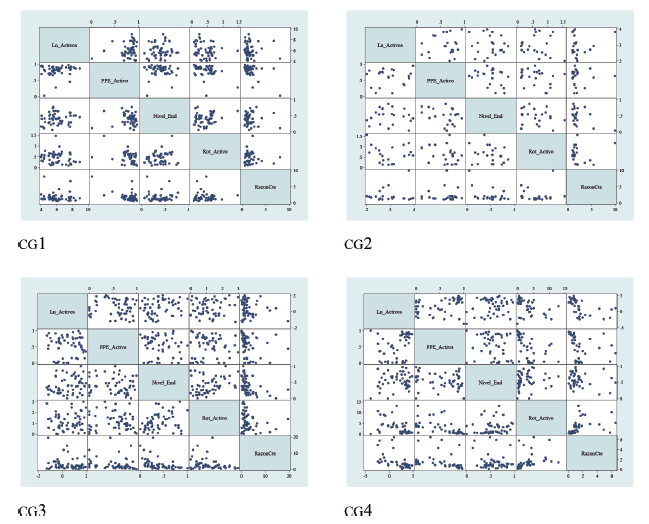
We also present a graphic representation of variables analyzed in each cluster (see Figure 3).
Table 6 Distribution of companies by sector and activity in 2014 for the American sample
| Activity/ Sector | Electricity | Natural gas | Oil and gas | Total |
|---|---|---|---|---|
| 1 | 14 | 1 | 9 | 24 |
| 2 | 69 | 29 | 4 | 102 |
| 3 | 14 | 9 | 2 | 25 |
| Grand total | 97 | 39 | 15 | 151 |
Note. 1: Companies that carry out activities related to distribution, distribution and trading, distribution and transmission, and distribution, trading, generation, and transmission.2: Companies that carry out activities related to generation, generation and trading, generation and distribution, generation, trading and distribution, generation trading and transmission, production and refinement, production, and trading. 3: Refers to Companies that carry out activities related to pure transmission or integrated with any of the production chain activities.
Source: Own elaboration
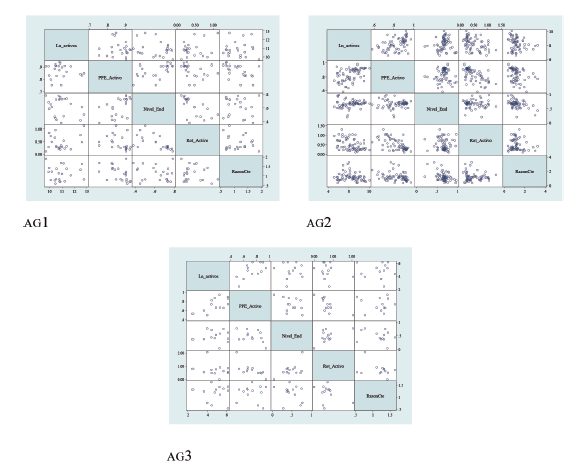
Cluster 1 (AG1) comprises 24 companies, 92% carrying out generation or production activities, integrated by any other activity. They had the highest level of assets in the entire sample. These companies are the largest, with low asset turnover, due to the high level of fixed assets (between 75 and 93%). They also have high levels of indebtedness that vary between 40 and 80% approximately. The current average ratio is lower than 2; then, companies in this cluster show a greater risk of not covering their obligations in the short term.
The second cluster (AG1) has 102 companies, 99% involved in generation or production activities integrated with any other activity, and distribution integrated with another activity. They are the sample’s medium-sized companies (see Figure 3). These medium companies have a low asset turnover and a greater capacity to cover their short-term debts (average current ratio of 2).
Finally, cluster 3 (AG3) has 25 companies, 80% involved in generation or production activities, integrated with any other activity, and 20% in distribution activities integrated with another activity. These companies are also the smallest in the sample from America. They have the most significant asset turnover level among all the companies in the sample, and low liquidity is represented by their low coverage of debts in the short term.
Econometric model
We use three different dependent variables as financial performance: ROA, ROE, and the EBITDA margin. These variables and the control variables are measured in time t, and we include one lag of the performance variables (t-1).
For each cluster, four models were run for each dependent variable. The first model contains the control variables exclusively and uses risk to the country level control variable. The second model adds lagged financial performance (t-1) to the previous model. The third model includes the control variables but changes the country level’s transparency index’s risk variable. Finally, the fourth model adds lagged financial performance (t-1) to the third one.
Table 7 presents the results of the regressions for Cluster 1. In the EBITDA margin as a dependent variable, the control variables are not significant in any cases, except the lagged EBITDA margin. As mentioned before, the EBITDA is associated more strongly with value creation than with performance (Bastidas Méndez, 2007). Then, probably this measure is not an adequate indicator of the company’s financial performance.
Therefore, we focus on the regressions with ROA and ROE as dependent variables. Regardless of the model analyzed, asset tangibility is statistically significant and negative, meaning that those with a greater percentage of fixed assets (usually the most significant) exhibit more earnings generation per each monetary unit invested. In the case of regulated companies, a greater volume of tangible assets allows them to access debt with lower costs if they have good collaterals; however, due to assets specificity of regulated companies, the quality of their collaterals becomes more deficient in this industry (Bortolotti et al., 2011). On the other hand, Loudder et al. (1996) consider that regulation of investments in utility companies makes the assets lose their realizable value once acquired, increasing the capital cost (Jorde et al., 2000).
The regression coefficients for asset tangibility show a negative sign and are significant in scale. To a substantial degree, the variable determines the results of company performance in this cluster, regardless of the performance measure employed.
Debt ratio affects both the companies’ asset profitability and equity profitability and has a positive and significant effect, consistent for all the models. Investor profitability improves as the debt increases, and this is consistent with the literature (Frank & Goyal, 2009) and in line with the findings by Jensen and Meckling (1976) since debt alleviates agency problems. This effect has also been documented in the literature related to regulated utility sectors (Cambini & Rondi, 2012; Guerrini et al., 2011).
The scale of the coefficients of debt ratio sheds light on the importance of this indicator’s performance. Although in the two models, the indicator loses statistical significance and economic importance. In any case, capital structure decisions cannot be left to chance as they are decisive in profitability for these types of companies and their stakeholders.
The munificence is significant for ROA and ROE as dependent variables. Profitability is more remarkable when they belong to sectors with a more significant growth perspective. This finding is in line with Baum and Wally (2003), who relate munificence, dynamism, formalization, and centralization to performance.
On the other hand, country risk has statistically significant coefficients; however, these coefficients’ scale is less relevant in explaining profitability. The positive sign indicates that huge companies in more demanding environments would be better paid for this risk, but the coefficient would indicate that the risk’s pay difference is not precisely higher in one environment than in another.
The reverse transparency value has a positive and significant effect on equity profitability, but not on company profitability. This indicator could be considered as the degree of opacity in the countries’ business environment. The higher it is, the lesser the information revealed by companies. Fan et al. (2008) studied the lack of transparency on company results. Environments with less transparency carry non-operating income (Fan et al., 2008). However, these studies only show evidence in the Chinese context. There is no clear evidence of such income for American markets.
Dynamism is not statistically significant in any of the models proposed. Volatility is not a determining factor for performance. Larger companies may be affected to a lesser extent by factors related to sector volatility (Comin & Phillipon, 2006).
Regarding the lagged variables, prior performance is an essential measure for the companies’ current management and results (Wall et al., 2004). Finally, for the companies in this cluster, the country risk variable is not a determining factor for performance. This finding is in line with market integration theory because the risk is diversified (Bekaert & Harvey, 2003), thus providing an opportunity for large-scale companies like the ones in this cluster.
In regressions for Cluster 2, the EBITDA margin as a dependent variable exhibits some statistically significant results (see Table 8). Regarding asset tangibility, these companies have fewer earnings generation per monetary unit invested in assets, which is the opposite for EBITDA margin; that is, more significant investments in fixed assets positively affect cash flow. This finding is intuitive, though the relationship can be endogenous. Provided that this study emphasizes performance measures, this variable is not instrumentalized.
The positive sign of the tangibility coefficient when using EBITDA as a dependent variable is because this measure is not sensitive to the composition or fluctuation of assets, while it is to the fluctuations in income (Rajan & Zingales, 1995). Hence, tangibility is strongly associated with efficiency (turnover) in determining performance. A greater volume of fixed assets negatively affects profitability.
When ROA is used as a dependent variable, the debt ratio shows a negative sign. Assets profitability diminishes as the company’s financial expenditures increase. The contrary effect occurs with equity profitability due to the fiscal shield of debt (Masulis & Trueman, 1988). For EBITDA margins, the greater the debt, the lesser the cash flow.
Maintaining a debt ratio over 50% seems to affect the firm’s profitability but is beneficial for the stakeholder. According to the trade-off theory (Leland & Toft, 1996), this debt ratio is recommendable for any company, if fiscal shields’ benefits adequately compensate for the greater default risk.
A munificent environment leads to greater profitability of assets or equity. One model using EBITDA margin shows a negative and statistically significant coefficient; it is financially insignificant due to the scale. In recent years, munificence in Colombia has decreased for the gas sector. Perhaps, because the market has reached a significant level of maturity, competence, and consolidation, constant monitoring must be undertaken to benefit strategic decision-making.
The more dynamic environments (those with the most significant volatility) negatively affect company and stakeholders’ profitability. According to the literature, the market recognizes a greater value for companies with fewer volatile flows, with a premium value (Bitner & Dolan, 1996).
In regressions for Cluster 3 (see Table 9), the EBITDA margin does not reveal any major effect beyond the already-mentioned importance of a munificent environment for company performance. On the other hand, the reverse transparency variable results for the country are significant, such as the lagged profitability. This last result is intuitive since greater profitability in the previous period may benefit companies’ current cash flows. This argument is tacitly proposed by Ljungqvist and Richardson (2003). However, for this analysis and the proposals of interest in this study, we will focus on the results of models, which use the dependent variables of profitability (ROA and ROE).
Like previous clusters, tangibility harms company profitability. However, its effect disappears for equity. As stated before, asset tangibility in the sector is high; thus, this is a crucial variable for fixed assets investment decisions.
Results for the debt ratio are like those from the previous cluster. Henceforth, decisions related to the capital structure are crucial to profitability regulated in America. According to trade-off theory, profitability improves with the indebtedness level. As a strategy, companies should reach the levels of debt proposed by the regulators. In this cluster, the companies do not benefit from a munificent environment (these coefficients are not statistically significant). It is difficult for these smaller companies to take advantage of the resources available in the environment.
Dynamism affects these companies, although not all models give statistically significant results. Country risk is a factor that affects company profitability negatively but is economically insignificant. However, since country risk refers to political risk stability, it implies that the more the political risk stability, the greater the profitability.
As expected, the smallest companies do not appear to benefit in any way from the revenues derived from non-transparent environments. These companies cannot build strong high-level relationships with institutions. Finally, lagged profitability is a constant factor. It is expected that the positive profitability obtained in the previous period wil positively impact the current period’s profitability, like negative results will adversely affect it.
Conclusions and recommendations
The clustering of American and Colombian companies with similar characteristics allowed us to identify the industry’s relevance and the size of these actors in Colombia, which is the focus of this study. In general, the largest companies in Colombia are like American medium size companies. Colombia does not have a company that can compare in size with the largest companies in America’s sector when considering only local operations. Also, this clustering can help us compare companies with similar characteristics, but whose profitability measures differ.
Three different variables were chosen as performance measures. However, in line with the literature, we can see that ROA and ROE seem to be the most suitable performance measures. The EBITDA margin, on the other hand, did not provide any statistically significant results. As pointed out previously, this is a measure of value creation, which may not be a good indicator of financial performance.
Among the determinants of financial performance, asset tangibility is statistically significant and financially relevant for large and medium companies. The companies in this sector make a considerable investment in fixed assets; thus, the negative sign of the regression result merits an interpretation that adjusts itself to regulated companies’ characteristics. As indicated, investment regulation may bring significant losses in the realization value of fixed assets and lead to an increase in capital cost for these companies.
One of the recommendations for American companies is to assess the investments in fixed assets in more detail to guarantee they will create value in the long term. Furthermore, the debt ratio is a determinant of financial performance for the companies that belong to the clusters of small and medium companies. If the performance measure analyzed is ROA, the indebtedness effect is negative, considering that the net company income diminishes as the financial expenditure increases. In the ROE case, the effect is the opposite due to the fiscal shield for the investors with substantial debts. Similarly, it is crucial to bear in mind that the debt allows a lower monitoring cost for investors, which alleviates problems derived from the principal-agent relations.
The munificent environment only affects medium-sized companies, which improve their financial performance as they have growth perspectives. Although the company cannot control this variable, its evolution needs to be continuously monitored.
The country’s political risk stability is significant for some models in medium and small companies. However, its statistical significance contrasts with its mathematically negligible scale, making it financially insignificant. The opposite happens with the countries’ reverse transparency, which significantly and positively affects large companies’ financial performance. However, it was established that environmental opacity, with low information disclosure levels, may lead to non-operating income. This study emphasizes that there is no evidence whatsoever for Colombian or even American companies. The literature presents concrete results for large companies in the East, but due to the differences in the contexts analyzed, it is impossible to extrapolate the results to the Colombian or American ones.
Besides, this measure is aggregated per country and does not refer to each company’s disclosure of information. The purpose of this variable is not to rate the corporate governance practices of the companies in Colombia or America; on the contrary, it points out the importance of maintaining current ethical codes and standards. Finally, the financial performance for the immediately preceding year has a positive and significant contemporary effect on the companies in all the clusters studied.
Table 7 Cluster 1 regression results
| Dependent variable: ROA | Dependent variable: ROE | Dependent variable: EBITDA margin | |||||||||
|---|---|---|---|---|---|---|---|---|---|---|---|
| Model 1 | Model 2 | Model 3 | Model 4 | Model 1 | Model 2 | Model 3 | Model 4 | Model 1 | Model 2 | Model 3 | Model 4 |
| Variable b/p | b/p | b/p | b/p | b/p | b/p | b/p | b/p | b/p | b/p | b/p | b/p |
| Tangt-.2398*** | -0.2024*** | -0.2011*** | -0.1944*** | -0.628*** | -0.381*** | -0.421*** | -0.360*** | -0.097 | -0.149** | -0.023 | 0.012 |
| [0.000] | [0.000] | [0.000] | [0.000] | [0.000] | [0.000] | [0.000] | [0.002] | [0.261] | [0.055] | [0.883] | [0.929] |
| RDebtt-0.1075*** | -0.0944*** | 0.0124 | 0.0003 | 0.2424*** | 0.163** | 0.247** | 0.213* | -0.268*** | -0.137** | -0.163 | 0.0164 |
| [0.000] | [0.000] | [0.981] | [0.995] | [0.005] | [0.039] | [0.04] | [0.072] | [0.001] | [0.08] | [0.316] | [0.909] |
| Munif0.1721*** | 0.1263*** | 0.1112*** | 0.1008*** | 0.249*** | 0.168** | 0.184** | 0.121 | -0.060 | -0.071 | 0.059 | -0.052 |
| [0.000] | [0.000] | [0.002] | [0.009] | [0.005] | [0.036] | [0.031] | [0.165] | [0.487] | [0.349] | [0.606] | [0.610] |
| Dynamism -0.0096 | -0.0168 | 0.0565 | 0.054 | -0.068 | -0.0635 | 0.152 | 0.129 | -0.046 | -0.060 | -0.127 | -0.010 |
| [0.741] | [0.549] | [0.162] | [0.185] | [0.477] | [0.456] | [0.109] | [0.167] | [0.621] | [0.46] | [0.325] | [0.929] |
| Country risk 0.00398*** | 0.0032*** | 0.0106*** | 0.008*** | -0.0001 | -0.00006 | ||||||
| [0.000] | [0.000] | [0.000] | [0.000] | [0.945] | [0.977] | ||||||
| Rev. Transpar | 3.3817 | 3.436 | 10.411** | 10.191** | 4.28 | 6.60 | |||||
| [0.128] | [0.123] | [0.047] | [0.047] | [0.545] | [0.285] | ||||||
| roat-1 | 0.2362*** | 0.0575 | 0.3001*** | 0.174** | 0.5064*** | 0.52*** | |||||
| [0.000] | [0.407] | [0.000] | [0.015] | [0.000] | [0.000] | ||||||
| Constant 0.2904*** | 0.2457*** | 0.1519* | 0.144* | 0.445* | 0.261** | 0.137 | 0.093 | 0.528*** | 0.356*** | 0.345 | 0.042 |
| [0.000] | [0.000] | [0.069] | [0.087] | [0.000] | [0.014] | [0.482] | [0.627] | [0.000] | [0.001] | [0.193] | [0.858] |
| Obs. 337 | 332 | 154 | 154 | 337 | 332 | 154 | 154 | 337 | 332 | 154 | 154 |
| R-squared overall model | 0.5866 | 0.1856 | 0.2184 | 0.2924 | 0.4745 | 0.0641 | 0.1278 | 0.0479 | 0.5052 | 0.019 | 0.4648 |
Note. P-value between brackets. (***): Significant at 1%, (**): Significant at 5%, (*): Significant at 10%.
Source: Own elaboration
Table 8 Cluster 2 regression results
| Dependent variable: ROA | Dependent variable: ROE | Dependent variable: EBITDA margin | ||||||||||
|---|---|---|---|---|---|---|---|---|---|---|---|---|
| Model 1 | Model 2 | Model 3 | Model 4 | Model 1 | Model 2 | Model 3 | Model 4 | Model 1 | Model 2 | Model 3 | Model 4 | |
| Variable | b/p | b/p | b/p | b/p | b/p | b/p | b/p | b/p | b/p | b/p | b/p | b/p |
| Tangt | -0.100*** | -0.081*** | -0.087*** | -0.078*** | -0.248*** | -0.2230*** | -0.219*** | -0.207*** | 0.107*** | 0.057** | 0.072 | 0.049 |
| [0.000] | [0.000] | [0.000] | [0.001] | [0.000] | [0.000] | [0.001] | [0.002] | [0.002] | [0.086] | [0.21] | [0.401] | |
| RDebtt | -0.100*** | -0.082*** | -0.073*** | -0.058*** | 0.143*** | 0.136**] | 0.234*** | 0.206*** | -0.208*** | -0.149*** | -0.182*** | -0.136*** |
| [0.000] | [0.000] | [0.009] | [0.001] | [0.000] | [0.000] | [0.000] | [0.000] | [0.000] | [0.000] | [0.000] | [0.001] | |
| Munif | 0.08*** | 0.063*** | 0.040** | 0.037** | 0.206*** | 0.216*** | 0.156*** | 0.156*** | 0.031 | -0.018*** | 0.724* | 0.0409 |
| [0.000] | [0.000] | [0.027] | [0.037] | [0.000] | [0.000] | [0.0023] | [0.001] | [0.322] | [0.539] | [0.091] | [0.339] | |
| Dynamism | 0.0029 | -0.000023 | -0.061*** | -0.065*** | -0.060 | -0.06 | -0.171*** | -0.199** | -0.035 | 0.064** | -0.038 | -0.051 |
| [0.841] | [0.999] | [0.008] | [0.004] | [0.132] | [0.136] | [0.007] | [0.001] | [0.365] | [0.078] | [0.488] | [0.344] | |
| Country risk | -0.0004 | -0.00009 | -0.0016 | -0.0012 | -0.007*** | -0.006*** | ||||||
| [0.34] | [0.833] | [0.153] | [0.338[ | [0.000] | [0.000] | |||||||
| Rev. Transpar | 2.07*** | 2.22*** | 2.531 | 4.197** | 8.386*** | 9.1602*** | ||||||
| [0.006] | [0.003] | [0.216] | [0.035] | [0.000] | [0.000 ] | |||||||
| roat-1 | 0.222*** | 0.128*** | 0.037*** | 0.1122*** | 0.311*** | 0.114*** | ||||||
| [0.000] | [0.000] | [0.000] | [0.000Α | [0.000] | [0.000] | |||||||
| Constant | 0.194*** | 0.155*** | 0.13*** | 0.103*** | 0.247*** | 0.228*** | 0.128* | 0.083 | 0.323*** | 0.244*** | 0.105* | 0.058 |
| [0.000] | [0.000] | [0.000] | [0.000] | [0.000] | [0.000] | [0.082] | [0.251] | [0.000] | [0.000] | [0.10] | [0.375] | |
| Obs. | 2399 | 2268 | 1095 | 1074 | 2399 | 2266 | 1095 | 1074 | 2399 | 2276 | 1095 | 1075 |
| R-squared overall model | 0.178 | 0.3415 | 0.0945 | 0.1908 | 0.104 | 0.1426 | 0.1055 | 0.215 | 0.0322 | 0.4823 | 0.0056 | 0.0087 |
Note. P-value between brackets. (***): Significant at 1%, (**): Significant at 5%, (*): Significant at 10%.
Source: Own elaboration
Table 9 Cluster 3 regression results
| Dependent variable: ROA | Dependent variable: ROE | Dependent variable: EBITDA margin | ||||||||||
|---|---|---|---|---|---|---|---|---|---|---|---|---|
| Model 1 | Model 2 | Model 3 | Model 4 | Model 1 | Model 2 | Model 3 | Model 4 | Model 1 | Model 2 | Model 3 | Model 4 | |
| Variable | b/p | b/p | b/p | b/p | b/p | b/p | b/p | b/p | b/p | b/p | b/p | b/p |
| Tangt | -0.0336*** | -0.038*** | -0.021* | -0.027** | -0.0144 | -0.0127 | -0.003 | 0.002 | -0.0125 | -0.03 | -0.013 | -0.033 |
| [0.005] | [0.002] | [0.096] | [0.035] | [0.627] | [0.668] | [0.91] | [0.947] | [0.564] | [0.168] | [0.590] | [0.156] | |
| RDebtt | -0.076*** | -0.069*** | -0.042*** | -0.045*** | 0.199*** | 0.178*** | 0.267*** | 0.225*** | -0.038 | -0.036 | -0.0316 | -0.029 |
| [0.000] | [0.000] | [0.005] | [0.004] | [0.000] | [0.000] | [0.000] | [0.000] | [0.119] | [0.147] | [0.266] | [0.31] | |
| Munif | -0.020 | -0.026 | 0.017 | 0.018 | -0.0161 | -0.0117 | 0.075 | 0.094 | 0.0114 | -0.004 | 0.094** | 0.0833* |
| [0.373] | [0.265] | [0.492] | [0.474] | [0.773] | [0.836] | [0.213] | [0.12] | [0.779] | [0.92] | [0.045] | [0.076] | |
| Dynamism | 0.0306 | 0.036 | 0.065** | 0.077** | 0.082 | 0.0853 | 0.127* | 0.146* | -0.077 | -0.086* | -0.007 | 0.0146 |
| [0.279] | [0.211] | [0.04] | [0.021] | [0.239] | [0.232] | [0.101] | [0.06] | [0.13] | [0.097] | [0.904] | [0.807] | |
| Country risk | -0.005** | -0.007** | -0.0086 | -0.0132* | 0.0045 | 0.0087* | ||||||
| [0.028] | [0.014] | [0.122] | [0.071] | [0.259] | [0.103] | |||||||
| Rev. Transpar | 1.628 | 1.495 | 2.03 | 1.962 | 6.832*** | 5.3672** | ||||||
| [0.172] | [0.218] | [0.482] | [0.491] | [0.002] | [0.014] | |||||||
| ROAt1 | 0.113*** | 0.065*** | 0.009*** | 0.008*** | 0.029*** | 0.0803*** | ||||||
| [0.007] | [0.007] | [0.001] | [0.001] | [0.001] | [0.000] | |||||||
| Constant | 0.148*** | 0.149*** | 0.052 | 0.054 | 0.106*** | 0.129*** | -0.032 | -0.021 | 0.155*** | 0.1436*** | -0.0378 | -0.002 |
| [0.000] | [0.000] | [0.12] | [0.110] | [0.002] | [0.001] | [0.685] | [0.791] | [0.000] | [0.000] | [0.544] | [0.972] | |
| Obs. | 1604 | 1513 | 1339 | 1288 | 1604 | 1513 | 1339 | 1288 | 1604 | 1518 | 1339 | 1281 |
| R-squared overall model | 0.0727 | 0.1944 | 0.0327 | 0.1496 | 0.1285 | 0.1485 | 0.1665 | 0.1845 | 0.0226 | 0.0966 | 0.004 | 0.0428 |
Note. P-value between brackets. (***): Significant at 1%, (**): Significant at 5%, (*): Significant at 10%.
Source: Own elaboration

