


 Inglês (pdf)
 Artigo em XML
 Referências do artigo
 Enviar este artigo por email
 Citado por SciELO
  Citado por Google
  Similares em
SciELO
Similares em
SciELO  Similares em Google
 Permalink
Initial considerations
National and international literature that addresses the population's occupation in the labor market is broad and relatively convergent regarding individual characteristics for getting and keeping a job and being compensated for it (Bivar, 1993; Cacciamali, 1992; Corbacho, 2002; Corseuil et al., 2002a, 2002b; Freije, 2001; Funkhouser, 1996; Jatobá & Andrade, 1993; Marcouiller et al., 1997; Márquez & Pages, 1998; Orellano & Pazello, 2006; Ribeiro, 2001). Personal attributes are determining factors for occupation in the labor market and have a substantial importance in compensation and keeping a job (Barros et al., 2007; Biderman & Guimarães, 2002; Bohnenberger, 2005; Crespo & Reis, 2004; Kassouf, 1998; Oliveira & Rios-Neto, 2006; Soares, 2000).
Individual characteristics must be dealt with, but exogenous attributes must be also considered since the region of residence has a substantial impact on occupation, especially in countries with a markedly heterogeneous geographical spaces (Carvalho et al., 2006; da Silva Filho & Clementino, 2013; Fiess & Verner, 2003; Graham, 1970; da Silva Filho et al., 2015; Soares, 2000). Thus, the regions' economic development levels, interpreted from heterogeneous labor markets, are critical exogenous factors for individuals' occupation (Barros et al., 2007; Freguglia & Procópio, 2013).
Issues related to population mobility may also explain occupation. The migration dynamics in developing countries are markedly high, with records of people leaving poor areas to become migrants in economically richer regions in a process of migratory selectivity (Bastos, 2014; Ribeiro & Bastos, 2004). It should be considered that population's socioeconomic and demographic characteristics are also important determining factors of labor income. Both national and international literature recognize that labor income is directly correlated to individuals' personal and regional attributes (Leal & Werlang, 1991; Menezes-Filho, 2001; Ramos & Trindade, 1992).
Individual attributes, such as race/color, gender, schooling, age, and regional characteristics, such as the location of jobs in highly or poorly developed areas, determine income differences and occupation of the workforce (Barros et al. 2007; Carvalho et al., 2006; Soares, 2000). In developing countries, with a large share of people in the working-age population (WAP), it is even more accentuated. The workforce's individual (race/ color, gender, age, among others) and subjective characteristics (enthusiasm, ambition, persistence, among others) in the labor market are important determining factors for getting and keeping a job (Lima et al., 2011).
Another vital issue to be highlighted is the full mobility of people in the internal labor market. Economic literature shows that with the perfect replacement of the workforce in the labor market, population mobility becomes a determining factor in the occupation of a country's WAP (Green et al., 2001; Lewis, 1969; Taylor, 1999). Thus, the migration of people looking for a job or better working conditions aggravates competition in the labor market and increases unemployment rates.
People's mobility must be considered in studies that seek to observe population's occupation, especially its exogenous aspects. One hypothesis to be studied is that a person's insertion in the labor market depends not only on individual productive attributes, such as age and schooling, but also on unobservable factors associated with migration, such as attitudes, determination, or social networks.
Migratory dynamics, especially in countries with accentuated spatial economic heterogeneity, is primarily motivated by the search for better socioeconomic insertion conditions (Fiess & Verner, 2003; Ribeiro & Bastos, 2004). The performance level of migrants in the labor market is one of the main factors for people moving from one region to another (Maciel & Hermeto, 2011). Economic activities define the employment level of the workforce. The workforce's characteristics are often causal elements of job retention (Barros et al., 2007; Carvalho et al, 2006).
Exogenous issues have a more significant impact on attracting workforce from poorer areas. The selection of workforce and the migrant's occupation is mainly driven by the individual and production characteristics of destination sites (Gama & Machado, 2014; Lima et al, 2011; Maciel & Hermeto, 2011; Ramalho, 2005). The workforce's performance is a necessary condition for job retention when it comes to a labor market predominantly composed of workers with a formal contract. Hence, individual issues end up having exceptional importance in the labor market.
Thus, this paper seeks to analyze the occupation of the Brazilian WAP, considering people's mobility (i.e., internal migration) as a vital observation variable. The WAP'S occupation is analyzed based on socioeconomic and demographic characteristics, comparing migrants and non-migrants. To achieve the objective, the paper is structured as follows: besides these initial considerations, the second section seeks to highlight the methodological procedures used. The third section reviews the literature on the labor market and occupation of the WAP in Brazil. The fourth section presents the results and discussions from the empirical approach. Lastly, some final considerations and limitations of this paper are weighed.
Methodological procedures
This paper seeks to analyze the occupation of the country's WAP comparatively between Brazilian inter-municipal migrants and non-migrants aged 15 to 60 years.1 This objective is justified by relevant studies on inter-municipal migrations since, in comparing their dynamics, we can establish new country migration patterns
Recent changes in Brazilian socioeconomic structures are perceptible territorially and locally. Therefore, we aim to address the occupation of migrants and non-migrants at the municipal level (studying and working, only working, unemployed, or only studying).
The Brazilian WAP is used as a sample size, that is, people aged between 15 and 60 years. The choice of this age range follows some criteria adopted for the scope of this paper. People aged 15 and up are considered of working age and with potential to be employed. It is still relevant to analyze the WAP in studies of the labor market in Brazil given that, in the legal regulatory framework, young apprentices can be hired from the age of 14. Besides, the population aged 15-17 reached approximately 10 % in 2000 and approximately 8 % in 2010 between migrants and non-migrants. This age group is, therefore, considerable.
About the people aged 60 years and not 65, the objective was to exclude from the sample all the retired population living in rural areas per the criteria used in this paper. The database covers the entire Brazilian population, and the male population (the majority employed) over the age of 60 is substantial in small municipalities across the country. This age group was not included in the sample to avoid distortions in the results.
In this paper, the sample consists of 11,237,214 and 10,182,483 migrants and 94,880,976 and 115,600,089 non-migrants in 2000 and 2010, respectively. The number of people aged 15 to 60 years was distributed across the national territory.
Database
The database used is the microdata of the sample of Brazilian Demographic Censuses for 2000 and 2010 (Instituto Brasileiro de Geografia e Estatística [IBGE], 2000, 2010). We sought to make all variables used in this study compatible to compare information over the years. All the variables are comparable in both censuses, without losing any information or information substance. The years 2000 and 2010 were chosen since the Brazilian Demographic Census takes place every ten years. For the disaggregation level of this research, these censuses are the best sources of data.
To perform the analysis, microdata of both censuses were used as a database. So, all variables were put together at the same level so that the information could be comparable over the years.
Empirical model
Multinomial logistic regressions are commonly used in this type of study. In this model, individuals (i) have j choices and end up making the choices in which their utility functions will be maximized.
In this paper, individuals have choices represented by a categorical variable with five possibilities, namely:
i) The individual studies and works;
ii. ) The individual is inactive (not looking for a job);
iii. ) The individual only works;
iv. ) The individual is unemployed;
v. ) The individual only studies.
The choice of the empirical model based on the list above was because the research interest is to capture the categorical effects of occupation on active individuals, taking those inactive as a control category, compared to other categories central to this analysis. The migrant population that works and studies, only works, only studies, or is unemployed is the primary interest since migration and insertion into the labor market is the subject matter of this research.
When the individual only studies, they are classified neither as employed nor as unemployed. However, if the person is unemployed and studies, he is classified as unemployed; that is, the classification "unemployed" overlaps "only studies." The control category is ii= inactive population given that all other categories are related to preparation (study) and occupation in the labor market.
Luce (1959) proposed the multinomial logit model to compare two categories simultaneously. Thus, a dependent variable y takes j categories (j = 1, 2, 3, J) to compare the contrasting category in this distribution (j > 1) with a control category (j = 1). It must be emphasized that probability will always be associated with a category among probable answers (p i1 , pi2, pi3,…, pij -, which will represent the probability of an individual i belonging to a specific category j.
Thus, logit multinomial model gives the individual i the probability of choosing category j among probabilities. In this case, the mathematical expression representing the chosen probability canbe Equation 1.
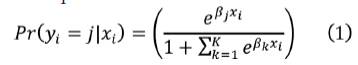
If (j = 1,3,4,5) and (β = j), then it is considered that the ( j = 2) category was taken as a control in the research. The sum of the probabilities obtained must equal the unit. It should be noted that the parameter estimation process uses the maximum likelihood method. As a result, coefficients (β 1 , β 2, β 3, ..., β j ) exhibit relative changes in the probabilities. These changes come from a unitary variation (when all other variables remain constant) in any of the explanatory variables, and they always occur in relation to the control category. Equation can also be expressed by linear Equation.
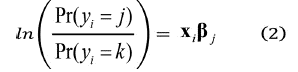
According to the literature, the interpretation of coefficient results of multinomial logistic regression is rarely used (Maia & Sakamoto, 2015). The dependent variable of Equation is the natural logarithm of the probability of success of a choice and the probability of success of the control category (k). This variable is also called log-odds or logit.
In these terms, the results express how often the chances of success are higher than the chances of failing. Coefficient β expresses logit variation for regression unit variation in each regression X of interest, keeping constant other variables of the model to obtain the direct relationship between the unit variation of X h and the odds ratio variation, that is, the success chances of both X categories. The antilogarithm of β h is calculated, that is, e βh . The results become interpretable by the chances of choosing one category j in relation to another category.
Theoretical considerations on the labor market and migration dynamics
Brazilian macroeconomic transformations in the 1990s were substantial and had important repercussions on the new situation of the labor market. The national production restructuring process and the reorganization of economic activities in the territory reinforced important changes in the employment and occupation profile of the Brazilian population. Besides, in an important movement of the national production configuration from economically more developed regions to the other ones, especially the Brazilian Northeast, the displacement of industrial plants was accentuated and impacted production and employment in peripheral regional economies2 (Cacciamali, 1992; Corseuil et al., 2002a, 2002b; Orellano & Pazello, 2006).
Labor-intensive activities were the main production plants that moved in search of cheap labor and fiscal incentives (Ferreira & Diniz, 1995; Pacheco, 1999). These transformations have impacted people's movement from one region to another in search for employment and might even have reduced population flows from poor to richer regions. Thus, Brazil's economic reconfigurations, caused by the liberalization and restructuring of the economy, are also responsible for the new configurations of the labor market and migratory dynamics of the WAP in the 2000s.
The higher employment level coupled with the transformations in the Brazilian labor market and income distribution with a recent fall in inequality may also have impacted migratory dynamics (Hoffmann, 2009, 2017; Maia, 2006; Maia & Quadros, 2009). Following Dustmann and Glitz's (2011) interpretation that individuals migrate either because they are forced or because of prospects for socioeconomic improvements in other regions, people's exit may be reduced as the region of origin tends to improve economically. Consequently, transformations in production structures coupled with the recent fall in income inequality and conditional transfers (Gama, 2012; Gama & Machado, 2014) may have corroborated a reduction in migratory flows in Brazil.
The reduction of migratory flows may be directly related to the performance of socioeconomic indicators in Brazil during the 2000s. These indicators can result from production deconcentration, given by the trade liberalization and production restructuring in the 1990s and the stabilization of the economy. Then, the State's public accounts could be restructured, giving it greater capacity to design and maintain distributive policies.
In the labor market, unemployment rates were relatively low, and there was a greater insertion of the labor force with formal ties throughout the 2000s. Therefore, the employment level of the WAP increased substantially in those years, registering low unemployment rates in the inter-census period. Several studies show that inequality between various socioeconomic groups in the labor market has been substantially reduced over the years (Corseuil et al., 2002a, 2002b; Orellano & Pazello, 2006; da Silva Filho, 2016).
Accordingly, it is vital to observe activity and occupation, that is, how they are inserted in the labor market and how the differences between employed migrants and non-migrants in the Brazilian labor market remain. Considering activity, particularly income, it may reflect socioeconomic issues that are less usual in studies about Brazilian migrant conditions in destination regions in recent years.
Occupation of migrant and non-migrant populations in Brazilian municipalities
One of the issues related to labor market studies is the analysis of Brazilian population's occupation. Unemployment or precarious work affects population groups that are, according to national and international literature, universal in developed or developing economies. Unemployment often affects young people, the elderly, women, and black people in a markedly greater scale than other population groups. These demographic characteristics corroborate discrimination in the labor market, even when socioeconomic characteristics are alike (Corbacho, 2002; Freije, 2001; Funkhouser, 1996; Marcouiller et al., 1997; Márquez & Pages, 1998): they have the same schooling levels, work in the same economic activities, and carry out their functions in similar jobs (Gama & Machado, 2014).
Labor market disparities are universally associated with the individuals' socioeconomic and demographic characteristics (Corseuil, 1999; Corseuil et al, 1997) and are not only a problem of peripheral economies. However, empirical studies show a reduction in the inequality of opportunities in and access to the Brazilian labor market. There are still marked disparities (Barros et al., 2007; Carvalho et al., 2006; Soares, 2000) such as pay gap and, unequal unemployment rates by population groups, being the youth, the elderly, the black people, and women the most affected during cyclical and low employment periods (Lavinas, 1997; Wajnman & Perpétuo, 1997).
As shown in Table 1, it is possible to perceive the inequality in the Brazilian labor market when it refers to the occupation condition between migrants and non-migrants. According to Demographic Censuses data for 2000 and 2010, unemployment rates increased more among migrants than non-migrants in both years. In 2000, 11.3 % of migrants and 10.4 % of working-age non-migrants were unemployed; the difference is approximately one percentage point in both years. Although there is almost a halving in unemployment rates from 2000 to 2010 for both groups, as unemployment reached 6.3 % migrants and 5.4 % non-migrants in 2010, migrants are relatively more affected by unemployment than non-migrants.
Table 1 Total people aged 15-60 according to occupation in Brazilian municipalities, 2000/2010
| Occupation | 2000 | 2010 | ||||||
|---|---|---|---|---|---|---|---|---|
| Migrant | Non-migrant | Migrant | Non-migrant | |||||
| Total | % | Total | % | Total | % | Total | % | |
| Working and studying | 842.010 | 7.5 | 7.384.938 | 7.8 | 874.915 | 8.6 | 9.861.186 | 8.5 |
| Only working | 5.708.038 | 50.8 | 47.929.971 | 50.5 | 5.748.708 | 56.5 | 64.220.181 | 55.6 |
| Only studying | 782.381 | 7.0 | 8.081.860 | 8.5 | 799.749 | 7.9 | 10.348.396 | 9.0 |
| Unemployed | 1.273.312 | 11.3 | 9.879.204 | 10.4 | 640.547 | 6.3 | 6.217.534 | 5.4 |
| Inactive | 2.631.472 | 23.4 | 21.605.003 | 22.8 | 2.118.564 | 20.8 | 24.952.791 | 21.6 |
| Total | 11.237.213 | 100 | 94.880.976 | 100 | 10.182.483 | 100 | 115.600.088 | 100 |
Source: Own elaboration based on IBGE (2000, 2010).
Considering the share of migrants who work and study, only 7.5 % of them were in this condition in 2000, compared to 7.8 % of non-migrants. In 2010, they increased to 8.6 and 8.5 % for migrants and non-migrants, respectively. As to the student condition, the difference is more accentuated: while 7.0 % of migrants were studying, 8.5 % of non-migrants only studied in 2000. In 2010, 7.9 % of migrants only studied while 9.0 % of non-migrants were in this condition. In other words, the situation was more favorable to non-migrants compared to migrants in the same years because Brazilian migrants need to enter the labor market to the detriment of their studies,3 given that the main factor of migration is labor insertion.
About the only working option, the data show that the percentage of migrants was 50.8 % in 2000 and 56.5 % in 2010. Non-migrants who were only working were 50.5 % in 2000 and 56.6 % in 2010.
Also, in 2000, the share of inactive migrants was higher than that of non-migrants. In 2010, this relative share was reversed, and the number of inactive non-migrants was relatively larger than migrants in the same condition. There is a higher prevalence of unemployed and inactive migrants to the detriment of student participation in the WAP.
Table 2 presents the mean values of each variable in both years under analysis. The male variable is the control category and takes a value of 1 for men and 0 for women. For the age variable, the control category is the first range, namely, 15 years. The Grau1 variable refers to people with completed high school. The white variable takes the control category and receives a value equal to 1 for whites and 0 for black population. The urban variable refers to people who live in an urban area of a municipality in Brazilian territory; thus, it takes a value equal to 1 for residents of urban areas and 0 for the opposite. The rendadompc variable takes per capita household income for non-migrants and migrants in 2000 and 2010. Finally, the region variable takes NO for residents of the northern region, NE for residents of the Northeast, SE for residents of the Southeast, SU for residents of the South, and CO for residents of the Midwest region of Brazil.
Table 2 Descriptive statistics of variables used (proportions for binaries and R$ for per capita household income),
| Control variable | 2000 | 2010 | ||
|---|---|---|---|---|
| Non-migrant | Migrant | Non-migrant | Migrant | |
| Mean | Mean | Mean | Mean | |
| Male | 0.491 | 0.488 | 0.489 | 0.498 |
| Aged 15-17 | 0.102 | 0.094 | 0.083 | 0.074 |
| Aged 18-24 | 0.214 | 0.269 | 0.184 | 0.252 |
| Aged 25-34 | 0.247 | 0.304 | 0.255 | 0.329 |
| Aged 35-44 | 0.217 | 0.194 | 0.216 | 0.191 |
| Aged 45-54 | 0.154 | 0.103 | 0.180 | 0.112 |
| Aged 55-60 | 0.065 | 0.036 | 0.081 | 0.043 |
| Grau1 | 0.440 | 0.443 | 0.587 | 0.631 |
| White | 0.545 | 0.551 | 0.484 | 0.497 |
| Urban | 0.826 | 0.844 | 0.854 | 0.868 |
| Rendadompc | 646.142 | 706.678 | 814.097 | 1.004.094 |
| NO | 0.068 | 0.086 | 0.078 | 0.090 |
| NE | 0.272 | 0.220 | 0.274 | 0.220 |
| SE | 0.444 | 0.417 | 0.433 | 0.398 |
| SU | 0.149 | 0.168 | 0.143 | 0.178 |
| CO | 0.066 | 0.109 | 0.072 | 0.114 |
Source: Own elaboration based on IBGE (2000, 2010).
According to the data, in 2000, 49 % of migrants were male, 30 % of them aged 25-34 years and received primary education (elementary school) (44 %). Fifty-five percent of migrants were white, 84 % lived in urban areas, and had a household income of R$706,678, Twenty-two percent resided in the Northeast region and 42 % in the Southeast. Meanwhile, non-migrants were 49 % of the male population, 25 % of them aged 25-34, 55 % were white; 83 % lived in urban areas and had a household income of R$646,142. Forty-four percent of non-migrants resided in the Southeast and 27 % in the Northeast.
In 2010, 50 % of migrants were male, 33 % of them aged 25-34 years, 63 % had completed primary education, 50 % were white, 87 % lived in urban areas, and had a household income of R$1004.09. Twenty-two percent of inter-municipal migrants resided in the Northeast and 40 % in the Southeast. Non-migrants were approximately 49 % male, 26 % of them aged 25-34 years, 59 % had completed primary education, approximately 48 % were white, 85 % lived in an urban area, and had a household income of R$810.00. Besides, approximately 44 % of the non-migrant population resides in the Southeast region, and 27 % in the Northeast region.
Based on the evidence above, fixed-date inter-municipal migrants did relatively worse off than non-migrants in both years. Put differently, they experience higher unemployment rates, have a smaller relative share in the only studying group, and still have a lower household income than non-migrants in both years.
Results and discussions
Tables 3 to 6 present the maximum likelihood estimates for the multinomial logistic regression model (Equation 2). The control category is inactivity. That is, coefficients indicate a higher propensity of the male population to work and study (Table 3), only work (Table 4), only study (Table 5), or be unemployed (Table 6) compared to the control category (being inactive).
Table 3 Estimated results of multinomial Logit model for the working and studying option, 2000/2010
| Parameters | Working and studying | |||||
|---|---|---|---|---|---|---|
| 2000 | 2010 | |||||
| Estimates | Standard Error | Pr ChiSq | Estimates | Standard Error | Pr ChiSq | |
| Intercept | -2.537 | 0.002 | < 0.0001 | -4.392 | 0.002 | <0.0001 |
| Migra | -0.319 | 0.001 | < 0.0001 | -0.295 | 0.001 | < 0.0001 |
| Male | 1.742 | 0.000 | < 0.0001 | 1.169 | 0.000 | < 0.0001 |
| Aged 18-24 | -0.915 | 0.001 | < 0.0001 | -0.942 | 0.001 | < 0.0001 |
| Aged 25-34 | -1.763 | 0.001 | < 0.0001 | -1.306 | 0.001 | < 0.0001 |
| Aged 35-44 | -2.400 | 0.001 | < 0.0001 | -1.727 | 0.001 | < 0.0001 |
| Aged 45-54 | -3.641 | 0.002 | < 0.0001 | -2.669 | 0.001 | < 0.0001 |
| Aged 55-60 | -4.969 | 0.004 | < 0.0001 | -3.831 | 0.002 | < 0.0001 |
| Grau1 | 1.253 | 0.001 | < 0.0001 | 0.682 | 0.000 | < 0.0001 |
| White | -0.213 | 0.000 | < 0.0001 | -0.074 | 0.000 | < 0.0001 |
| ln_renda | 0.438 | 0.000 | < 0.0001 | 0.763 | 0.000 | < 0.0001 |
| Urban | -0.123 | 0.001 | < 0.0001 | -0.271 | 0.001 | < 0.0001 |
| NO | -0.181 | 0.002 | < 0.0001 | 0.107 | 0.001 | < 0.0001 |
| SE | -0.461 | 0.001 | < 0.0001 | -0.146 | 0.001 | < 0.0001 |
| SU | -0.140 | 0.001 | < 0.0001 | 0.049 | 0.001 | < 0.0001 |
| CO | -0.108 | 0.002 | < 0.0001 | 0.031 | 0.001 | < 0.0001 |
Source: Own elaboration based on IBGE (2000, 2010).
Table 4 Results of multinomial Logit model estimates for the only working option, 2000/2010
| Parameters | Only working | |||||
|---|---|---|---|---|---|---|
| 2000 | 2010 | |||||
| Estimates | Standard Error | Pr > ChiSq | Estimates | Standard Error | Pr > ChiSq | |
| Intercept | -3.081 | 0.002 | < 0.0001 | -4.592 | 0.003 | <0.0001 |
| Migra | -0.128 | 0.001 | < 0.0001 | -0.095 | 0.001 | <0.0001 |
| Male | 2.094 | 0.001 | < 0.0001 | 1.534 | 0.001 | <0.0001 |
| Aged 18-24 | 0.972 | 0.002 | < 0.0001 | 1.294 | 0.001 | <0.0001 |
| Aged 25-34 | 1.396 | 0.002 | < 0.0001 | 1.867 | 0.002 | <0.0001 |
| Aged 35-44 | 1.403 | 0.002 | < 0.0001 | 1.929 | 0.002 | <0.0001 |
| Aged 45-54 | 0.758 | 0.002 | < 0.0001 | 1.415 | 0.002 | <0.0001 |
| Aged 55-60 | -0.114 | 0.002 | < 0.0001 | 0.514 | 0.002 | <0.0001 |
| Grau1 | 0.433 | 0.001 | < 0.0001 | 0.356 | 0.001 | <0.0001 |
| White | -0.197 | 0.001 | < 0.0001 | -0.123 | 0.001 | <0.0001 |
| ln_renda | 0.405 | 0.000 | < 0.0001 | 0.599 | 0.000 | <0.0001 |
| Urban | -0.287 | 0.001 | < 0.0001 | -0.313 | 0.001 | <0.0001 |
| NO | -0.095 | 0.001 | < 0.0001 | 0.062 | 0.001 | <0.0001 |
| SE | -0.094 | 0.001 | < 0.0001 | 0.065 | 0.001 | <0.0001 |
| SU | 0.169 | 0.001 | < 0.0001 | 0.289 | 0.001 | <0.0001 |
| CO | -0.007 | 0.001 | < 0.0001 | 0.151 | 0.001 | <0.0001 |
Source: Own elaboration based on IBGE (2000, 2010).
Table 5 Results of multinomial Logit model estimates for the only studying option, 2000/2010
| Parameters | Only studying | |||||
|---|---|---|---|---|---|---|
| 2000 | 2010 | |||||
| Estimates | Standard Error | Pr > ChiSq | Estimates | Standard Error | Pr > ChiSq | |
| Intercept | -0.033 | 0.002 | < 0.0001 | 0.669 | 0.002 | < 0.0001 |
| Migra | -0.472 | 0.002 | < 0.0001 | -0.319 | 0.002 | < 0.0001 |
| Male | 0.936 | 0.001 | < 0.0001 | 0.567 | 0.001 | < 0.0001 |
| Aged 18-24 | -2.233 | 0.001 | < 0.0001 | -2.379 | 0.001 | < 0.0001 |
| Aged 25-34 | -4.091 | 0.001 | < 0.0001 | -3.804 | 0.002 | < 0.0001 |
| Aged 35-44 | -4.896 | 0.003 | < 0.0001 | -4.398 | 0.002 | < 0.0001 |
| Aged 45-54 | -5.578 | 0.003 | < 0.0001 | -4.836 | 0.002 | < 0.0001 |
| Aged 55-60 | -5.929 | 0.005 | < 0.0001 | -5.114 | 0.003 | < 0.0001 |
| Grau1 | 1.099 | 0.001 | < 0.0001 | 0.525 | 0.001 | < 0.0001 |
| White | 0.019 | 0.001 | < 0.0001 | 0.207 | 0.001 | < 0.0001 |
| ln_renda | 0.216 | 0.000 | < 0.0001 | 0.097 | 0.001 | < 0.0001 |
| Urban | 0.312 | 0.001 | < 0.0001 | 0.319 | 0.001 | < 0.0001 |
| NO | -0.125 | 0.002 | < 0.0001 | 0.088 | 0.002 | < 0.0001 |
| SE | -0.649 | 0.001 | < 0.0001 | -0.138 | 0.001 | < 0.0001 |
| SU | -0.715 | 0.002 | < 0.0001 | -0.349 | 0.002 | < 0.0001 |
| CO | -0.446 | 0.002 | < 0.0001 | -0.118 | 0.002 | < 0.0001 |
Source: Own elaboration based on IBGE (2000, 2010).
Table 6 Results of multinomial Logit model estimates for the unemployed option, 2000/2010
| Parameters | Unemployed | |||||
|---|---|---|---|---|---|---|
| 2000 | 2010 | |||||
| Estimates | Standard Error | Pr > ChiSq | Estimates | Standard Error | Pr > ChiSq | |
| Intercept | -0.793 | 0.002 | < 0.0001 | -1.523 | 0.002 | < 0.0001 |
| Migra | -0.109 | 0.001 | < 0.0001 | 0.006 | 0.001 | 0.0002 |
| Male | 1.326 | 0.001 | < 0.0001 | 0.667 | 0.001 | < 0.0001 |
| Aged 18-24 | -0.487 | 0.002 | < 0.0001 | -0.469 | 0.002 | < 0.0001 |
| Aged 25-34 | -1.064 | 0.002 | < 0.0001 | -0.868 | 0.002 | < 0.0001 |
| Aged 35-44 | -1.344 | 0.002 | < 0.0001 | -1.264 | 0.002 | < 0.0001 |
| Aged 45-54 | -1.946 | 0.002 | < 0.0001 | -1.895 | 0.002 | < 0.0001 |
| Aged 55-60 | -2.743 | 0.002 | < 0.0001 | -2.824 | 0.003 | < 0.0001 |
| Grau1 | 0.840 | 0.001 | < 0.0001 | 0.615 | 0.001 | < 0.0001 |
| White | -0.212 | 0.001 | < 0.0001 | -0.159 | 0.001 | < 0.0001 |
| ln_renda | -0.160 | 0.000 | < 0.0001 | -0.011 | 0.000 | < 0.0001 |
| Urban | 1.353 | 0.001 | < 0.0001 | 0.933 | 0.002 | < 0.0001 |
| NO | -0.152 | 0.002 | < 0.0001 | -0.107 | 0.002 | < 0.0001 |
| SE | 0.235 | 0.001 | < 0.0001 | 0.022 | 0.001 | < 0.0001 |
| SU | 0.209 | 0.001 | < 0.0001 | -0.140 | 0.002 | < 0.0001 |
| CO | 0.044 | 0.002 | < 0.0001 | -0.054 | 0.002 | < 0.0001 |
Source: Own elaboration based on IBGE (2000, 2010).
Based on the results of the coefficients presented in Table 3 for 2000, it is possible to verify that the propensity to work and study compared to being inactive is significantly lower in migrants than non-migrants, irrespective of control categories. The differences between migrants and non-migrants are slightly reduced in 2010, but there remains a markedly lower propensity to work and study in migrants compared to inactive non-migrants.
On the other hand, the probability of working and studying in 2000 is higher for men with elementary education, and the household income logarithm corroborates this option positively in both years. As household income rises, there is a direct relationship between working and studying. In 2010, the propensity to work and study was positive for men with good schooling and living in the Northern, Southern, and Midwest of Brazil. The positive sign for the logarithm of household income points in the same direction observed in 2000.
About the only working category, in 2000, the propensity is lower for white people living in urban areas in the Northern, Southeast and Midwest regions, compared to the Northeast of Brazil. Additionally, being a migrant reduces the propensity to only work when inactive compared to non-migrants.
In 2010, the differences in the propensities between migrants and non-migrants to only work in relation to being inactive were reduced but remained significant. Migrants continue to have significantly lower propensities to only work compared to inactive non-migrants. The per capita household income logarithm positively indicates that as income rises, the propensity to only work increases in both years.
As regards the propensity to only study, the coefficient in Table 5 shows that it is lower for migrants. In other words, migrants are less prone to only studying when inactive than non-migrants, and the results are confirmed in both years under observation but with a slight reduction in the coefficient from 2010 to 2000.
Likewise, the propensity to only study is more significant for white men with first grade residing in urban areas and, in 2010, in the North of the country. The per capita household income logarithm has a positive influence on the only studying choice, that is, the larger the ln_renda, the greater the propensity to be in this condition.
Concerning the propensity to be unemployed, in 2000, it is higher for men, young people with low schooling, living in urban areas of the Southeast, South and Midwest regions, compared to Brazilian Northeast. These results are similar to the classic studies for Brazil. On the other hand, being a white migrant, aged over 18 years, and low-income resident of the North part of the country reduces the propensity to be unemployed.
In 2010, the propensity to be unemployed was marginally higher for migrants. However, this propensity is reduced in the age bands of more than 18 and up to 55 years, white people, and residents of the Northern, Southern and Midwest of Brazil. Besides, ln_renda of the income shows a negative sign in both years, suggesting that the propensity to unemployment is inversely proportional to household income. That is, as unemployment rises, the logarithm of household income is reduced.
Based on the point estimates (oddsratio) presented in Table 7,4 it is possible to have the odds ratios of each individual belonging to each category in 2000 and 2010. From the results, the chances of working and studying in both years are lower for migrants than for non-migrants. Also, for all categories, the migrants' chances of insertion are lower than for non-migrants in 2000 and 2010. About the chances of being unemployed, migrants have greater odds ratios than non-migrants in 2010.
Table 7 Odds ratio of the estimates of variables used in the multinomial logistic regression model, 2000/2010
| Effect | Working and studying | Only working | Unemployed | Only studying | ||||
|---|---|---|---|---|---|---|---|---|
| 2000 | 2010 | 2000 | 2010 | 2000 | 2010 | 2000 | 2010 | |
| Point estimate | Point estimate | Point estimate | Point estimate | |||||
| Migra | 0.73 | 0.74 | 0.88 | 0.91 | 0.90 | 1.01 | 0.62 | 0.73 |
| Male | 5.71 | 3.22 | 8.12 | 4.64 | 3.77 | 1.95 | 2.55 | 1.76 |
| Aged 18-24 | 0.40 | 0.39 | 2.64 | 3.65 | 0.61 | 0.63 | 0.11 | 0.09 |
| Aged 25-34 | 0.17 | 0.27 | 4.04 | 6.47 | 0.35 | 0.42 | 0.02 | 0.02 |
| Aged 35-44 | 0.09 | 0.18 | 4.07 | 6.89 | 0.26 | 0.28 | 0.01 | 0.01 |
| Aged 45-54 | 0.03 | 0.07 | 2.14 | 4.12 | 0.14 | 0.15 | 0.00 | 0.01 |
| Aged 55-60 | 0.01 | 0.02 | 0.89 | 1.67 | 0.06 | 0.06 | 0.00 | 0.01 |
| Grau1 | 3.50 | 1.98 | 1.54 | 1.43 | 2.32 | 1.85 | 3.00 | 1.69 |
| White | 0.81 | 0.93 | 0.82 | 0.88 | 0.81 | 0.85 | 1.02 | 1.23 |
| ln_renda | 1.55 | 2.15 | 1.50 | 1.82 | 0.85 | 0.99 | 1.24 | 1.10 |
| Urban | 0.89 | 0.76 | 0.75 | 0.73 | 3.87 | 2.54 | 1.37 | 1.38 |
| NO | 0.84 | 1.11 | 0.91 | 1.06 | 0.86 | 0.90 | 0.88 | 1.09 |
| SE | 0.63 | 0.86 | 0.91 | 1.07 | 1.27 | 1.02 | 0.52 | 0.87 |
| SU | 0.87 | 1.05 | 1.18 | 1.34 | 1.23 | 0.87 | 0.49 | 0.71 |
| CO | 0.90 | 1.03 | 0.99 | 1.16 | 1.05 | 0.95 | 0.64 | 0.89 |
Source: Own elaboration based on IBGE (2000, 2010).
Regarding the chances of the Brazilian population to work and study, they are low in all ranges except between 15 and 17 years old. Besides, when it comes to the odds of only working, people over 18 have more chances of belonging to this category than those under 18, given that this is the age of mass entry into the labor market. The range between 18 and 34 years old has the highest coefficients, that is, the highest chances of working, among the ranges analyzed here. At this age, the workforce is fully active; the age discrimination coefficient is zero in this age group since the most productive workforce is undoubtedly here.
With the unemployed, people over 18 years of age have lower chances than the control category. This result is quite apparent since, at this age, the most significant share of the country's WAP is obtained. Additionally, the chances of only studying are very few for those over the age of 18. A substantial part of the country's population enters the workforce at full age and with secondary education. Thus, few are only studying when entering higher education. Moreover, a very small part of those who complete high school enter higher education in the country, perhaps only to be a student.
Those of white color have lower chances of studying and working, only working, or being unemployed, compared to a non-white person. However, their chances of only studying are higher than those of non-whites. Besides, residents of urban areas are less likely to study and work simultaneously and only work than residents of rural areas. However, they are much more likely to be unemployed and be studying than a resident of the countryside.
Furthermore, residents of the country's most dynamic regions, such as the Southeast, South, and Midwest, are more likely to be unemployed in 2000 than a resident of the Northeast. Several issues may be associated with the results: unemployment is higher in urban areas during a crisis. These areas concentrate the largest pool of highly skilled workforce and, in high unemployment cycles, they prefer to spend more time looking for a job. The impacts of cyclical crises may be accentuated in more dynamic regions. In 2010, the chances of being unemployed for a resident of the Southeast were reduced compared to a resident of the Northeast region.
Final considerations
This paper aimed to analyze the WAP'S occupation in 2000 and 2010 based on data from Brazilian Demographic Censuses. It sought to observe the occupation of migrants residing for less than five years compared to non-migrants in the municipalities analyzed.
According to the data, in 2000, 11.3 % of the resident migrants were unemployed, while only 10.4 % of non-migrants were in the same situation. Also, the migrant inactivity rate was higher than that of non-migrants in the same year. Only 7 % of migrants were only studying, while the share of non-migrants in the same condition was 8.5 %. In 2010, the unemployment rate fell, reaching only 6.3 % of migrants. However, non-migrants registered only 5.4 % of unemployment rates in Brazil, being slightly higher for the migrant population.
It is important to note that, out of 10,182,483 Brazilian migrants, 7.9 % only studied, 8.6 % worked and studied, approximately 20 % were inactive, and about 57 % only worked. These numbers were lower for non-migrants in the same year; approximately 22 % of them were inactive, 56 % only worked, and 9.0 % only studied in Brazilian municipalities.
Furthermore, it should be highlighted that the migrant population is mostly men between the ages of 25 and 34, with an average income lower than that of a non-migrant and living in urban areas of the country. Also, there is a concentration of migrants in the Southeast and the Northeast to the detriment of the other regions. When comparing 2000 to 2010 for migrants and non-migrants, there is an improvement in the education of those with first grade and the average income, being greater for migrants.
The results also show that the propensity of migrants to be in a more favorable occupation condition is relatively lower than that of a non-migrant in both years. Additionally, the propensity to study and work is lower for white migrants living in urban areas, and aged over 18 years for both years, and lower for residents of the North, Southeast, South, and Midwest compared to a resident of the Northeast region.
The propensity to only study is lower for white migrants residing in urbanized areas in both years under consideration. Besides, the propensity to be unemployed is lower for white migrants in 2000 and higher in 2010.
It is emphasized that the chances of migrants to study are only lower than their chances of working and studying, which, in turn, are lower than the chances of only working. Migrants are more likely to be inactive or unemployed compared to non-migrants in both years under analysis.
The results reveal that, besides the classic characteristics in the literature on selectivity in the Brazilian labor market, being a migrant also increases the chances of insertion in the labor market in more precarious conditions based on the database used here. It is possible to state that, in addition to the race/color, sex, schooling, and region of residence, the fact of being a migrant negatively affects their insertion in the Brazilian labor market.

