


 English (pdf)
 Article in xml format
 Article references
 Send this article by e-mail
 Cited by SciELO
  Cited by Google
  Similars in
SciELO
Similars in
SciELO  Similars in Google
 Permalink
1. Introduction
The hematite iron oxides forms (α-Fe2O3) among others are of great importance in technological and industrial applications 1. Hematite exhibits high resistance to corrosion, therefore, it has been extensively used in many fields which include photo-anode for photo assisted electrolysis of water. This is due to its favorable properties such as a band gap between 2.0-2.2 eV, which allows absorbing a substantial fraction of solar spectrum, chemical stability in aqueous environment, and nontoxicity. It is an active component of gas sensors, catalyst, lithium ion battery, pigments and oxidizer in thermite composition 2-6. It is also used in magnetic fluids, also called ferrofluids, for damping in inertial motors, shock absorbers, heat transfer fluids, etc 7. Because of its extensive applications, nano hematite has attracted much attention for its synthesis and applications.
For the current uses of the iron oxides in biotechnology, nanomedicine and environmental remediation, mainly requires that the particles may obtain certain characteristics, which can be achieved by controlling the oxide synthesis. Various techniques have been used to fabricate hematite nanomaterials of desired morphology (e.g. nanorods, nanofibres, nanowires, etc.) for various applications. Methods that have been employed for hematite synthesis, may either be a wet/based solution or a non-solution dry/ based. Wet synthesis include methods such as thermolysis/forced hydrolysis, precipitation/copre-cipitation, which in the case of hematite might involve synthesis of an intermediate (A ferrihydrite or goethite or both), followed by dehydroxylation at high temperature 8, or Sol-gel synthesis, which involves dissolution of the Fe3+ and an organic compound to form the sol, concentrating the sol by removal of water to form the gel and subsequent thermal treatment to obtain the required product 9 or hydro/solvothermal synthesis, in which α-Fe2O3 is precipitated at high temperature (ranging from 160 to about 280°C) 10-14.
The dry methods could be either thermal decomposition/combustion processes (reaction occurs in the vapour phase. e.g. chemical vapour condensation, laser pyrolysis and arc discharge) or solid state chemical reaction (reactions take place in solid state e.g. mechanochemical high energy or ball milling, it involves milling of the precursors at high energy to form nanomaterials) 15. However, these methods involve special equipment, high temperatures, and the tedious removal of impurities, which are all time-consuming and come at a high monetary cost.
The controlled precipitation process has been used for the preparation of nano or submicro powders, in a variety of metal oxides using inorganic salts as precursors 16. The synthesis of magnetic nanoparticles with controlled size has long been of scientific and technological interest. However, uniform physical and chemical properties of magnetic nanoparticles, greatly depend upon the synthesis route and how to develop a simplistic and effective way to synthesize magnetic particles, with high dispersion and narrow size distribution, remains a challenge.
In this paper, ferric oxide nanopowders were synthesized by controlled precipitation route, using iron chloride precursor. Structural and surface morphological properties and the relationship synthesis-structure are described and discussed by RAMAN, FTIR, DRX and SEM (Scanning Electronic Microscopy) analyses.
2. Methodology
All chemicals were of analytical grade and were used as received without further purification. Distilled water was used for the preparation of solutions and washing the synthesized samples. The synthesis of iron oxide nanopowders was carried out in 3 stages: Precipitation, washing and heat treatment, according to the following manner:
(1) Precipitation was performed with 250 ml of precursor solution of Fe (III) 1 M. A 6 M NaOH solution was then added, drop wise (drop rate = 1 ml min-1) to the stirring mixture at room temperature. The pH value was defined according to the experimental conditions given in reference 17 and was maintained during the synthesis. The resulting dispersion was continuously stirred at room temperature The reaction time was adjusted to 24 hours and 48 hours and the evolution of the synthesis was evaluated. The sample is taken every day of synthesis (sample M-I 24 hours and sample M-48 hours, calcined 450 °C), and was examined grain size, through the metallo-graphic microscope and analyzed by XRD, to determine the crystalline phases present in each sample.
(2) Removal of subproducts generated in the synthesis by consecutive washings. The resulting colloidal suspension, containing nanoparticles, was washed by repeated centrifugation at 3.800 rpm. The solid phase was separated and re-dispersion carried out, in distilled water using an ultrasonic bath. This process was performed on the sample M-I and also four times on the sample M-II. The conductivity of the fluid phase is measured to determine the presence of NaCl in the solid phase and then determining the level of chlorides. After the sample were heated to evaporate for 4 h at 80 °C.
(3) Thermal processing: The products were cooled to room temperature and finally calcined at 425 °C for 4 h. Reddish powder was finally obtained.
As-prepared powder samples M-I and M-II, were characterized X-ray powder diffractometer (XRD). The XRD used was Philips PW1710 BASED X-Ray Diffractometer with 20 values range, from 10o to 89.98o and Cu Ka radiation source (X = 1.54274) operating at 38 kV and 23 mA. The morphology of sample M-II was characterized by scanning electron microscopy (SEM) JEOL JSM-7600F, at a work distance of 5.6 mm. Raman spectra of sample M-II were recorded on a Raman Almega XR (System micro / macro Raman dispersive Nicolet). Infrared spectra of samples M-II were recorded on a Infrared Spectrometer, FTIR Thermo Nicolet NEXUS 670 using KBr matrix.
3. Results and Discussion
Based on a potentiometric titration curve reported in the literature 17, with it the equivalence point system located in a pH of 6.17, by the calculations of the first and second derivatives, was a determined curve. In this curve were identified four regions. In the first region (pH 1.18 to 1.81) occurs a large consumption of OH- ions by the ferric chloride solution (pH 1.18). In the second (pH 1.81 and 2.12), consumption of OH-ions is even greater, since the pH is almost unchanged. Production lots of complex ionic, colliding with each other, clumps together and create larger clusters, called embryos 18. In the third from (pH 2.12 to 11.91) decreases the speed of embryonic growth, low consumption of OH- ions and increasing pH. This region characterized for nucleation (stable set of embryos) and contains the equivalence point, at which the pH achieves its maximum precipitation 18. The fourth (pH 11.91 to 13.22) again there is considerable consumption of OH- ions and the dissolution that occurs, slowly reaches saturation. Nuclei are grouped and form hydrated gel 18 ferric oxides. This was taken into account and the synthesis was carried out at pH = 6. The diffractogram Figure 1-(a) y 1-(b) exhibits peaks corresponding to NaCl (PDF pattern 001-1053) 17, peaks are practically absent in the diffraction patterns of powders washed three times; in fact, this assertion is also supported by the conductivity analysis' aqueous phase resulting from the washings. After the first wash, the conductivity corresponds to 63, 72 mS, value higher than the conductivity of the distilled water (4 uS) 19. Following the second wash, the conductivity 17, 78 mS. It is 72, 1 % less NaCl from the first washing, and after the third wash 1,32 mS was achieved. Three successive washes caused a 98% salt decline relative to its initial concentration. A certain amount of ions are absorbed in the final product 20. For this reason, and after removing 98% of the initial products, it was decided to perform only three washes.
X-Ray diffractometer (XRD) was used to identify the crystalline phases. Figure 1-(a) shows the XRD pattern of the sample after heat treatment. The sample shows very thin peaks, indicating the fine nature and small crystallite size of the particles. The result agrees with a γ→ α - Fe2O3 phase transformation, that took place during calcination at 450 °C and the weak peaks observed at d-values of 3.68 (D012), 2.69 (D104), 2.51 (D110), 2.19 (D113), 1.84 (D024), 1.69 (D116), 1.59(D018), 1.48 (D214), 1.45 (D300) and 1.30 (D1010)Ǻ (peaks marked as ‘H’), correspond to (major phase rhombohedral structure) moderate crystalline of α - Fe2O3 was identified using the Match Software and literature (21). Along with peaks at d values of 4.837 (D111), 2.959 (D202), 2.531 (D311), 2.423 (D222), 2.101 (D400), 1.714 (D422), 1.612 (D511) and 1.487 (D440) Ǻ, (minor phase, cubic, and spinel structure) correspond to the Y-Fe2O3 particles (peaks marked as ‘M’) and have a cubic unit cells with both octahedrally and tetrahedrally coordinated Fe3+ sites (defect spinel structure) 22. Figure 1-(b) shows the XRD pattern of M−II sample consisted of well crystalline Y-Fe2O3 (minor phase, cubic, and spinel structure) and α-Fe2O3 (major phase) solids with a progressively subsequent increase, in the peak height related to all phases produced, indicating the promotion effect of reaction time in the crystallization degree enhancement of α-Fe2O3 and Y-Fe2O3.
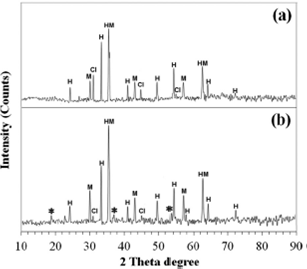
Figure 1 XRD pattern of iron oxide nanoparticles prepared by wet synthesis (a) Sample (M-I) after the first wash, (b) Sample (M-II) after three successive washes (H = α - Fe2O3, M = Y-Fe2O3, * = Fe3O4 and Cl = Halide).
Due to new peaks 18.38o (D111), 30.20o (D220) and 53.90o (D422) in the diffraction pattern of the sample M-II Figure 4- (b), one cannot overlook the presence of Fe3O4 phase depending on the similarity between the diffraction lines, both phases of Y-Fe2O3 and Fe3O4. From X-ray analysis, the lattice constant so obtained for alpha-Fe2O3 nanoparticles were a=b=5.0380 À and c=13.7720 À. The lattice parameter "a" and interplanar spacing Dhkl Y-Fe2O3 (a = 8.3000 À and D311=2.531 À), were determined by Bragg's 23 and these values are closed to the values in some references as in (a=8.347 À and D311=2.517 À) 24. The values which are obtained for the sample, can be attributed to simultaneous formation of another phase such Fe3O4 (a=8.3958 À and D311=2.531 À) 25. Thus we can conclude that the M-I and M-II samples consisted of moderate crystalline α - Fe2O3 and Y-Fe2O3 phases, only whereas the M-II sample contain a mixture of α - Fe2O3, Y-Fe2O3 and Fe3O4 phases. A peak width in 2.51 (D110) Figure 1-(b) is increased as the reaction time becomes longer and can be explained by the phase transformations and the effect of washing process, generating more crystallites. This is an interesting observation because sheetlike magnetite impurities, were not reported in the synthesis of hematite by the controlled precipitation method.
The α-crystallites obtained showed sizes below 100 nm similar to that of Y-crystallite. However, the peak height of the diffraction lines at d-spacing 2.69 (D104) and 2.51 (D110) were considered respectively as a α - Fe2O3 and y-Fe2O3 phases crystallinity degree measure. It is clear that the increase in reaction time and repeated washings brought about an increase in the different phases crystallinity degree. A progressive shift of all diffraction peaks to higher Bragg angle was observed. This shift displays the presence of changes in both the crystallinity and crystallite size of the investigated solids. The enhancement effects of reaction time and repeated washings on the phase transformation process, are better investigated by measuring the height of certain diffraction lines characteristic for α - Fe2O3 (D104), (0.269 nm, 100%) and relative to one of the common lines of both α - Fe2O3 (D110), (0.251, 75%) and Y-Fe2O3 (0.251, 100%). This was done and the results obtained revealed that the ratio, R, between the peak height of the lines at ''d'' spacing of 0.251 and 0.269 nm for the M-I sample was 1.53 and was twice the value of R for the pure sample α - Fe2O3 (0.75), indicating the formation of Y-Fe2O3 phase, due to a partial conversion of some α - Fe2O3 to Y-Fe2O3 phase. The increasing reaction time in the investigated solids from 24 to 48 hours, led to 1.17, an 25 % growth in the R value, which then decreases, but it is still greater than the pure α - Fe2O3 phase one. These observations indicate that the M-I y M-II samples may contain the amorphous Y-Fe2O3 phase and nanocrystalline α - Fe2O3 phase 26.
Surface morphology of the as-synthesis and calcined samples was studied using SEM analysis. Some samples were observed using metallographic microscope (results not shown). Figure 2 shows the SEM images of the as-prepared Fe2O3 nanoparticles by controlled precipitation method. In this figure closest and smaller approach, the particles prepared with formation of clusters or aggregates of particles. In both cases, the aggregates are formed of primary particles whose dimensions can be said that are in the order of nanometers according to the scale of photograph. This indicates that Hematite nanoparticles can be obtained with 24-48 hours of reaction and 425 °C. When the picture closest approach is achieved, Figure 2(a), you can see that the aggregates are formed by hemispherical and nearly elongated primary particles whose size, apparently, is on the order of nanometers Figure 2(b).
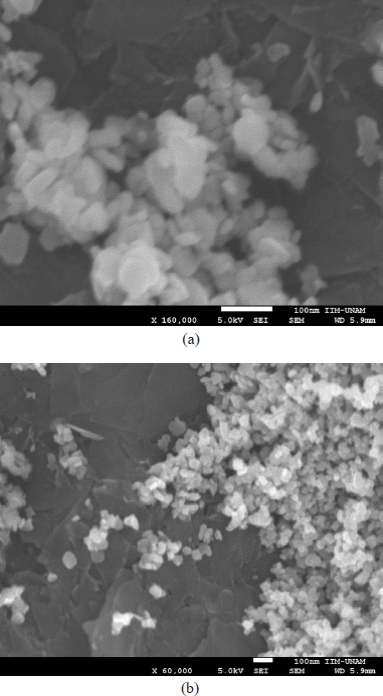
Figure 2 SEM image of hematite nanoparticles a-Fe2O3. Sample (M-II) after three successive washes (a) Closest approach Figure and (b) Smaller approach.
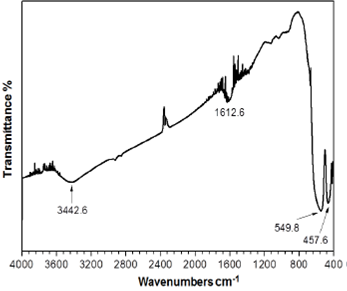
According to Figure 3, the infrared spectrum (FTIR) of the synthesized Fe2O3 nanoparticles, was in the range of 400 - 4000 cm-1 wavenumber which identifies the chemical bonds, as well as functional groups in the compound. The peaks at 1612.6 cm-1 and 3442.8 cm-1 can be attributed to the stretching vibration of the hydroxyl groups, on the surface of the nanoparticles, 21 possibly as a contamination of the sample at the time of taking the spectrum or distortions in the signals, probably due to ambient water molecules intrusion 39. The characteristic absorption sample bands at 549,8 and 457,6 cm-1, may correspond to Fe-O stretching and bending vibration mode of α-Fe2O3 respectively 27. However they are very close at two broad peaks at 555 and 463 cm-1 which corresponds to the Fe-O stretching and bending vibration mode, respectively of Y-Fe2O328.
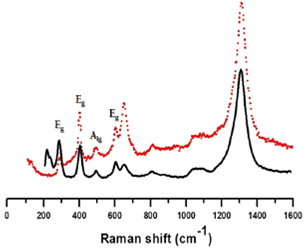
Raman spectroscopy can provide clear assignment of the iron oxide polymorphs through the observation of the phonon modes. The iron oxides species exhibit distinct Raman signatures; therefore, it is possible to take advantage of the so-called phonon confinement effects, to confirm the oxide present in the sample 29. In order to demonstrate accurately the type of oxide present in the system, a Raman spectrum of nano-powder is presented in Figure 4. Hematite belongs to the D6 3d crystal space group and seven phonon lines are expected in the Raman spectrum 30. Five of the seven Raman active bands of hematite, that are predicted by group theory, were observed with the different intensities: Namely a A1g mode (493.8 cm-1) and three Eg modes (299.7, 399.8 and 607.6 cm-1). The most representative bands of hematite are around 228.6 cm-1 and 295.02 cm-131, however only one was found in our spectrum (299.7 cm-1). From the literature, the band at about 1305.7 cm-1, is a vibration which has some unclear origin. Faria et al.31 says that this band is caused by the scattering of two magnons in the structure, but according to Su et al. [32], this phonon consists of a second harmonic vibration.
It is important to say that the band of hematite at 1305.7 cm-1, is close to the magnetite at approximately 1304.9 cm-1. This causes an overlapping in vibrations when these two phases are mixed, making difficult their identification by using those bands. In the case of magnetite, the most representative band is found at about 653.6 cm-1. The results make it possible to distinguish hematite from magnetite (Fe3O4) characterized by a specific band at 661.6 cm-132. In the Raman spectrum, the bands between 600 and 700 cm-1, which appear both in the experimental spectrum and the theoretical, differ because the relative intensities thereof are reversed. This behavior indicates the possible presence of Y → α -Fe2O3 and Fe3O4 different phases in the sample. Furthermore, in the experimental spectrum band nearby 200 cm-1 does not appear, which is in line with the previous behavior.
At a relatively high hydrogen-ion activity and high electron activity (an acidic reducing medium), iron (II) ion, Fe2+, is the predominant iron species. At a very high hydrogen-ion activity and low electron activity (an acidic oxidizing medium) Fe3+ ion predominates. In an oxidizing medium at lower acidity, solid Fe(OH)3 is the primary iron species present. Finally, in a basic reducing medium, with low hydrogen-ion activity and high electron activity, solid Fe(OH)2 can be stable. Within the pH regions normally (approximately pH 5-9) Fe(OH)3 or Fe2+ is the predominant stable iron species. In fact, it is observed that in medium containing dissolved oxygen at any appreciable level (a relatively high pE), hy-drated iron (III) oxide Fe(OH)3 is essentially the only inorganic iron species found. Medium contain a high of suspended iron, but any truly soluble iron must be in the complex form. In highly anoxic low-pE medium, appreciable levels of Fe2+ may be present. However when such medium is exposed to atmospheric oxygen, the pF rises and Fe(OH)3 precipitates 33.
The precipitation is obtained when the amount of FeCl3.6H2O and NaOH solution reaches a stoichiometric condition. At the equivalence point, the iron ions in the solution have a positive charge of +2, and therefore the synthesis starts from ferrous ions by reacting with hydroxyl ions, produce iron oxide (III) Hydrated 17, and the following reactions are proposed for the mechanism of the nanopowders synthesized here 34-37:
(1) FeCl3*6H2O+3NaOH ( aq) →Fe(OH)3( s) + 3NaCl ( aq), + 6H2O ( l)
(2) Fe(OH)3(s) →FeOOH ( s) + H2O ( l)
(3’) 2FeOOH (s) +Fe2+ ( aq) + 2OH- ( aq) →Fe3 O 4(s) + 2H2 O ( l)
(4") 2FeOOH(s) (heating) →Fe2O3(s) + H2O ( l) (transformation Y α - Fe2O3)
From Eq. (1), (2) and (3'), it is suggested that the precipitation obtained in the first step of nanopar-ticle synthesis is FeOOH, or goethite 34 and the ferric and ferrous hydroxides are precipitated. These reactions are very fast. Second, the ferric hydroxide decomposes to FeOOH Ec. (2), due to the low water activity of the resulting NaCl solution in a slower reaction. Finally, a solid state reaction between FeOOH and Fe(OH)2 takes place Ec (3'), due to the low water activity of the solution. Ferrous hydroxide (Fe(OH)2) formed from the reaction of Fe2+ and hydroxyl ion, could not be consumed rapidly because the solid phase reaction progressed relatively slowly 38. This was supported by the fact that much of the FeOOH still remained even after 24-48 h, as shown in Figure 4(a) and 4(b). The overall reaction mechanism is a dynamic equilibrium equation in which the concentration and size of Fe3O4 nanoparticles are influenced by [Fe3+], [Fe2+] and [OH-], as well as the water activity of the solution. 35
The crystal growth mechanism might be the combination of O-R and O-A pathways. It can explain the increase of particle size of the obtained nanoparticles with increasing the reaction time, greater number of washes (comparison of DRX sample M-I and M-II, Figure 1(a) and 1(b)). It is obtained when it was stirred for 48 hours at room temperature and washed three times. This is due a higher chance for crystal growth to take place in the process. To a lesser extent, Fe(II) concentration and stirring of the suspension, also influence the nature of the final product, but mainly affect the kinetics of the reaction. Important variations of these parameters led to the formation of other phases.
The last step is the calcination process Ec. (3"). A secondary stage of crystal growth happens in this step. It can explain the effect of temperature calcination in the hematite nanoparticles formation. The calcined process was an incomplete crystal growth process. There are two well-known crystalline types of Fe2O3: maghemite (the Y-phase) with cubic structure and hematite (the α -phase) with rhombohedral structure. The phase transition of Y → α - Fe2O3 takes place during calcination at about 450 °C 36. The phase transformation which occurs during calcination, gives rise to transform α - Fe2O3 powder which has undergone considerable aggregation and grain growth 37. The characteristics of the obtained hematite nanoparticles were influenced by the parameters in every step of the sample preparation that is a mixing process, increasing the reaction time, greater number of washes and stirring, plus calcination processes.
4. Conclusion
A simple controlled precipitation synthesis has been successfully carried out to fabricate α-Fe2O3 nano-powders at a relatively low temperature. The synthesis method of Fe2O3 nano-particles was investigated with a focus on the structural and surface morphological properties, the relationship synthesis-structure and the nature of Fe2O3 nano-crystallites. It was clarified that the reaction time repeated washings and convective force used in the synthesis process, played an important role in determining the transformation of the iron oxides and particle size and phase. Formation/transformation of phases at different reaction time and repeated washings was confirmed by XRD analysis. This is an interesting observation because magnetite impurities were not reported in the synthesis of hematite by the controlled precipitation method. From SEM (scanning electron microscopy) images, exhibits the synthesized Fe2O3 nanopowders by controlled precipitation route with an average diameter < 100 nm and the morphology of the aggregates particles, is from plate-like shaped nearly hemispherical and elongated, due that nanometric primary particles are spheroidal form and have a possibly join to form small linear agglomerates, and structures that can be "transformed" into tablets, rods or bars. FTIR data, showed the presence of Fe-O stretching mode of Fe2O3. With the help of the Raman spectra, the nanopowders were clearly identified, mainly as hematite mixed with maghemite by their spectral bands and the lattice parameter "a" and inter-planar spacing Dhkl characteristic. Magnetite impurities removal by simple oxidation can generate a mixture of hematia and maghemite nanopowders with potential application. This mixture of metal oxides nanoparticles could be of great importance for the removal of toxic heavy metals from subsurface, technological and Industrial applications.

