1. INTRODUCTION
The birth ofone or more stars leaves as a remnant a circumstellar disk, inside which the planetary formation can be given, called the protoplanetary disk. The investigation of protoplanetary disks is essential to know the stages of evolution that lead to the formation of the exoplanets and planets of the solar system. The high resolution images of Hl-tauri, obtained by ALMA [1] and VLA [2] have revolutionized and challenged the theories of plane- tary formation, being this subject of great interest and controversy. A class of circumstellar disk is the transitional disk, which, in general are symmetrical and have a toroidal shape around their star [3,4]. The transitional disk DoAr44 is the simplest and most simplified protoplanetary disk that can be studied and modeled. And this model is the basis for describing more complex protoplanetary disks like Hl-Tauri [1].
A transitional disc can be formed by one or more toroids and eventually the toroids can have different degrees of inclination [5]. Through an accretion process, this dust and gas toroid forms planetesimals, which when collapsed, give rise to a massive object (planet or dwarf planet) and a series of smaller objects (asteroids and comets). Therefore, planetary formation must occur inside the toroid [2]. Consequently, the planetary formation is faster, giving an explanation to the large number of exoplanets that have been found around the stars.
In this work, a statistical model is presented and the process followed to simulate the transitional disk with a single toroid like DoAr44 and the protoplanetary disk Hl-Tauri, formed by several concen- tric toroids. It is assumed that each toroid has its own dynamics (in this case, two toroids remain separate) and the interaction between them is not ruled out (in this case, two toroids merge into one).
2. TRANSITION DISKS
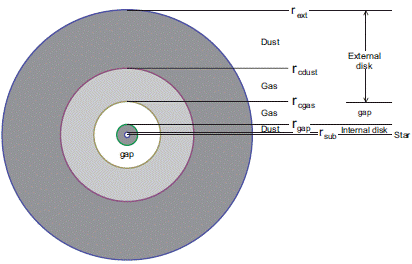
The transition discs consist of a very small internal disk and a large external disk, separated by a cavity free of dust and gas (gap). It adopts the physical structure suggested by [3], implemented by [4] and applied for a similar analysis of Ophiucus IRS 48 by [6]. The disk closest to the star, is usually made up of dust with low volumetric density; has an internal radius r sub (sublimation radio) and an external radio r gap (radio where the gap starts). The gap does not contain dust and generally does not have gas either, some authors consider that it is due to the formation of a planet which has captured all the existing matter around it [7]. The external disk is constituted by gas and high density dust, the gas disk has a thickness that goes from r cgas (radius of the gas cavity) up to r cJust (radius of the dust cavity) and dust disk from r cdust to rext (external radius). As illustrated in the Figure 1.
The disk may have a different orbital plane with respect to the others, or with respect to the plane of equatorial rotation of the star [5]. With radio telescopes only the radiation emitted by the dust that makes up the external disk is observed, in what follows, we will only model the external dust disk and the star composed of gas.
2.1 Formulation of the statistical model
As an example we take the transitional disk DoAr44, which is a completely symmetrical dust ring around its star [7]. To model it we ideally consider that it is constituted by a spherical gas star and a toroid, made up of planetesimals with equal masses. Through an accretion process, planetesimals will give rise to massive objects (planets, dwarf planets, asteroids or comets).
Initially the particle distribution, R(r), must be obtained throughout 0 < r < ∞. For the proto-star the number of particles grows exponentially as r → 0, which explains why it finally collapses into a point object with respect to the initial volume of the gas. The particles in the toroid are around the ave- rage distance \r) with a positive asymmetry, that is, the number of particles is greater when r < 〈r〉 and less when r > 〈r〉. Statistically, this corresponds to the Gamma density function:
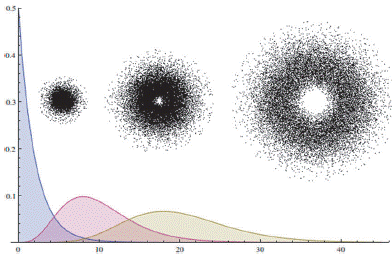
In the expression (1) you have the parameter α > λ called form of distribution (if a = 1 a star is obtained and if α > 1 a toroid) and a parameter λ > 0 called scale, which determines the scope of positive asymmetry from the right, as illustrated in Figure 2. The term Γ (α) is the Gamma function (for this reason, this name is given to the density function), in this case it is an extension of the factorial concept to real numbers and is responsible for the convergence of the distribution.
To determine the parameters a and X we make use of the concept: Complete Spatial Randomness (CSR). It is assumed that the particles are randomly found in space (this is called an event), therefore, from an average occurrence frequency of events λ, the probability that a certain number of events will occur (k) in a certain position r, obeys a Poisson distribution:
In the region of the considered space, the probability of the encounter between two particles is very small, that is, statistically it is a "rare event". Consequently, the probability is zero, if the encounter of more than two particles is considered, in a moment of time. The encounter of two particles in a region is independent of the encounter of other particles in any other disjunct region of the previous one. And the encounter of the particles occurs with regularity and independence, being the number of encounters theoretically unlimited. This behavior validates the correspondence with the Poisson distribution (2).
If the toroids give rise to the planets orbiting the star, we can assign a number n to each orbit. Therefore, the semimajor axis of the orbit can be ex- pressed as α = α s n, where as is a free parameter (in astronomical units). It is not required that the orbit numbers n for the planets, be consecutive. As the dynamics is determined by the mass of the proto-star regardless of the mass of the object that the orbit, the parameter as it must be proportional to the mass of the proto-star, at the time when the toroid was formed. The average occurrence of events is the encounter of two particles at a distance a, i.e., λ = 2/ α = 2/ α s n. If in the distance a, two are given events, it is expected that at the distance nα, 2n events occur; therefore, k = 2n.
The Poisson distribution (2), 0 ≤ P(k, r, λ) ≤ 1, by multiplying it by a factor λ it becomes the Gamma density function (1), where α = 2n + 1 and λ = 2/ α s n. As now a it is a positive integer (α ε ℕ) the Gamma function Γ (α) = (α - 1)!, i.e., Γ (2n + 1) = 2n!. The Gamma distribution, when α is a positive integer, is known as the Erlang distribution. Consequently, the particle distribution for the toroid generated by a planet in the orbit n is,
since this expression is a density function, the area under the curve is the unit:  The density function (3) is reduced to a Gaussian distribution for n > 9.
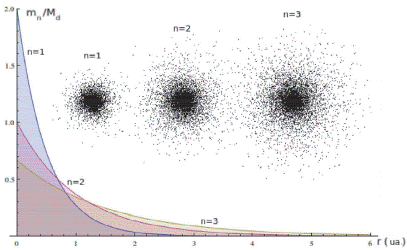
As seen in the Figure 3 the maximum points are in α = α s n 2 , consequently, it is expected that one or more massive objects (planets or dwarf planets) will be formed in this position and smaller objects farther away from this position (satellites, asteroids or comets).
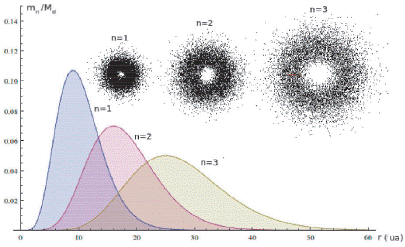
Figure 3 Density function R n (r) for α s = 1 and n = 1, 2, 3, The maximum is found in: α = α s n 2 = 1, 4, 9, respectively.
In the Solar System, the planets are located at certain distances from the Sun. A succession has been found that relates the distance of the planets from the Sun known as the law of Titius-Bode r = 0,4 + 0,3 X 2n, with n =- ∞ 0, 1,... , 7 [8]. However, a better agreement is obtained considering the distance proportional to the square of a whole number: α = α sn2 [9].
For the symmetry of the toroid the angular part is given by the spherical harmonics:
This provides a Gaussian density function with respect to θ and a rotational invariance O2. By integrating in the entire range of coordinates the unit is obtained: 
For the star we have the distribution function:
where ∫0 ∞ Sn(r)dr = 1, and
Therefore, to describe a protoplanetary disk like Hl-Tauri, where it is evidenced that it is constituted by a series of concentric toroids [1], with a density τ (r, θ, ϕ ). The star is made up of a series of concentric layers with density σ (r θ, ϕ):
where mn the mass of each of the Nτ toroids that make up the protoplanetary disk, and Mn is the mass of each of the Nσ layers that will give rise to the proto-star. Each of the mass terms depends on the distribution of matter, the absence of matter makes some of these terms zero, so that not all orbit numbers contribute in the summation. By integrating the expression (7) and (8) we will obtain the mass of the protoplanetary disk,  ,and the mass of the star,
2.2. Simulation process
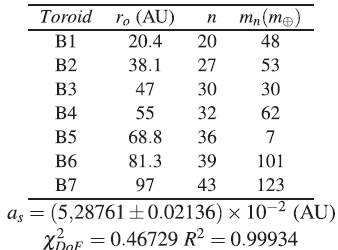
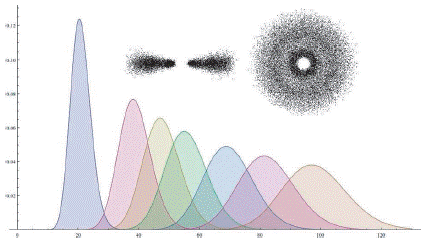
To simulate the protoplanetary disk Hl-Tauri, we start from the values of the major semi-axes of the bright rings: (αo = 20.4, 38.1, 47, 55, 68.8, 81.3, 97) AU [1]. In the equation α = αn2 we do not know the free parameter as and the orbit numbers, n. As the value for the Solar System is α☉≃ 0-031 AU and it is considered that the Hl-Tauri star has a mass of Ms = 1-7 M☉ [10], we propose a series of possible values αs (0.04 ≤ ka☉ ≤ 0.06) AU, with a descending sweep of 10-5 AU, where k = Ms/M☉.
For each value, ak, the number of orbit is calculated from the rings,  obtaining a series of values (ro, α
k
n
2
), and a least-squares adjustment is made to the equation, r
o
= α
sn2, where a
s
is the parameter to be determined. In this way, we obtain the value a
s
=
 , where
  is the average and e
s
is the dispersion (error). Additionally, the correlation coefficient 0 ≤ R
2 ≤ 1 is obtained, and the chi-square value by degree of freedom
  and the goodness of fit (likelihood): 0 ≤
  ≤ 1. The maximum likelihood is used as a criterion to select the best value of α
s
. The results are shown in table 1.
For the transition disk DoAr44, M s = 1.3 M☉, R = 1.75 Ra M, = 0.005 M☉ and the toroid is between 32 and 60 AU [7]. The same procedure as above is followed, using as criteria, to select the best value as, the lowest percentage error: e s = 100 | α s ,- α o |/α o The results obtained are: as = (3,94858± 0,00006)× 10−2 AU, n = 33 and r n = 43 AU, with these values the Figure 5 was made.
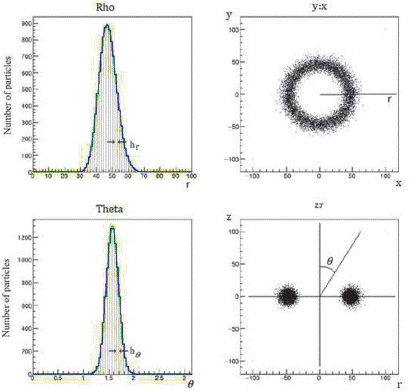
Figure 5 Distribution function R n (r)Y n (θ, ϕ) of DoAr44 and its representation as a particle system.
Table 1 shows the mass m n of each of the rings [10]. The number of particles in each ring N t is proportional to its percentage. The particles are randomly distributed in the area under the curve of the function R n (r) in the range 0 ≤ r ≤ 130 AU, and each particle is assigned a random angle: 0 ≤ ϕ < 2π. A circular sector is obtained in the XY plane (See upper part of Figure 8), then each of these particles are randomly distributed in the area under the curve Yn(θ, 0) in the interval 0 < θ ≤ π, (See lower part of Figure 8). With these three values ??(r, θ, ϕ) the position of each particle in the Cartesian coordinate system is determined: x=rsinθ cosϕ, y=r sinθsinϕ, z=rcosθ. Figure 9 shows the radial function, the cross-sectional and zenithal view of the particle system obtained. In Figure 9 we can observe the absence of a ring in 28 AU, which is consistent with the collapse of the ring to planet.
The function (m n /Md)R n (r)Y n (θ,ϕ) is computationally represented as e n R n (r) f n Y n (r) where en and f n is a scale factor that corresponds to the maximum heights of each of the distributions; which, in turn, depend on the number of particles that are randomly distributed under the curve, as shown to the right of the Figure 5. The domain of the distribution function, R n (r), is 0 < r < r ext (AU), which we divide into Nr intervals: 1 ≤ i ≤ N, each division has a width, h r = r ext /N r . The height of the i-th division is calculated by averaging the two heights of the interval R(i) = 1/2 (R n [(i-1)h r ] + R n [ih r ]). A random radius is generated between 0 < r ≤ r ext and it is located in the i-th division to which it belongs, as long as the points contained in the division are less than R(i), in such a way that filling is completed under the curve of Figure 5 with a certain number of points. The points are located at an angle 0 ≤ ϕ ≤ 2π random, obtaining the toroid on the XY plane. The axial symmetry is given by the ϕ angle that we already had in mind when projecting the toroid in the XY plane. This distribution function can be represented with a system of particles distributed in space as illustrated in Figure 5.
The domain of the angular distribution function Y n (θ, 0) is 0 < θ ≤ π, which we divide into N θ = N r π/r ext intervals: 1 ≤ i ≤ N θ , each division has a width, h θ = π /N θ . The height of the i-th division is calculated by: Y (i) = 1/2 (Y n [(i - 1)h θ ] + Y n [ih θ ]). A random angle is generated between 0 < θ ≤ π and it is located in the i-th division to which it belongs, as long as the points contained in the division are less than Y (i), in such a way that filling is completed under the curve of Figure 5 with a certain number of points. The points are located along the z-axis from its XY position obtained previously with the radial distribution.
Finally, we have the radius 0 < r ≤ r ext , the angles 0 ≤ θ < π and 0 ≤ Ø < 2 π, with which the position of the particles in the XYZ Cartesian coordinate system is determined:
The magnitude of the velocity of the particles, v o , is determined from the opposing forces: the gravitational force against the centripetal force (-m d Φ (r)/dr|r=α = sin θ - mv 2 /α sin θ = 0):
where Φ(r) it is the potential under which the particles are subjected. The velocities in space are obtained by deriving the positions of the particles, equation (11), they are:
To simulate the collision between two particles, each one is considered as a sphere whose radius is half the minimum distance between the particles of the distribution. This was done with the purpose of inducing a first collision to accelerate the simulation. Initially, it is examined that there is no overlap between the spokes and the directions of the speeds must be opposite for the collision to exist; if these conditions are met, the second particle is suppressed, decreasing the number of particles of the simulation in one, this causes the speed of the simulation to increase depending on the frequency of the collisions. The resulting particle complies with the law of conservation of the mass, volume and momentum of the particles that collided. The Hl-Tauri disk consists of a series of toroids with a mass that depends on the number of number of particles in each of the radial distributions. The masses of each toroid were obtained from [7] m n = 47, 53, 30, 62, 7, 101, 123 M⊕, which affect the height of the distribution function. The radial distribution function and the corresponding particle distribution are illustrated in the Figure 6. Unlike other models, the formation of planetary bodies is faster and generates stable and closed orbits [11].
CONCLUSIONS
The radial particle distribution of a transitional disk is a particular case of the Gamma density function where the parameter α = 1 for the star and α > 1 for the toroid. Any protoplanetary disk can be formed by one or more toroids. This distribution causes the most massive objects to be formed at a predetermined distance given by α = αs n 2, where as it is a free parameter. Since the dynamics is determined by the mass of the protostar regardless of the mass of the object that the orbit, the parameter as it must be proportional to the mass of the proto-star. Physical behavior is subordinated to the observed statistical behavior.


