


 English (pdf)
 Article in xml format
 Article references
 Send this article by e-mail
 Cited by SciELO
  Cited by Google
  Similars in
SciELO
Similars in
SciELO  Similars in Google
 Permalink
1. INTRODUCTION
Bioimpedance analysis (BIA) is an approach to study the composition of biological tissues [1]. This analysis is generally made by applying a single or multi-frequency current signal to the object under study and then measuring the resulting voltage. Bioimpedance measurements can also be performed by applying a voltage signal and then measuring the resulting current [2], [3]. Bioimpedance has proven to be a very useful, safe and noninvasive technique to detect different types of pathologies such as Alzheimer [4], obesity-associated metabolic derangements [5], malnutrition [6], cancer [7] and to monitor interventions for swelling in minor burns [8]. BIA has been also applied as a principle for development of new medical devices such as the one presented in [9], which was designed to measure the amount of drug released by a transdermal delivery. Another novel device based on BIA is the proposed in [10], which was conceived to detect the arrival of pressure pulse waves in the arteries of the cardiovascular systems. BIA has been also applied to detect intravenous infiltration [11], which is the unintended delivery of fluids into the extravascular space instead of into the vein.
One of the main components of a bioimpedance equipment is the current source which is composed of two main elements: (i) a sinusoidal signal generator and (ii) a current driver converting a voltage signal into a current. In an ideal case, the transfer function of the second element must be a constant value for all frequencies and any load impedance. To reach this goal, the current driver must have high bandwidth and high output impedance [12]. Nowadays, a great effort is devoted to improve the performance of current drivers.
The trends to design current drivers can be broadly classified into two main groups. The first one and the most widely found is based on the usage of discrete elements like operational amplifiers and feedback networks composed of resistive elements, and in some cases, of a combination of resistors and capacitors, as in [13], [14], [15]. The most well known current drivers are those proposed by Howland [16], [17], [18], [19], [20], Tietze [12] and the current mirror topology [21]. The performance of all these current drivers is limited by two factors: internal capacitances [22] and non-linearities like slew rate, which appear in the operational amplifier at high frequencies. Several works have been devoted to increase both bandwidth and output impedance of the current sources by modifying the feedback network of the operational amplifier or including additional operational amplifiers as in [23], [24], [25]. All of these solutions have in common the increase of analog circuitry with the disadvantages involved in the implementation of electronic systems with discrete elements. The second trend in current driver design is to implement them in application specific integrated circuits (ASICs). In [26] the authors propose a device based on an operational transconductance amplifier (OTA) implemented in a CMOS integrated circuit. The system includes a negative feedback current loop to overcome the problem of decreasing output impedance as the frequency increases. The current driver presented in [27] is based on the same working principle as [26], but instead of one feedback loop, it uses two of them. Despite of it, the output impedance of [27] is considerably less than that reported in [26]. The architecture presented in [28] is also based on [26], but it solves a problem occurring in all current drivers, which is the phase delay in the output current signal at high frequencies. Other CMOS-based current sources have been proposed as a part of more complex biomedical devices. In [29], the current source is a component of a bioimpedance spectroscopy systems, and in [30] the current source is embedded in an analog front-end for physiological signal recording.
Current sources have been also implemented in Field Programmable Gate Array (FPGA) devices. In [31] the designed device generate a square wave but not a sinusoidal signal as required by bioimpedance studies. In [32] a FPGA based current source is proposed. The current flowing to the load is sensed by using a shunt resistor and the resulting voltage is compared with a reference value, and depending on the result of the comparison, the gain of a programmable amplifier is increased or decreased. However, the authors did not report how such gain is calculated.
Regardless of the approach used, discrete element or ASIC oriented, all current drivers rely on feedback mechanisms to achieve the objective that their transfer function approximates a constant value with zero phase delay for the widest possible range of loads and frequencies. The aforementioned approaches are centered in one component of a current source which is the current driver. Thus, the philosophy of those works does not involve the manipulation of the output of the sinusoidal signal generator. In this paper we propose to manipulate the amplitude of the sinusoidal signal to ensure a current of constant amplitude through the load. This amplitude is calculated by using a nonlinear discrete time closed loop algorithm which uses as inputs: (i) the desired current amplitude, (ii) the current flowing through the load and (iii) the amplitude of the signal given by the sinusoidal generator in the previous sampling instant.
The current source presented in this paper is fully implemented in a system of configurable analog and digital blocks (PSoC-5LP), not requiring any external element other than a shunt resistor to monitor the current through the load. The first current driver using a programmable device of mixed signal commercially available was implemented in [33].A novelty aspect of the our system is the use of current digital to analog converters (IDACs) instead of the classical voltage based digital to analog converters (VDACs). The use of IDACs entails two main advantages. First, a bipolar power source for the electronic system is not required, and second, the load is not connected to ground allowing the use tetrapolar electrodes. From a theoretical point of view, the main contribution of the paper is a new control algorithm guaranteeing a constant amplitude sinusoidal current in a load of unknown value.
This paper is composed of seven sections. Section 2 presents current drivers from the perspective of closed loop control systems. Section 3 explains the proposed nonlinear discrete time control algorithm and a mathematical proof of the convergence of the current through the load towards its desired value. Section 4 describes the architecture of the proposed current source. Section 5 presents the experimental results obtained with the implemented prototype. Section 6 contains the discussion of the results and the final section, Section 7, is devoted to the conclusion.
2. CURRENT DRIVERS FROM A FEEDBACK CONTROL PERSPECTIVE
Figure 1 shows the classical approach for current source implementation. The voltage v s , which is the output of the sinusoidal signal generator, remains unmodified during a current injection experiment and by consequence the performance of the current source relies on the output impedance and on the bandwidth of depicted in Figure 2, the voltage v s is modified by a closed loop controller to produce a current of desired amplitude i d in a load of an unknown value.
Figure 1 Decoupled approach for current sources implementation. The input voltage v s to the current driver remains independent of the output i L (value of the current in the load).
Figure 2 Coupled approach for current sources implementation. The input voltage v depends on the current i
In Figure 2, the current driver can be implemented by using either a discrete element or an ASIC oriented approach. The block named Amplitude Control in Figure 2 is any electronic device or a sampled data system guaranteeing the stability of the closed loop system and also the convergence of i L towards the desired current i d . Based on the closed loop system illustrated in Figure 2, we propose a classification of closed loop control schemes for current sources, depending on the meaning of the variables i d and i L .
2.1 The tracking signal approach
In this approach i L is the instantaneous value of the current in the load. The reference i d must be a sinusoidal signal indicating the desired value of i L at each time instant. The purpose of the block named Amplitude Control in Figure 2 is to guarantee the converge of the signal i L (t) towards i d (t).
2.2 The amplitude control approach
In this approach i L is the amplitude of the current in the load. The reference i d is the desired value for i L . The block Amplitude Control, corresponds a sampled data system then the sampling time h must be equal to the period T o of the signal given by the current driver. This is due to the fact that the amplitude of a sinusoidal signal can be changed at most once per period.
As shown in Figure 3, the control v s (kh) (k = 0, 1, 2,...) is the amplitude of the sinusoidal signal applied to the load during the time interval [kh, kh + h].
3. THE PROPOSED DISCRETE TIME CURRENT CONTROLALGORITHM
The current source presented in this paper is based on the amplitude control approach and not in the tracking signal approach because the first one allows to generate signals of higher frequencies than the second one. The proposed control algorithm is described by the following nonlinear difference equation:
The initial value v s (0) needs to be greater than zero to avoid the null control signal. Singularities when i L (kh) = 0 are avoided by limiting the maximal value of v s (kh). Z L (ωo) represents the total load seen by the current source. That means the contact impedance plus the impedance of the object under study.
Proposition 1. If ω o is the frequency of the sinusoidal signal to be injected to a load impedance with magnitude Z L (ω o ), then the control described by (1) converges for any v s (0) ≠ 0, to a value v s * = i d Z L (ω o ) guaranteeing that the steady state amplitude of the current through the load equals to the desired value i d .
Proof. If the block Amplitude Control, in Figure 2, is defined by equation (1), then the dynamics of the closed loop system is obtained by replacing i L (kh) by v s (kh)/Z L in (1)
The solution of (2) can be obtained by induction from v s (h), v s (2h) and vs(3h)
By taking the limit of (3) as k tends to ∞, we obtain
The above equation indicates that the control law (1) converges to the voltage v s required to obtain a current i L equal to i d . From the perspective of automatic control point of view, the controller (1) leads to a closed loop system globally asymptotically stable for any v s (0) ≠ 0.
4. ARCHITECTURE OF THE CURRENT SOURCE
In this section we present a current source based on the approach depicted in Figure 2 and implemented in the mixed signal device PSOC 5LP. The non-linear difference equation (1) is implemented as a software component running in the microprocessor of the PSOC system.
4.1 Digital to analog current converters
To produce the required sinusoidal voltage signal, the proposed current source uses digital to analog current converters or IDACs instead of the classical voltage based digital to analog converters (VDACs). There are two main reasons for this choice. Firstly, in PSOC 5LP IDACs are faster than VDACs. For the formers the maximal updating frequency is 8 MHz and for the laters 1 MHz. Secondly, the output voltage of the VDACs can be configured only in one of two possible ranges, either (i) from 0 to 1,02 volts or from 0 to 4,08 volts. Additionally, by combining an IDAC and a current to voltage converter (I2V) of programmable gain a wider variety of output voltages can be obtained. For example,by fixing the output current of the IDAC to the range 0 to 31,875 µA and taking into account that in PSOC 5LP the feedback resistor of the I2Vs must be one of the following values: 20 kΩ, 30 kΩ, 40 kΩ, 80 kΩ, 120 kΩ, the number of output voltage ranges increases up to five.
In PSOC 5LP an IDAC can be commuted between source and sink modes in running time, allowing the generation of currents that change direction, as required in bioimpedance studies. Unfortunately, the time required to complete this operation seriously limits the maximal frequency of the sinusoidal signals that can be generated. Our proposal to generate a bipolar voltage signal uses two IDACs and two I2Vs. Figure 4 shows the electrical connection between the two IDACs and two the I2Vs. The two IDACs, denoted as IDAC+ and IDAC-, are configured in source mode. The IDAC+ generates current only during the positive cycles of the sinusoidal signal. The IDAC- generates current only during the negative cycles of the sinusoidal signal. Thus,both IDAC+ and IDAC- generate positive currents defined as follows:
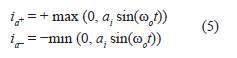
Figure 4 Bipolar voltage source composed of two digital to analog current converters (IDACs) and two current to voltage converters (I2Vs).
In Figure 4 the DC voltage v o is defined each time the value of R fi is changed to guarantee that the input voltage to the buffer amplifiers is non-negative, thus, not requiring bipolar power supplies. The voltages v a and v b are defined by the following expressions:
Figure 5 presents the waveform of the voltages va, v b and v a - v b of the circuit depicted in Figure 4. The difference v a - v b corresponds to a sinusoidal signal whose amplitude depends on the amplitude of the currents i a+ and i a- and on the value of the feedback resistor R fb :
Figure 5 Voltages v a , v b , v a - v b in Figure 4. The variable T o is the period of the sinusoidal signal.
Both IDAC+ and IDAC- have a resolution of 8 bits. Thus, the total resolution of the circuit depicted in Figure 4 is 9 bits.
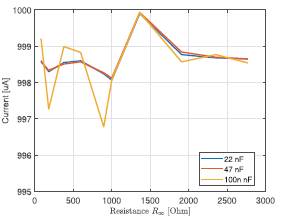
Figure 8 Amplitude of the current flowing to the load as a function of the resistance Ro and the capacitance C1 of a Cole's type load. The frequency is 1 kHz and the desired current is i d = 1000 µA.
4.2 General block diagram
A block diagram of the proposed current driver is depicted in Figure 6. The block labeled Eq. (1) contains the algorithm described in the section 3. The variable i L is an estimation of the amplitude of current flowing to the load, which is calculated from the voltage v shunt measured in the shunt resistor Rs. The variable v shunt is converted by the analog to digital converter block ADC. The block Parameters calculates both, the amplitude a i of the sinusoidal currents i α+ and i α− generated by the IDACs and the gain R fb of the voltage to current converters I2V+ and I2V−. As this current source is based on the amplitude control approach, both Eq.(1) and the block Parameters are executed once for each period of the sinusoidal signal being generated. The values of ai and R fb are calculated by using the following procedure:
The value v s (kh) given by (1) is used to calculate the value of the R fb required to obtain v s (kh) = R fb α max , with α max = 31,875 μA being the maximal current given by the IDACs.
As in PSOC 5LP the values of R fb are restricted to the one of the following values: 20kΩ, 30kΩ, 40kΩ, 80kΩ, 120kΩ, the selected R fb is the minimal one satisfying R fb α max ≥ vs(kh).
The amplitude ai is calculated as the quotient between v s (kh) and the resistance of R fb obtained in the step two of this procedure.
5. RESULTS
In this section presents the experimental results obtained with the proposed current driver, considering four types of tests: (i) current versus load for a Cole's type load, (ii) current versus frequency for a fixed resistive load, (iii) output impedance and (iv) total harmonic distortion versus load for a fixed frequency. The current through the load is estimated by reading the voltage at the shunt resistor Rs = 100 Q with a digital oscilloscope (Tektronix TBS 1052B).
5.1 Current versus load resistance for Cole's type load
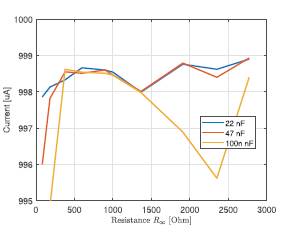
Figures 8, 9 and 10 present the amplitude of the current as a function of the resistance R∞ and the capacitance C1 of the model depicted in Figure 7. The following frequencies were considered: 1 kHz, 50 kHz and 120 kHz. The value of R1 is fixed to 180 Ω. In all the three Figures, the values of the resistance R∞ are: 81 Ω, 181 Ω, 378 Ω, 596 Ω, 896 Ω, 1000 Ω, 1364 Ω, 1908 Ω, 2350 Ω, and 2770 Ω.
5.2 Current versus frequency
Figures 11 and 12 present the amplitude of the generated current as a function of the frequency.
Figure 11 Amplitude of the generated current as a function of frequency for a load resistance of 378 Ω. In color blue the plot for i d = 500 µA and the red one for i d = 1000 µA.
Figure 12 Amplitude of the generated current as a function of frequency for a load resistance of 3100 Ω. In color blue the plot for i d = 500 µA and the red one for i d = 1000 µA.
The following resistances are used as loads: 378 Ω and 3100 Ω, respectively. In both cases, the values of the frequencies are: 0.1 kHz, 1 kHz, 5 kHz, 10 kHz, 30 kHz, 53 kHz, 80 kHz, 95 kHz and 120 kHz.
5.3 Output impedance
Figure 13 presents the Norton's equivalent of the current source. The output impedance is calculated experimentally by using linear regression analysis.
5.2 Current versus frequency
Figures 11 and 12 present the amplitude of the generated current as a function of the frequency.
The current i L through a load R L connected to a current source of value i d with output impedance R 0 , can be calculated as follows:
If RL, i d and i L are known values, then the equation (6) can be easily transformed into the linear equation (7), which relates the current error i d - i L and the measured voltage R L i L through the constant R 0
The linear regression for the data presented in Figure 14 gives the curves presented in Table 1. Figure 14 shows that for the proposed current source the relationship between i d - i L and R L i L is not a straight line and by consequence the output impedance is not constant but dependent on the load R L and on the frequency.
Figure 14 Plot relating the current error i d - i L and the measured voltage R L i L . The data does not fit a straight line as expected in a linear current source.
5.4 Harmonic distortion versus load resistance
The total harmonic distortion of the current through the load was calculated by using the Matlab function thd. The samples of the current signal were collected by reading the voltage in the shunt resistor R s of Figure 6.
This voltage was measured by using a digital oscilloscope (Tektronix TBS 1052B).Figures 15 and 16 present the harmonic distortion as a function of the load resistance for i d = 500 µA and i d = 1000 µA.
6. DISCUSSION
The current source presented in this paper uses a feedback control approach to produce a current of desired amplitude and frequency in a load of unknown value. The design combines a software element, which is represented by the nonlinear difference equation (1), and hardware elements like programmable gain amplifiers, IDACs, and one VADC, all of them integrated in a mixed signal chip (see Figure 6). From Figures 8 to 10 it can be seen that the proposed device maintains a constant current through load variations. In Figures 11 and 12 it can be observed that current is almost constant as frequency varies from 100 Hz to 120 kHz. These experimental results suggest that the proposed device is a proof of concept for current sources based on the working principle presented in Figure 2.
The maximal frequency generated by the device is limited by the highest frequency of PSOC 5LP IDACs, which is of8 MHz. By considering 52 samples per period, the maximal frequency of the sinusoidal signal generated is limited to 153,85 kHz (8 MHz/52). In addition to generating the sinusoidal signal, the PSOC device must recalculate the amplitude of the generated signal by using (1) and to read the analog to digital converter that monitors the current in the load, once per period. All these tasks performed in the same device decrease the maximum frequency up to 120 kHz. However, it is important to clarify that this limitation is not inherent to the approach presented in Figure 2, but to the device used for the implementation.
The output impedance is an aspect of capital importance in current drivers [22], [26], [27], [28] because it guarantees that its gain is not affected by the impedance of the element connected to its output. However, the maximal load is not mainly limited by the output impedance of the current driver but by the output voltage it can produce across the load. For example, in a driver operating a 10 V, the product between the current and the load cannot exceed this value regardless of whether the output impedance is 1 MΩ or 10 MΩ. In the proposed device there is no current driver, and a constant amplitude sinusoidal current flowing to a load of unknown value is guaranteed by the changes in the amplitude of the sinusoidal signal v s delivered by the controller (1). As in the case of the current driver approach, in our design the maximal load is also limited by the maximal voltage produced by the circuit of Figure 4, which equals to 4,0625 V. If in Figure 2 the controller ensures the exact convergence of i L towards i d for a given range of frequencies, currents and loads, then the steady state output impedance of the current source is theoretically infinite for those values. In practice, the convergence of i L is limited by the precision with which the voltage v is generated and with which the current i L is estimated. For the implementation in PSOC of the control approach of Figure 2, the difference between the desired and the measured currents is caused by the quantization of the two IDACs and of the ADC reading the voltage at the shunt resistor. Another source of error is the limited number of feedback resistors R used in Figure 4. The linear regression for the data presented in Figure 14 shows that for the proposed current source the relationship between i d - i L and R L i L is not a straight line and by consequence the output impedance is not constant but dependent on the load R L and on the frequency of the generated signal. This nonlinear behaviour is caused by the three steps computation procedure presented at the end of Section 4.2. For this current source the average output impedance ranges from 410,54 kΩ to 966,56 kΩ, which is close to the values obtained by [19], [27] and [34], but below as compared to that reported in [28].
The total amplitude harmonic distortion is greater for low impedance loads (see Figures 15 and 16). This phenomenon is originated by the quantization of the IDACs. Low currents through low impedances require of sinusoidal signals of small amplitude which are generated by using only the least significant bits of the IDAC register. For example, to circulate a current of 500 µA through a resistance of 378 Ω requires a sinusoidal signal with an amplitude of 189 mV. Considering that the lowest value of R fi is 20 kΩ, the peak amplitude of the current produced by the IDACs must be 9,45 µA, which implies that only the 6 least significant bits are used.
The proposed approach for current sources implementation guarantees that the amplitude of the current through the load is equal to its desired value i d . However, the proposed device does not control the phase of the current in the load. The sinusoidal signal v s generated by the controller of the Figure 2, always has zero phase angle. It implies that the phase of i L remains dependent on the capacitance of the load and on the working frequency coo. The lack of phase control in our current source does not prevent its usage in BIA, because the phase plot can be obtained from the gain plot, providing that the load is a linear, stable and minimum-phase system. In [35] the authors propose a method to obtain phase information from magnitude measurements based on the Kramers-Kronig transform. Additionally, techniques to extract the parameters of single and double dispersion Cole models from magnitude response measurements have been respectively proposed in [36] and [37]. Furthermore, some BIA rely only on amplitude measures as in [38] and [39].
CONCLUSION
An alternative working principle for current source design has been proposed. It is based on a discrete time nonlinear algorithm ensuring the convergence of the measured current towards its desired value. The algorithm does not require any parameter tunning. The proposed approach was implemented in a mixed signal device, obtaining low differences between the desired and the measured current for frequencies near to the maximal frequency that the IDACs can operate. Future works will be devoted to enhance the nonlinear algorithm to control both the amplitude and the phase of current in the load. Another aspect that will be addressed is the system used for the implementation of the current source.

