


 English (pdf)
 Article in xml format
 Article references
 Send this article by e-mail
 Cited by SciELO
  Cited by Google
  Similars in
SciELO
Similars in
SciELO  Similars in Google
 Permalink
1. INTRODUCTION
The presence of correlated variables is very frequent in studies of applications in different areas of knowledge. For example: in actuarial sciences, they are used to model mortality and dependent losses; in finance, they are used in the allocation of assets, modeling and administration of risk levels, and credit rating; in biomedical studies, they are used for the modeling of correlated data and competitive risk models or survival models; in engineering, they are used to model the control of multivariate processes and hydrological studies; in education, they are used to analyze the quality of education (Bustos and Guerrero, 2011, Cepeda-Cuervo and Nuñez-Antón, 2013). Ignoring this dependence on the adjustment of the data can lead to erroneous and unreliable inferences. This is the reason why it becomes important to know alternative methods to study the lack of independence between random variables.
Copula functions are a tool for modeling and measuring the dependence between random variables with given marginal distributions, allowing the modeling of association measures by different methods (Erley, 2009). The underlying idea behind the copula is that, once the joint distribution of certain variables Xand Y is known, it becomes unnecessary to use any artificial unit to describe each of the variables. In this way, copulas are useful tools to model and simulate random variables that have some type of dependence.
The main objective of this article is to illustrate how a copula can be used to model the dependence of two random variables, so the article has statistical interest mainly. However, we wanted to support our construct with the use of real variables that were of practical interest. The data of the SABER11 test were appropriate for our purposes by offering two variables of great interest in learning: the scores in Mathematics and Critical Reading, for students between 14 and 24 years who presented the afore- mentioned test in the Department of Tolima.
We believe that one of the epistemological obstacles in the learning of mathematics is the difficulty in handling a language that allows to understand mathematical concepts. Part of the lack of language management is based on the lack of a rich vocabulary and poor reading habits. For this reason, we believe that standing out the high dependency between these two variables, we are contributing to stand out the need to promote good reading habits.
Therefore, our process of construction of a copula uses as marginal variables those already mentioned: scores in reading and mathematics. Initially we tried to model these marginals through a beta regression, so we transformed them to a scale in the interval (0,1). Later we observed that the transformed variables could be considered as truncated normal and, even more, in spite of the truncation they could be adjusted by normal distributions in a high degree. For this reason the article ends up constructing copulas by means of normal marginals.
Different algorithms provided by the R software were tested and finally we selected the one that gave us the lowest AIC. It was the bivariate Gaussian algorithm . Using this algorithm we simulate data to compare the results with those obtained in the construction with the real variables. This step was taken as a verification of the quality of the built joint distribution.
2. THEORETICAL FOUNDATION
2.1 Copula functions
The theory of copula functions has become a very powerful tool in many fields, especially when multivariate dependence is of great interest (Nelsen , 1999, Cepeda-Cuervo et al., 2012).
Definition: A copula, C, is a multivariate distribution function whose marginal distributions are uniform in [0, 1]. In the bivariate case, C(u, v) = p[U ≤ u,V ≤ v] is a bivariate function defined in [0, 1] 2 → [0, 1] that verifies the following three properties.
i. C(u, v) is an increasing function for each component.
ii. C(u, 1) = u, C(1, v) = v and C = (u, 0) = 0 =C(0, u).
iii. C is 2−increasing, in the sense that, Ɐu 1 ≤ u 2 and v 1 ≤ v 2 , C (u 1 , v 1 ) + C (u 2 , v 2 ) − C (u 1 , v 2 ) −C (u 2 , v 1 ) ≥ 0.
Sklar’s Theorem (1959): For any n− dimensional distribution function with marginals F 1 , . . . , F n , there is an n−dimensional copula C such that
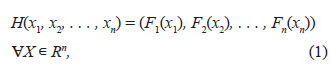
According to this result, when we have, for example, H(x, y) = C(F X (x), F Y (y)), the joint probability is shared between marginals and a copula, so that the latter only represents the association between X and Y. The copula separates the marginal behavior (represented by the F i ) of the set, unlike what happens in the usual representation of joint probabilities via the distribution function. For this reason, copulas are called dependency functions.
If the marginal distributions are continuous, the copula C is unique. If not, C is determined on Ran(F X ) × Ran(F Y ). Therefore, using copulas, it is possible to create bivariate distributions with defined marginal distributions. In this way, if C is a copula and F X , F Y are two marginal distributions, C(F X (x), F Y (y)) is a bivariate distribution.
The choice of the copula is determined by the data’s nature, due to the different types of copula functions and the difficulty for finding a clear classification of them. There are, for example, elliptic copulas, Normal (gaussian) copulas, Student and Archimedean copulas , among others.
For example, a Gaussian copula is defined as follows: Let Φ be a standard uni−dimensional normal distribution function, and let Φ n Σ be the standard normal n-dimensional cumulative distribution function with positive definite correlation matrix Σ. Then the Gaussian n− dimensional copula C Φ Σ is defined as:
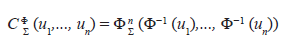
for all (u 1 , u 2 ,..., u n ) ε [0, 1] n .
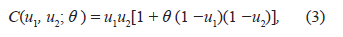
In this way, a bivariate copula (n = 2) would be defined as:
with (u 1 , u 2) ε [0, 1]2. In this case θ 12 = ρ 12 represents the coefficient of association in the bivariate standard normal distribution.
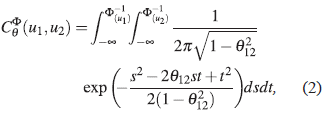
Another suitable copula function for studying the dependence between two random variables is the one that is based on the family of distributions, so called Farlie-Gumbel-Morgenstern (FGM). This function is determined as:
where θ is a measure of dependence between marginal distributions with −1 ≤ θ ≤ 1.
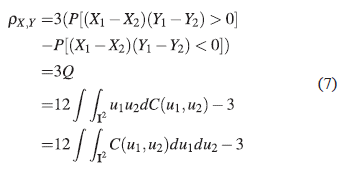
To interpret the dependency of the parameter θ, we can examine the possible relation between the parameter and some association coefficients, such as, Kendall’s Tau(τ) and Spearman’s Rho(ρ) (Cepeda-Cuervo et al, 2012).
2.1.1 Nonparametric measures of dependence
Here we can see the copulas role in the study of dependence and the relationship with nonparametric dependence coefficients such as Spearman’s rho and Kendall’s tau. The form of dependence provided by these coefficients is based on the definition of concordance. The most important property of the two measures is that they remain invariant by means of strictly increasing applications that act on the random variables (Cepeda-Cuervo et al, 2012).
Kendall’s Tau
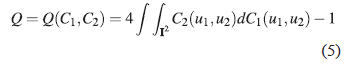
Let (X 1 ,Y 1) and (X 2 ,Y 2) be continuous and independent random vectors with joint distributions H 1XY (x, y) and H 2XY (x, y) respectively and common marginals FX and FY. Let C 1 and C 2 be the copulas of (X 1 ,Y 1) and (X 2 ,Y 2) respectively, then Q is the difference between the concordance probability and discordance probability. That is:
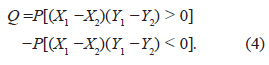
Then
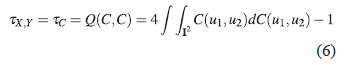
Let X and Y be continuous random variables whose copula is C. Then the population version of Kendall ‘s Tau coefficient for X and Y is given by:
3. MATERIALS AND METHODS
3.1 Description of the data
Since 2010, a second process of reconceptualization and alignment of State exams, Saber 11° and Saber Pro, has started, which culminated in the application of a new Saber 11 state test in the second half of 2014. The objectives of This test is summarized in the following: a) Select students for higher education, b) monitor the quality of training offered by secondary education establishments, and c) produce information for the estimation of the added value of higher education. Currently, the Saber 11 state examination consists of five tests: critical reading, math, social studies, science and English (http://www.icfes.gov.co).
In this article, we studied the dependence between the performance in the math and critical reading tests for the students between 14 and 24 years old who completed the exam in 2016, with a sample of size 17210 after debugging the original database. The measures of association to study dependence were Spearman's rho and Kendall's tau.
The variables scores in math and critical reading are bounded in the interval (a, b), where a, b are known scores with a < b. To adapt the obtained data to an interval (0, 1), which is our study objective, we use
 instead of Y directly. However, this linear transformation can take the extreme values 0 and 1. We avoid this, carrying out the transformation,
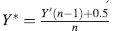 proposed by Smithson and Verkuilen (2006) where n is the sample size. So, the scores are defined at a scale in the open interval (0, 1).
This work is developed in essence by following the next two methodological steps:
The construction of two variables Y 1 and Y 2 (score in mathematics and critical reading score) over a bounded interval. As it was said before, this was done thinking about using the beta distribution, although finally it was decided to use normal truncated distributions approximated by a general normal.
Construction of an appropriate bivariate copula function, in our case it was the normal (Gaussian).
3.2 Copula selection
The normal character of the marginal functions allows to use several methods of construction of the copulas. In particular, the different methods presented by the VineCopula package of R. The different methods were tested and the one that provided the lowest value for the Akaike Information Criterion was selected.
3.3 Simulated data
As a verification of the quality of the results obtained in the previous stage, a data simulation was made using the parameters obtained in the construction process. 17210 data were simulated for the bivariate copula. Normal marginals were assumed for each variable of the multivariate distribution. The estimations of the parameters obtained by the real data were used: (
 = 0.72) for association and the parameters of the marginal ones: (
 = 0.4411, σˆ = 0.1679) for critical reading and (
= 0.4634, σˆ = 0.1640) for mathematics. The copula software package R was used in the estimation process.
= 0.4411, σˆ = 0.1679) for critical reading and (
= 0.4634, σˆ = 0.1640) for mathematics. The copula software package R was used in the estimation process.
3.4 Estimation methods
To estimate the parameters of the simulated copula and its marginals, we used 4 estimation methods provided by the software R which are briefly described below:
Itau: It is the inverse of Kendall's tau estimator. The data can be in [0, 1]d, (either they be the true data or pseudo-observations of the underlying copula to be estimated) or in the a-dimensional space.
Irho: It is like the "itau" method, but it uses Spearman's rho instead of Kendall's tau.
Mpl: Pseudo-maximum likelihood estimator, which is based on "pseudo-observations" in [0, 1]d, typically obtained throughpobs() function.
Ml: It is similar to the "mpl" method but uses a different variance estimator. The data must be assumed as observations of the true underlying copula whose parameter must be estimated.
4. RESULTS
To interpret the dependency of the parameter θ, we can examine the possible relationship that exists between the parameter θ, and some association coefficients, such as Kendall’s tau (τ) and Spearman’s rho (ρ). Figures 1 and 2 show the existence of an association relationship that is positive.
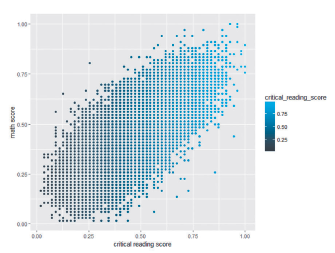
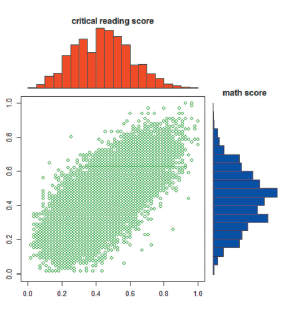
Figure 1 shows that there is a high positive association between the scores in mathematics and critical reading. This fact can be verified numerically by the following association measures: Kendall’s tau (τ=0.5470) and Spearman’s rho (ρ* = 0.7287).
Figure 2 shows that histograms are apparently normal-shaped, so the best fit could be achieved by means of Gaussian copulas.
The results of the 17210 simulated data show a dependence very similar to the original data with a value of 0.71 (see Figure 3), and it also has a Gaussian form, as is also observed in the real data (see Figure 4).
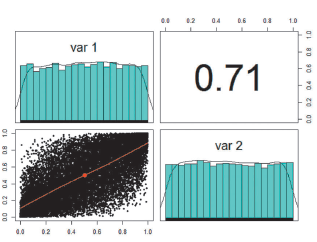
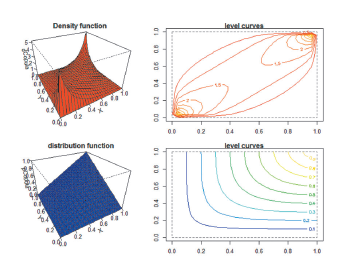
Figure 4 Density function (red color), distribution function (blue color) and their respective level curves for bivariate copula.
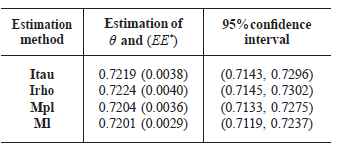
Different methods of estimation through simulation studies produce the results of the Table 1. Table 1 shows that the estimation method that generated the closest estimate to the true value of the parameter (0.7201) is the maximum likelihood method (ml). In the same way, this method generated the lowest standard error (0.0029). Even more: the estimated confidence interval is more accurate. For this reason, we have chosen this method to analyze the parameters of the bivariate copula using normal marginals.
Table 1. Estimation of the dependency parameter by means of the different estimation methods. *EE refers to the Standard Error.
When assuming normal marginals for each variable of the bivariate distribution we observe (Figure 5 and Figure 6) that the dependence remains very similar to that of the real data.
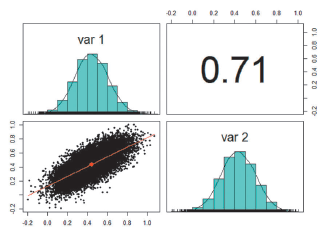
Figure 5 Pairplot for the dependency between the simulated variables X and Y using normal marginals.
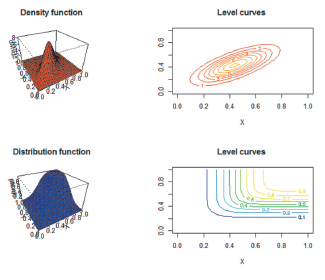
Figure 6 Density function (red color), distribution function (blue color) and their respective level curves for bivariate copula.
Regarding the association, it is obtained: Kendall's tau (t = 0. 5090) and Spearman's rho (p* = 0. 7003). This does not indicate a discrepancy since the one is a transformation of the other.
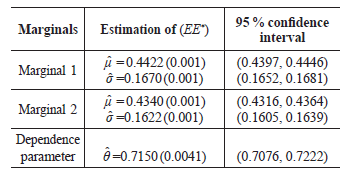
Table 2 shows the estimations of means and variances for each marginal and for the dependency parameter, very similar to the original ones.
Table 2 Estimation of the parameters of the bivariate copula using the ml method. *EE refers to the Standard Error.
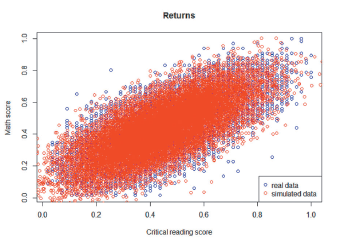
Finally, we compare simulated with original data under the assumptions of normal marginals and the dependency structure. As can be seen in Figure 7, the normal copula leads to results very close to the real observations. There are few extreme values comparing with real data; so we can conclude that this copula adequately models the data.
5. CONCLUSIONS
5.1 In this article we have showed that copula functions are extremely useful when we have a joint model of random variables with some kind of dependence, since they are functions that approximate this structure from their individual (marginal) tendencies, and the distributions that those marginals present.
5.2 The bivariate Gaussian copula function allowed capturing the dependency relationship between the variables involved in the study. When comparing real data with the simulated observations, it was observed that the behaviors are quite approximate.
5.3 Although initially the work had been planned to perform copulas with beta distributions and Generalized Linear Models, the excellent approximation of the variables Y 1 y Y 2 with Gaussian distributions allowed us to choose a Gaussian model-very close to what was proposed-and for which the processes of estimation are more expedited, given the ease of applying existing software.
6. RECOMMENDATIONS
Possible future extensions of this work could be:
6.1 Search in the SABER11 test scores, other variables that are highly correlated in order to explain their conjoint behavior. This may allow implementing programs to improve the overall performance of Saber 11 tests.
6.2 Use other copula functions such as Gumbel, Joe or Clayton and see which one gives the best results.
6.3 Apply a regression model to real data that not only have dependency between variables, but also temporal dependence.

