


 English (pdf)
 Article in xml format
 Article references
 Send this article by e-mail
 Cited by SciELO
  Cited by Google
  Similars in
SciELO
Similars in
SciELO  Similars in Google
 Permalink
1. INTRODUCTION
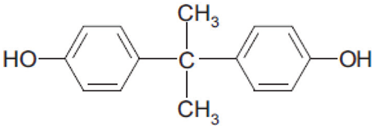
The BPA is an ingredient of plastic products and has been used for over fifty years. Chemically, it is an organic compound consisting of two molecules of phenol attached to a chain of three saturated carbons (Figure 1). It is in two chemical configurations and has other isomers depending on several positions of substituent or united by a nucleophile. These compounds are normally manufactured from phenol condensate with acetone under low pH and high temperature in the presence of a catalyst. A second is similar but uses different catalysts and a different purification technology that generates a larger amount of pollutant residues[1].
The BPA is an ingredient of plastic products that has been used for over fifty years. The BPA is a compound that persists in the environment and is an endocrine disruptor even in low concentrations[2][3]. It can alter the natural hormonal balance in ecosystems and, consequently, in humans[4]. For this reason, much attention has been given to the effect of BPA in water. The US Food and Drug Administration (FDA) has regulated its level in food, since it is used to make polycarbonate, a hard transparent plastic used in many consumer products [5]. The Environmental Protection Agency [6][7] and the European Union, through the European Food Safety Agency (EFSA), set a permitted level of 4 μg/Kg [8]. Several methods have been proposed for the elimination of this compound in the environment. Among these, advanced oxidation processes (AOPs) are considered as a clean degradation alternative due to their use of oxidation reactions with reactive oxygen species, and can even lead to the mineralization of contaminants [9][10][11]. The molecular singlet oxygen 1O2 (1Δg) is generated through a process called photosensitization, which begins with the absorption of electromagnetic radiation by a substrate called "photosensitizer", which is able to transfer its energy to other molecules in order to access the electrically excited triplet state. This process from molecular oxygen to the triplet of basal state is known as Type II mechanism and is shown in Figure 2[12].
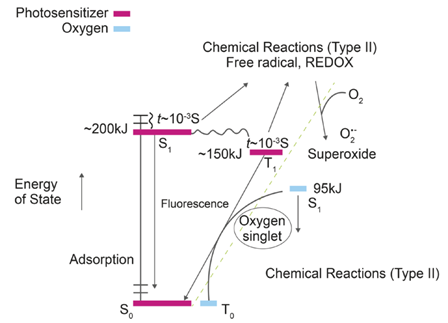
Figure 2 Generation of excited photosensitizer states and reactive dioxygen species. (Reproduced with permission from [13]Copyright (1995) Royal Chemical Society)
The success of the methodology lies in the use of a photosensitizer that has efficient inter-system crossing to the triplet state; thus, it can be established that it has a good quantum yield in the generation of singlet molecular oxygen. The mechanics of generating this excited state with oxygen require an excess of energy (approximately 94.2 KJ) for the electronic transition to take place. Colorants such as Bengal rose, methylene blue and EOS are some of the dyes that are considered good photosensitizers, and the last compound has a great quantum yield in ethanol around 0.57 [12] [14], thanks to this characteristic, the EOS was used as standard photosensitizer for the photodegradation of BPA.
The high sensitivity chromatographic techniques have been implemented to allow the monitoring of the efficiency of the oxidation process in terms of degradation. However, these methodologies require expensive equipment and relatively large amounts of organic solvents, leading to high contaminant discharges. The application of chemometric techniques to spectrophotometric data has allowed the rapid quantification of components in complex mixtures without the need for previous separation or complex pre-treatments that involve higher costs and excessive work [15].
For this reason, chemometric methods have become very important since they make it possible to analyze mixtures and statistically ensure the quantification of these. The main advantage of PLS regression is that it allows the treatment of large volumes of data and is a modeling solution with strongly correlated variables, taking both the spectra and the concentrations, thereby reducing the uncertainty of the analysis [16]. PLS has been very popular in areas like chemical engineering, where predictive variables often consist of many different measurements in an experiment and the relationships between these variables are ill-understood[17]. PLS is widely used by chemists and chemical engineers for spectrophotometric calibration purposes. Therefore, this research work proposes the use of chemometric tools for chemistry analysis and, in this case, to improve the robustness of singlet molecular oxygen during photodegradation of BPA in a homogeneous system with EOS as photosensitizer. The PLS method was used to quantify the monitoring of BPA in admixture with the photosensitizer. This measurement was performed in the UV-visible spectrophotometer. The application of this chemometric tool is important because this type of system can generate overlapping spectra that can affect quantification when only univariate calibration methods are used. It's important highlight that these methods is not conclusive, because need more data to give confidentiality at the measurements, but this research to look another alternative for the check the change in order in the photodegradation profile between BPA and EOS and use it like tool to support in the quantification of this kind of the pollutants.
2. MATERIALS AND METHODS
2.1 Reagents
99% BPA was purchased from Sigma Aldrich. For the standard photosensitizer, 99% purity EOS dye (2 ', 4', 5 ', 7' - tetrabromofluorescein) from Sigma Aldrich was used. MiliQ water was used for the preparation of the solutions.
2.2 Technique of determination
To determine the photodegradation percentage, each mixture was evaluated based on the changes in absorbance at λmax , using a single beam UV-visible spectrophotometer (Optizen Rose Scientific Ltd., Canada) with bandwidth: 2nm and cuvettes of 20mm quartz.
2.2.1 Univariate calibration
The concentration of BPA and EOS (photosensitizer) was measured individually to establish the wavelength range providing the most information about the compounds. The linear range of BPA and EOS is between 2 and 10 ppm. Each calibration curve was made in triplicate to ensure the accuracy of the analysis. The spectral runs were in the range 200-800nm, with a speed of240 nm/min and with sweeps every 4 nm.
2.2.2 Multivariable Calibration
For the PLS analysis it is assumed that every absorption taken represents a factor (explanatory or independent variable) that affects the response variable Y (explained or dependent), which in this case is the concentration of the compounds of the mixture if the absorbances are the product of a summation between the absorbance of EOS and BPA in the wavelength range where it absorbs EOS. The Beer-Lambert Law model was used for calibration standards containing l chemical compounds with the n-absorbance spectra [18]. For the analysis of the mixture, a spectral sweep was initially made using a 3k factorial design with a central point, with k = number of factors. This was made in order to carry out the calibration and the validation of the chemometric model [19].
The chemometric model was valued through Leave One Out Cross Validation (LOO-CV). This is made with the purpose of identifying the components that represent the calibration data, as well as other aspects associated with the predictive capacity of the chemometric model [20]. The mathematical procedure to determine the mean square root deviation (RMSE) of the LOO-CV to select the optimal number of PLS factors is:
Where p is the number of samples used for the compound, y i is the known concentration, and y is the predicted concentration. We used other statistical tools to analyze the samples, namely: Mean Square Error Prediction (RMSEP), that reflects all the variability involved in the model [16]; and Principal Component Analysis (PCA), defined as a procedure that converts a large number of correlated variables into new low dimension uncorrelated (even orthogonal) variables named Principal Components, which describe the greater variance as well as the scores of the data obtained [18][21].
The PLS regression transforms the matrix of predictors X of order n x p, with the help of the vector of responses Y of order n x 1, into a matrix of principal components [22]. This is so that, by including the effect of the response variable, it has better diagnostic capacity and is a better model for the output prediction [23]. The predictor variables are converted into orthogonal components, which represent the solution to the problem of multicollinearity and allows a reduction ofthe dimensionality ofthe space ofthese variables [22]. Moreover, this allows the treatment of large volumes of data and is a modeling solution for strongly correlated variables, taking both the spectra and the concentrations and reducing the uncertainty of the analysis [16].
For the development of the mathematical model, the free software Rstudio was used. This has specialized packages that allow the correct analysis of this data volume. Other Rstudio packages were used such as prcom, for the analysis of the main components; ggfortify, for the analysis of the Scores and Loading graphs; pls, for the PLS analysis, in which pcr was applied for the calibration and RMSEP for the validation.
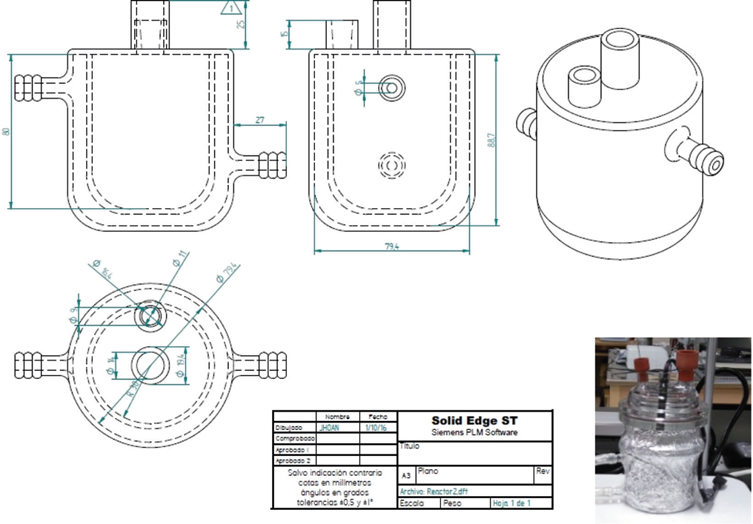
2.3 Preliminary tests for photodegradation
The proposed system for this reaction is a reactor of approximately 120mL (Figure 3). The reactor has an inlet at the top, specifically in the lid, for the lamp, another for the pH electrode and a third hole for taking samples with a septum. For the photodegradation of the BPA, a PENRAY UVP mercury lamp and the Neon Lamp were used for the initial photodegradation tests, and the direct photooxidation with BPA and EOS was analyzed with the substances individually and then mixed in a homogeneous solution. pH analysis was performed on the solution of BPA and evidence obtained that the pH of the solution throughout the experiment was maintained at 6.89, which is very consistent with miliQ water.
For the photodegradation analysis of BPA, starting from a standard solution of 40 ppm, an aqueous solution of 10 ppm of BPA was prepared. The sample was taken every 10 minutes, then the measurement was performed in the spectrophotometer. This test was done in triplicate to ensure the accuracy of the analysis. The wavelength chosen for the monitoring of BPA was at λmax: 284nm. In the case of EOS, a solution of 7 ppm was prepared, and the sample taken every 10 minutes. The wavelength chosen for the monitoring of BPA was at λmax: 524nm. For the preparation of the mixture, the same concentrations were taken and subjected to irradiation with the same lamp and monitored every 10 minutes for 100 minutes of exposure.
3. RESULTS AND DISCUSSION
3.1 Multivariate calibration.
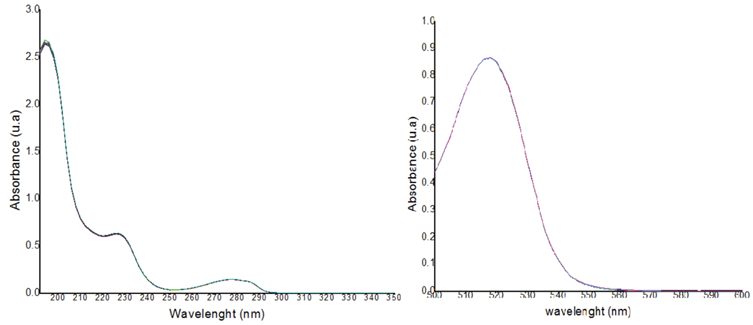
Initially, the calibration curves for BPA and EOS were performed in a range from 3 ppm to 10ppm, which is similar to what has been reported in the literature on the study of this type of contaminants in aqueous media [24]. For the univariate data it was possible to establish a linear range with an average coefficient of determination for BPA of R2 adj=0.9995 and for EOS of R2 adj= 0.99999. Therefore, it is possible to conclude that, with the established methodology using spectrophotometry, it is possible to quantify the compounds at low concentrations.
However, when trying to study the system in blends with the photosensitizer, it was evident that overlaps occur in some portions of the spectrum. Therefore, it became necessary to use the statistical tool PLS to determine the number of optimal factors that explain the greatest amount of information about what occurs in the reaction. This means that a spectral window is selected which will give the necessary information about photodegradation without being affected by the potential overlap.
In the Figure 4 shows that there was an overlapping portion between the BPA and EOS bands, which may give erroneous information about the photodegradation of the contaminant. Several research works exist that suggest that the best way to address these circumstances where there are mixes is the Benesi-Hildebrand equation. This proposes using a constant concentration of a metal and varying the concentration of the ligand ([ ]L), which results in a graph that relates to b/ΔA (ΔA is the difference between absorbance with or without ligand) against the inverse of the concentration of the ligand 1/[ ] L [25]. The value of Kf can be obtained with this linear graph by calculating the slope of the line, and with this value, the concentration of the other component of the mixture can be obtained. However, the main limitation of this type of method is that it is assumed that only one complex is formed, and it is possible that other complexes are formed in the same system that are absorbing at the same wavelength, resulting in erroneous reports. Therefore, in this case, multivariate analysis was carried out for BPA compared to the analysis of the mixture.
For the mathematical model, initially, it was intended to characterize BPA individually, to establish the window with the most information about this. Therefore, a spectral scan was performed from 200 to 800 nm, taking measurements every 4 cm-1. This yielded a total of 151 items of data, which were taken to a new coordinate system defined by the main components to be defined in an array X, which would give information about the covariance of the total data. At this stage, it can be concluded that the first three principal components represent the greatest variability of the data (approximately 97.83%), so the model is sufficiently robust to explain the behavior of BPA. Moreover, the most significant relation between them is concentration, which is directly related to the limit of detection. It is therefore ensured that the technique is appropriate for low levels of concentration. In addition to the PCA analysis it was established that the range with the most information about BPA is between wavelengths 190nm and 350nm.
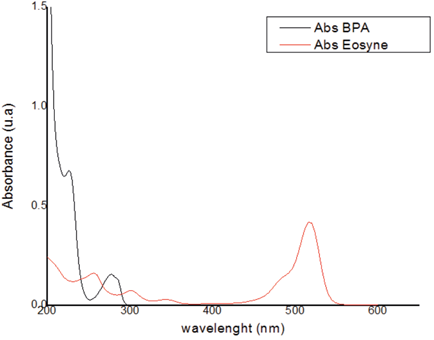
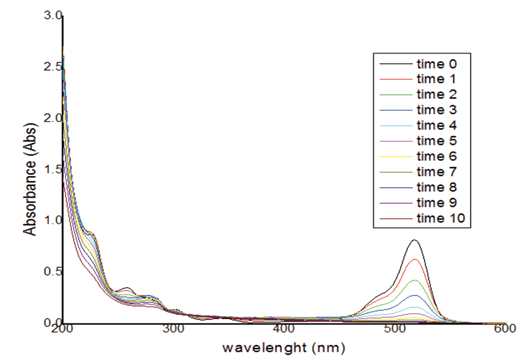
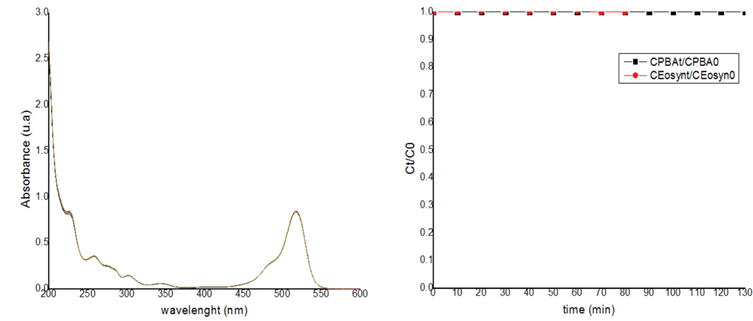
In the analysis of the mixture, 7 samples were taken with a 3k model with a point to the center. These were taken in a scan between 200 and 800nm, taking measurements every 2 cm-1 resulting in a total of 301 items of data, as shown in the figure 5. In the adsorption spectra taken for the tests, BPA does not absorb in the portion where the wavelength of the EOS. This provided valuable information making it possible to establish the best range to monitor the concentrations of the mixture.
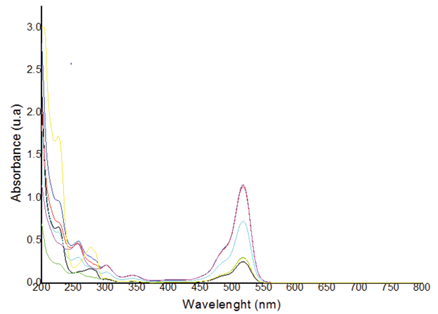
Figure 5 Absorption spectrum profile of BPA and EOS in homogeneous solution a several concentrations.
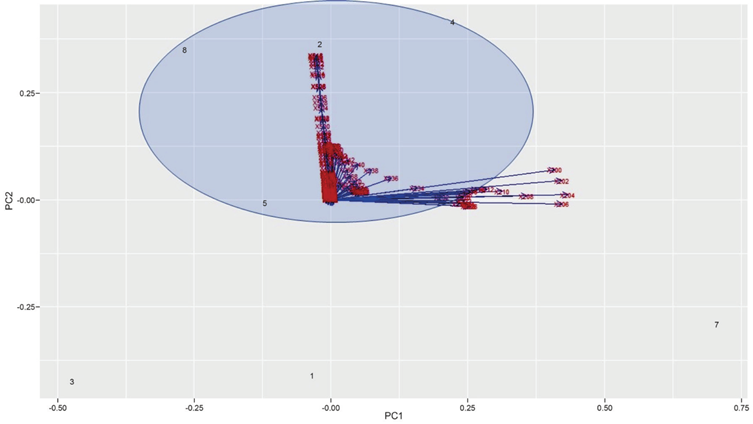
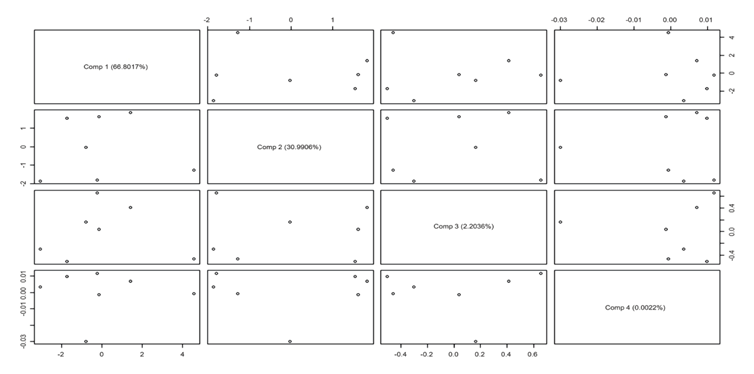
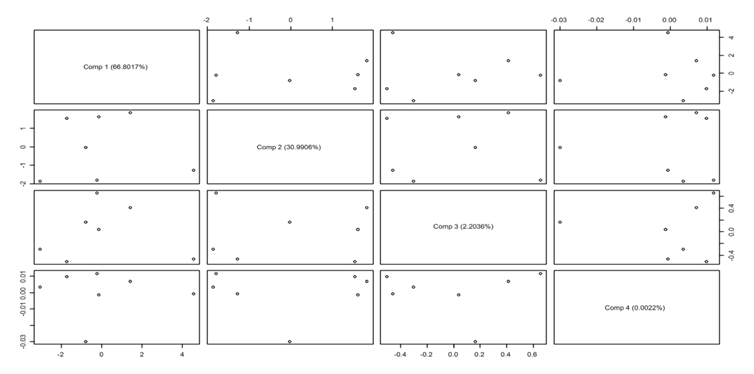
Initially, a main component analysis was performed on the samples obtained. This makes it possible to classify and condense the different signals associated with the 301 items of data and thus obtain a resulting variable that is a linear combination associated with the original data. From the analysis of the most representative components of the experiment we can conclude that the principal components 1 and 2 represent the highest variability of the data, at 93.99%. Therefore, it is more than sufficient to use only two components for the model. Furthermore, for the model the samples with the highest correlation are those with a similar concentration of EOS, as shown in the Scores and Loadings diagram in Figure 6.
In the table 1, the RMSE analysis of the calibration is shown, and its evidenced that component 2 represents the smallest variability in the experiment; in the figure 7 and the figure, shown the relationship between the measured and predicted values for both wavelengths of the compounds studied, from which a linear relationship can be intuited, although more data would be needed to confirm this.
Table 1 Determination of mean square error of prediction (RMSEP)
| VALIDATION: RMSEP Cross-validated using 5 leave-one-out segments. | ||||||
| (Intercept) | 1 comps | 2 comps | 3 comps | 4 comps | 5 comps | |
| CV | 0.4084 | 0.4896 | 0.007137 | 0.006549 | 0.010773 | 0.01287 |
| adjCV | 0.4084 | 0.4964 | 0.006626 | 0.006110 | 0.009978 | 0.01192 |
| TRAINING: % variance explained 1 comps 2 comps 3 comps 4 comps 5 comps X 63.430 99.78 100 100 100 Abs 2.846 100.00 100 100 100 | ||||||
| VALIDATION: RMSEP Cross-validated using 5 leave-one-out segments. | ||||||
| (Intercept) | 1 comps | 2 comps | 3 comps | 4 comps | 5 comps | |
| CV | 0.1057 | 0.07789 | 0.01078 | 0.002773 | 0.01235 | 0.01457 |
| adjCV | 0.1057 | 0.07210 | 0.01016 | 0.002653 | 0.01144 | 0.01349 |
| TRAINING: % variance explained 1 comps 2 comps 3 comps 4 comps 5 comps | X 63.43 99.78 100.00 100 100 | Abs 91.22 99.87 99.98 100 100 | ||||
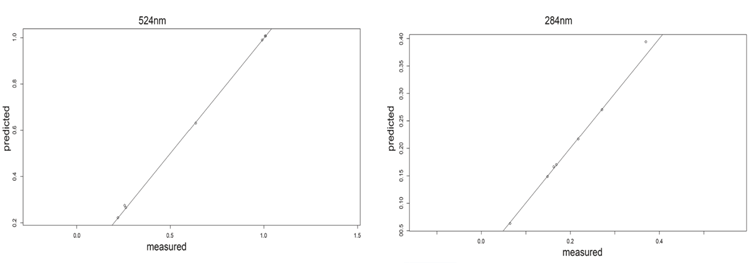
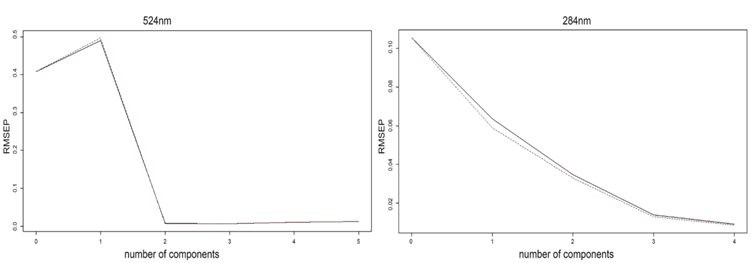
Figure 8 shows that the number of components chosen for each response allows the generation of a good prediction model because both curves are observed to be similar. The curve analyzed at the 284 nm wavelength (associated with the maximum wavelength for BPA), shows that it is possible to explain the prediction model with the first two components. For the 524 nm wavelength associated with EOS, it shows information about the original variables in the first two components.
The graphical scores in the Figure 9 were made to determine the degree of clustering and detect outlier points in the calibration data, in order to allow the construction of the model. This graph shows the percentage of variability of the main components. The data shows a wide variability. This coincides with what was obtained previously, since the values of all these possible combinations are given in the first two components, which represent approximately 100% of the proposed model, and makes it possible to be validated.
For the prediction of the model, the determination of the RMSE of the prediction for the measured and observed values in relation to the new data chosen for the validation was proposed. This process is carried out to corroborate that the prediction data of the model is adjusted to the actual occurrence in the experimental region. The absorbance is taken in the lengths 284 nm for the BPA and 524nm for the EOS.
The values obtained for concentration are very close in the experimental and prediction measurements of the model shown in the Table 2. This is evidenced by the relative errors which do not exceed 2.2%, considering that the sample size is small. For this reason, it can be stated that either of the two wavelengths evaluated (284 nm and 524 nm) may be considered optimal for monitoring the degradation profile. However, to minimize effects associated with signal formation due to mixing, a reference wavelength of 524 nm is preferred because in this region only the photosensitizer EOS absorbs.
Table 2 Values obtained with validation and predictions data
| Experimental design 3k | Measured vs predicted concentration | ||||||
|---|---|---|---|---|---|---|---|
| Conc. BPA (ppm) | Conc. EOS (ppm) | Measured conc. (284 nm) | Predicted conc. (284 nm) | % relative error | Measured conc. (524 nm) | Predicted Conc. d (524 nm) | % relative error |
| 10.0 | 2.0 | 11.32117 | 11.131127 | 0.1131 | 1.99364 | 2.004650 | 0.232 |
| 6.0 | 8.0 | 12.92701 | 12.940045 | 1.1567 | 7.70339 | 7.717685 | -3.658 |
| 10.0 | 8.0 | 16.86861 | 16.709858 | 0.6710 | 7.93644 | 7.979326 | -0.259 |
| 2.0 | 8.0 | 9.64234 | 9.602371 | 3.8012 | 7.89407 | 7.908689 | -1.155 |
| 6.0 | 2.0 | 7.89051 | 7.799074 | 0.2998 | 1.99364 | 2.000912 | 0.046 |
| 6.0 | 5.0 | 10.59124 | 10.563029 | 0.7605 | 4.95975 | 4.996822 | -0.064 |
| 2.0 | 2.0 | 4.31387 | 4.148324 | 1.0742 | 2.00424 | 2.015299 | 0.759 |
3.2 Preliminary photodegradation tests
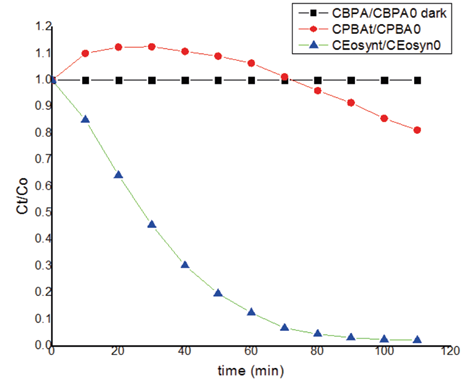
For the degradation tests, a 10 ppm concentration of BPA was taken and incorporated into the reactor described in Figure 3, where it was subjected to a mercury lamp. 2 mL samples were taken every 10 minutes to evidence the effect of light on the analyte. In the first instance, it was analyzed in the dark, so the results at 110 minutes did not show any reaction. After this, direct photodegradation tests were performed for EOS and BPA individually, in the case of the BPA was observed an upper signal, this phenomenon is possible for the formation of the new sub-products of the photodegradation that can absorbed in the same region. For the other side, the photodegradation direct occurred with a time difference: In the case of EOS, complete photodegradation was evident at 50 minutes while for BPA, changes were observed after 80 minutes of exposure totally and the BPA suffer a small photodegradation at the same time. All these results are shown in Figure 10, which shows the ratio of the concentration over time in relation to the initial concentration, versus time of exposure. It should be noted that these results are quite consistent, since the lamp used in these tests has an emission spectrum which can cover the entire absorption zone for both compounds.
After the individual analyses, the same experiment was performed with the mixture of the compounds (photosensitizer and pollutant), in order to try to explain accurately the reaction, which results were shown in Figure 11. The BPA was transformed by only 10% from 80 minutes to 120 minutes, except when the reaction was direct photo-oxidation, In the case of the EOS, the reaction was immediately and of course in the dark noting happened. Then in the figure 12, the reaction with the mercury lamp with the mixture is shown, which occurred in 10 minutes; however, in this case, the photosensitizer suffered photobleaching and the BPA change the signals, is possible for the formation the other compounds suggest transformation and consequentially photodegradation for 1O2. All these experiments evidence that the hypothesis made is correct and the Mercury lamp is efficient for reaction of the photodegradation [24][26].
For the possible contribution of the mercury lamp in the reaction for photosensibilization, the tests were carried out with the neon lamp. The first reaction was between BPA and light, shown in the figure 13, there was not reaction, confirmed the hypothesis, not exist interaction directly between the pollutant and the light, for that suggest that the reaction is for other ways. The second experiment was the EOS with the light shown in the figure 14, there was not reaction, and the mixes between BPA and EOS exposed at the light shown in the figure 15, neither the reaction, the possible reason is that the reaction require other conditions for that happen, so, in this case it's necessary an experimental design.
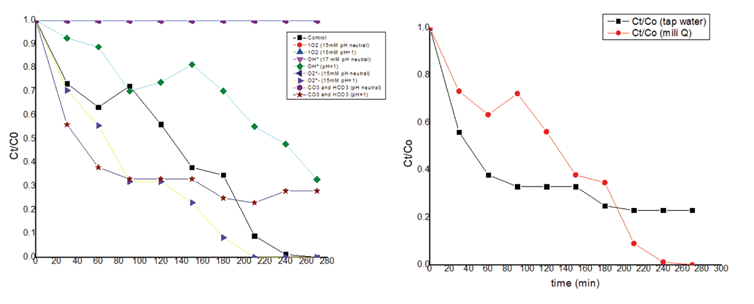
Then, for the other experiments using the neon lamp, it was possible to demonstrate that the photosensibilization reaction, in the preliminary result, was possible to be established at pH 1, concentration of BPA of 4ppm, of EOS of 8 ppm at 240 minutes, and with a photodegradation of 100%. In the figure 15 the results with water milliQ and tap water are shown and demonstrate the same results. Finally, for the analyses of the possible way of the reaction, analyze with furfuryl alcohol as scavenger of 1O2, Ethanol as scavenger of OH, chloroform as scavenger of O2 -, and CO3 2-/ HCO3 -1 were used for the tap water at neutral and acidic pH, using as control the optimal condition. The results shown with the scavenger for the 1O2 do not produce a reaction; for this reason, it was concluded that the 1O2 species had a significant parcipation in the photodegradation.
4. CONCLUSIONS
Considering that the results of the PCA and PLS applications were significant, the model made predictions with great statistical accuracy, this is evidenced in its RMSEP. In general terms, it is a versatile methodology aiming to reduce systematic errors, such as those caused by the traditional methodology, so that the application of chemometric tools such as PLS and PCA allow us to detect the regions with the most information and to make use of instrumental work techniques that give sufficient robustness to the results.

