


 English (pdf)
 Article in xml format
 Article references
 Send this article by e-mail
 Cited by SciELO
  Cited by Google
  Similars in
SciELO
Similars in
SciELO  Similars in Google
 Permalink
1 Introduction
Throughout history, different phenomena and wonders of planet Earth have been studied, among them the Geomagnetic Field of the Earth (GMF), which according to the most accepted physical model is produced in the outer part of the Earth's core, because of the turbulent movements of liquid metals produced by the Earth's translation and rotation [1]; as the molten material moves and stretches, electric currents are created, which produce magnetic fields [2]. The spatial distribution of the Earth's magnetic field is similar to a bar magnet with its magnetic south pole deviated 11° with respect to the geographic north pole. Thanks to paleomagnetism, which is the study of the time behavior of the GMF by analyzing the natural remanent magnetization recorded in rocks, we know that this was not always the case, Studies such as those presented in [1, 3] have reported extreme directional changes of up to one degree year, which have highlighted the occurrence of polarity reversals, thus demonstrating that the GMF varies with time.
The Earth's magnetic field has shown an accelerated variation since the first measurements of it were made in 1840, as since then its dipole moment has decayed by about 5% per century approximately [1,4]. In addition to this, recent studies have shown that the magnetic declination (Angular difference between the geographic north pole with the magnetic south pole) has increased rapidly in recent years, this is reflected in the displacement that the Earth magnetic south pole has had, which currently seems to be heading with great speed to Siberia [5,6]. These variations have brought with them a weakened magnetic dipole, as the magnetic field strength in the world has been considerably reduced, especially in the areas comprising the South Atlantic anomaly [7].
The consequences of this phenomenon are an increased vulnerability of the Earth to space weather, since the Earth's magnetic field and the magnetosphere it creates around the planet is our main defense against cosmic radiation from outer space [8, 9]. Geomagnetic disturbances produced mainly by coronal mass ejections or solar storms are one of the most striking effects of this problem. Trillions of energized particles enter the Earth, which shudder and shake the GMF. The high-energy particles induce electric tension at the Earth's surface and these generate Geomagnetically Induced Currents (GICs) [10], which noticeably affect the electrical transmission infrastructure worldwide [8].
Damage to high voltage transformers, transmission lines and different elements of electrical substations are some of the consequences of GICs [7, 10, 11]. Events such as the one reported by astronomer Richard Carrington in 1858 and the 1989 solar storms in Quebec have severely impacted electrical systems [7], however, at present the economic losses recorded for this type of failures are still significant [8], as there are multiple examples of critical damage to electrical infrastructure reported in countries such as the United States, Canada and Scandinavia [12]. For this reason, it is essential to determine the behavior of the GMF for the purpose of preventing damage to the electrical system.
Internationally, there has been interest in research on the impact on electrical systems due to magnetic field variation and its interaction with the solar wind. Actions such as those in the United States with its project called solar shield, a novel forecasting system to protect power grids when coronal mass ejections are detected [13], in the United Kingdom with the development of research assessing the socioeconomic impact on the country due to failures in the power grid infrastructure due to space weather [8] and in Ethiopia with the evaluation of GCIs in the grid by means of a full node model, which evidences the dangers of harmonic currents, potential drops and reactive power fluctuations in power grids among others [11].
The countries most affected by space weather phenomena are those located in or near the South American Anomaly (SAA), formerly known as the South Atlantic Anomaly, a zone in which the magnetic field strength is especially low because, in this part of the planet, a magnetic field flux opposite to the direction of the Earth's magnetic dipole is generated between the core and the mantle [6]. Uruguay (country located in SAA), through the Geophysical Observatory of Aiguá, investigated a correlation between the most prominent space weather phenomena such as Halloween storms with major failures in the transmission networks in that country [7].
Therefore, it is necessary to know the behavior of the terrestrial magnetic field in Colombia and the influence it has and could have in the future on the Colombian electrical system. In the following article there will be a thorough treatment of the historical series of geomagnetic field components measured by the Fúquene Geomagnetic observatory, with this study we expect that the research in this area will take a greater relevance, in order to encourage containment and mitigation actions that will allow us to deal with possible affectations in the Colombian electrical system.
2 Theoretical framework
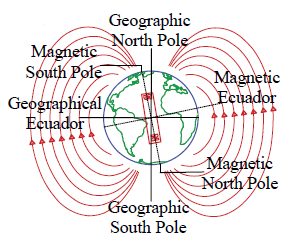
The earth's magnetic field has a dipole distribution as would be offered by a magnet at the center of Earth with a slight asymmetry with the Earth's geographic meridian, where the magnetic field vector exits near the Earth's geographic south pole and enters near the geographic north pole. The exact points at which the earth's magnetic field vector enters and exits are designated respectively, magnetic south pole and magnetic north pole [1,14]. The magnetic north pole is located near the geographic south pole and the magnetic south pole is located near the geographic north pole [15]. See Figure 1.
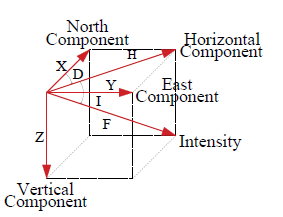
The Earth's magnetic field is a vector that can be represented by its magnitude, also called Intensity F, and its horizontal and vertical components.
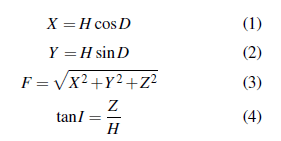
The horizontal component H, as its name indicates, acts in the horizontal plane, and forms an angle I of inclination with respect to the field; the vertical component Z, perpendicular to the horizontal component, is directed towards the center of the Earth. The H component can in turn be projected along the northern geographic meridian, determining the northern component X, which forms an angle called Declination D, with a perpendicular component towards the east called Y [1, 14, 16]. See Figure 2.
The magnetic field components are related mathematically through the equations:
3 Methodology
The present study requires the thorough treatment of terrestrial magnetic field information over locality of Fúquene Colombia, given the reports of decrease in its intensity on the scale of the South American continent reported in the literature [6, 7, 17]. This first work will allow researchers in electrical engineering issues to diagnose the risks that the electrical system could experience in the coming years.
For the development of this work, the historical series where each of the components of the terrestrial magnetic field are found, were measured and processed hour by hour from 1955 to 2015 at the Fúquene geomagnetic observatory (Latitude: 5.467343, Longitude: -73.734809). For the elaboration of this historical series, the Horizontal, Vertical and Declination components are measured directly at the observatory and the Inclination, Intensity, East and North components are calculated.The published information goes to year 2015 because the data of years 2016 to 2020 are currently being processed. The Fúquene geomagnetic observatory is a reliable source of information since it has been part of the world network of magnetic observatories, sharing relevant information for the Association of Geomagnetism and Aeronomy (IAGA) on solar climate and the effects of the GMF on human beings reflected in solar activity. This historical data series is one of the longest and most continuous data series in Latin America, having special relevance due to its equatorial position and the lack of similar facilities in the area, all these characteristics have consolidated it as one of the most successful geoscientific tasks in Latin America [18].
The Fúquene Geomagnetic Observatory determines the magnetic field variables by making relative and absolute measurements. Relative measurements consist of continuous records of variation of the declination components, vertical component and horizontal component, with equipment called variometers.
Absolute measurements are routine tests performed according to the International Geophysical calendar to determine magnetic inclination , magnetic declination and total intensity. These measurements were carried out with an oscillation magnetometer, a Terrestrial Inductor and a QHM magnetometer until 1996, subsequently these equipments were replaced by a Diflux Ruska magnetometer, an Askania Declinometer and a Geometrics 816 Precision Proton Magnetometer (PPM).
With the first equipments of the observatory, accuracies of 0.00416667° and 15 nT were obtained for measurements of the Earth's magnetic field. Currently the Observatory equipments has accuracies of 0.00416667° (DI-Flux) and 1 nT (PPM), however, the absolute measurements protocol allows to improve the precision to 0.00138889° and after performing the baseline adjustment and processing of the information acquired following the protocols established by the IAGA, the observatory data reaches a precision of 5 nT in the other components[18].
Based on this, the uncertainty of the measurements for the period is summarized in the table 1.
Table 1 Uncertainty in the observatory data for the periods 1955-1996 and 1996-2015.
Source: The authors
The historical series contains 526325 data foreach magnetic field component. The daily average was calculated from the measurements of the magnetic field components hour by hour during the 60 years of study, corresponding to 21916 daily average values. In addition, a command was programmed to omit the empty boxes corresponding to the days in which no measurements were taken for different reasons, in order to exclude them as information within the existing historical series.
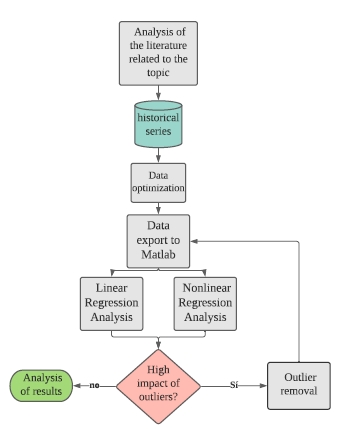
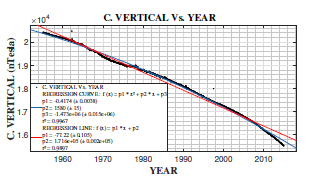
For data processing, the optimized historical series was imported into MATLAB software and the Curve Fitting Toolbox was used to perform the data processing. This application is used to fit curves using linear and nonlinear regression analysis and even specify custom equations. A simple linear regression analysis was chosen as the first choice of representation for the terrestrial magnetic field components, since a directly proportional relationship between the study variables was observed in principle. However, after data processing, it was observed that the Vertical and Inclination components were more adjusted to a non-linear behavior (see Figure 6), so it was decided to apply a quadratic polynomial adjustment for these components.
Applying linear and quadratic regression analysis, very low coefficients of determination r were identified in the Horizontal, North and Inclination angle components. For this reason, we proceeded to verify the influence of outliers in the regression analysis using the robust least squares regression option, with the method of two-square weights. This method assigns a progressive weighting to the points according to their distance from the fit line, assigning a zero weighting to the outliers or points farthest from the fit line and assigning a full weighting to the points close to the fit line [19]. This study confirmed the existence of outliers that widely affected the regression analysis, since the coefficients of determination increased widely. Therefore, we proceeded to identify these outliers in the historical series using the Z score method with a margin of three standard deviations. This method was used considering that it is effective for large data series.
The Z score is used to determine the number of standard deviations by which a data deviates from the mean, as expressed in equation 5, where x and s represent the mean value and the standard deviation of the data. This value is considered a valid indicator for the determination of outlier data, since it is generally considered that a data i is outlier when Z scorei ≥3 [20]. This method has been used for years for the identification of outliers in data [21].

Once the Z score method was applied, the data detected by the algorithm were analyzed and it was found that most of the outliers in the components with low coefficient of determination were observed in December 1996. This can be attributed to a possible systematic failure on this date, since all the measurements taken in that month from day 5 to day 31 had |Z score | well above 3, most of them exceeding the margin of 20 standard deviations. After removing these outliers, the data were processed again.
Once the data processing was performed again, it was observed that there were still points far away from the line of fit, despite the fact that the coefficients of determination improved significantly. For this reason, we proceeded to apply the Hampel filter available in MATLAB to identify and eliminate the remaining outliers. For each base data, the Hampel filter calculates the median of a window consisting of the data and the group of its ten surrounding data, five to one side and five to the other. In addition, it estimates the standard deviation of each data over its window median using the absolute deviation of the median. If a data differs from the median in more than three standard deviations, it is replaced by the median. The Hampel filter is known as one of the most efficient and robust methods for outlier removal in practice [22]. The figure 3 shows a brief summary of the statistical process applied in this study.
A literature review was made of the main solar events that occurred during the Fúquene station's operating period, this in order to observe the behavior of the magnetic field during these events and thus to determine the time periods where GCIs should have been presented based on the magnitude of the gradients of the horizontal component of the magnetic field.
Times greater than those taken by solar events were analyzed to observe the three phases of a geomagnetic storm; Initial phase, characterized by an increase of 30-50 nT in the magnitude of the horizontal component, this phase does not appear in most storms. Main phase, in this phase there is an abrupt decreasing in the horizontal component of the magnetic field. Recovery phase, the horizontal component value returns to its average value slowly [23] . With this analysis and its subsequent comparison with similar studies in other South American countries, is possible to verify the susceptibility to the generation of GCIs, and the risk that this physical phenomenon represents for the Colombian electricity network.
4 Results
4.1 Behavior of the Earth's magnetic field in Fúquene
Below, the scatter diagrams with the regression curves of the variables of the magnetic field, Intensity, declination, vertical component and horizontal component, are presented after having applied methodology described in the previous section with data processing in Matlab software. See Figures 4 to 7.
Source: The authors
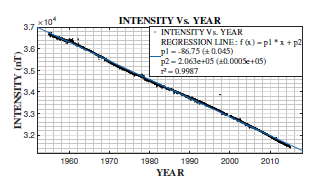
Figure 4 Point spread plot and linear regression curve of magnetic flux density versus time in years.
Source: The authors
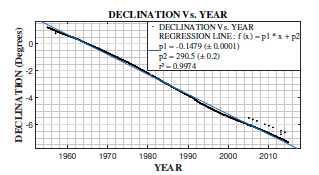
Figure 5 Point spread plot and linear regression curve of magnetic field declination versus time in years.
Source: The authors
Figure 6 Point spread plot and linear regression curves of magnetic field vertical component versus time in years. The plot shows one linear and quadratic regression comparison.
Source: The authors
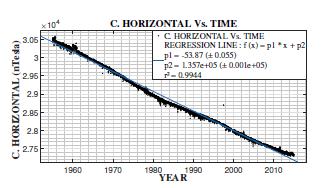
Figure 7 Point spread plot and linear regression curves of magnetic field horizontal component versus time in years.
The regression curves parameter corresponding to the other variables of the Earth's magnetic field can be observed in the table 2.
Table 2 Regression curve parameters, regression analysis for curve with their respective uncertainties and correlation coefficient.The regression curve of the horizontal and vertical component is expressed as f (x) = P1x + P2 and the inclination has f (x) = P1x 2 + P2x + P3.
Source: The authors
4.2 Behavior of the Earth's magnetic field in Fúquene during solar events
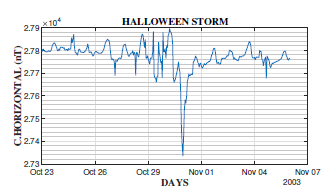
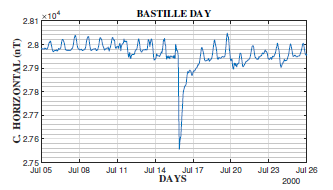
The following figures shows the behavior of the horizontal component of the magnetic field during the two most relevant solar events measured the Fúquene Geomagnetic Observatory historical series, where the behavior of the horizontal component shows clearly the detection of Geomagnetic storm. See figure 8 and 9.
Source: The authors
Figure 8 Behavior of the horizontal component of the magnetic field during the Halloween storm, registered at the Fúquene geomagnetic observatory.
Source: The authors
Figure 9 Behavior of the horizontal component of the magnetic field during the Bastille Day Event, registered at the Fuquene geomagnetic observatory.
The behavior of the horizontal component during the rest of the solar events is summarized in the table 3.
Table 3 Behavior of the horizontal component of the magnetic field during During solar events, registered at the Fúquene geomagnetic observatory.
Source: The authors
5 Discussion
5.1 Behavior of the Earth's magnetic field in Fuquene
At the end of the regression analysis of the magnetic field variables over time and applying the Curve Fitting Toolbox, the equation of the predictor curve associated to a linear or nonlinear behavior according to the component is determined, with the respective uncertainties of the polynomial coefficients and the determination coefficient r2. We can observe that the curves that describe the approximate behavior of the magnetic field components are all descending,so it can be evidenced a weakening of the terrestrial magnetic field over the locality of Fúquene in the last 60 years.
In Figure 4. it can be observed that from the year 1955 to 2015 the Earth's magnetic field strength in Fúquene municipality has had a decrease of 14%, and its predictor curve indicates a variation of more than 25% for the year 2055. These results support the idea that the magnetic field intensity may change by 50% in a century or two [24].
The rate of change of magnetic field strength obtained is 0.08675 [µT/year] with an uncertainty of 0.000045 [µT/year], this rate is quite higher than that reported recently in [25] where a variation rate of 0.0172 [µT /year] is shown for Brazil in a study period from 1900 to 2015. The results are compared with this study given that it is an area belonging to South America, taking into account that the intensity variation is not uniform throughout the planet, but varies regionally. On the other hand, the results obtained have more similarity with the average annual variation rate of intensity in Western Europe which is 0.07 to 0.1 [µT/year].
As for the magnetic declination in Figure 5. a decrease of about one degree for every 6 years can be observed. The local annual variation rate is 0.1479 [°/year] with an uncertainty of 0.0001 [°/year], similar to that obtained in [25], where a variation rate of 0.11 [°/year] is obtained for a study period from the year 1750 to the year 2015.
All the coefficients of determination obtained a value slightly higher than 0.9 with the elimination of the outliers found with the methods described in the methodology. The data treatment has been developed according to the standard statistical analysis on time series, with the use of appropriate tools such as Matlab software.
In order to validate the methodology used and the results obtained, regression curves presented above are compared with those calculated using an alternative historical series, obtained by using the magnetic calculators of the National Oceanic and Atmospheric Administration (NOAA). These allow the generation of annual magnetic field data corresponding to the geographical coordinates of the station of Fúquene for a specific period of time, in this case from 1955 to 2015.
The annual variation rates reflected in the regression curves of Figures 4 to 7 and the table 2, are compared with those obtained using the NOAA magnetic field calculator, through the International Geomagnetic Reference Field (IGRF) model. See table 4.
Table 4 Annual rate of change obtained from linear regression curve.
Source: The authors and NOAA
The agreement between the data reported by NOAA and the annual rate of change calculate from the linear regression analysis is excelent (less than 2 percent), with the advantage that the data series of Fuquene let us do better analisys, included the magnetic variations by the changes in solar climate
5.2 Behavior of the Earth's magnetic field in Fúquene during solar events
Figure 8 clearly shows the three phases that make up a geomagnetic storm. However, in the storm shown in figure 9 the initial phase is not reflected, this is something common in most records of these phenomena [23].
In the case of Halloween storm, the first phase is clearly observed, reaching maximun value of 27 900 nT, after this the component decays to a minimum value of 27 340 nT in an interval of 18 hours, to finally recover its average magnitude after a day and a few hours. It is noted that the magnitude of the horizontal component came to vary 410 nT in just 6 hours.
In the Bastille Day storm the maximum point corresponding to the initial phase is not evident, however, a highly pronounced main phase can be observed, in which the magnitude of the horizontal component decreases from 28 000 nT to 27 560 nT in a over 7 hours, recovering its average magnitude in a period of more than four days. For this event, the most accelerated variation of the three storms is presented, which corresponds to a gradient of 410 nT in 4 hours.
In [7] it is determined that a decrease of 100 nT in less than three hours represents a significant gradient that would generate ICGs. The table 3 shows that during the Halloween storm, Aurora Gallery and geomagnetics storms of 1991,1967 and 1958 events, higher gradients are presented for the horizontal component.
6 Conclusions
In this article the behavior over time of the Earth's magnetic field in the municipality of Fúquene, Colombia, was analised for this purpose a regression analysis was performed for each of the components of the magnetic field, and linear and quadratic predictor equations with descending behavior were obtained. The most relevant aspect were the determination coefficients of the predictor curves, which, being very close to unity, indicate that the equation model has a high level of correlation.
It should also be noted that the historical series analyzed has a series of outliers recorded from December 5 to 31, 1996, which greatly affected the results obtained in the first data processing of this study, reflecting a high sensitivity of the regression analysis to outliers. It is therefore recommended to verify the measurements recorded in this period at the Fúquene geomagnetic observatory for future research.
In according with the gradient of horizontal component of the magnetic field, during the occurrence of solar storms, in such time periods would have happened GCIs in the colombian electrical system; in order to prevent the consequences of this phenomena the terrestrial magnetic field must be monitoring in other regions of the country, as is done with the atmospheric variables.
From the historical behavior of the variables studied, it is expected that in the future the downward behavior of the magnetic field intensity will continue, implying a greater threat to the country before the occurrence of solar storms, and the consequent affectation of the Colombian electricity system, due to the generation of GCIs.
The results obtained in this study do not represent the behavior of the magnetic field in the entire Colombian territory, this because the data used is local and cannot be extrapolated to the rest the country. However, given the absence of more observatories such as the Fúquene geomagnetic observatory in Colombia and in countries such as Peru and Venezuela, it can be said that this study serves as a reference for this equatorial zone.
In future perspectives, it is necessary to perform an analysis of the relationship between failures in the Colombian electrical system with the decrease of the magnetic field in the country, since this study has not been carried out due to insufficient information from the Colombian electrical system. Therefore, it is expected that the article will encourage research and monitoring of failures in the electrical infrastructure caused by space weather, following the international experience of countries such as Uruguay, USA and UK.

