


 English (pdf)
 Article in xml format
 Article references
 Send this article by e-mail
 Cited by SciELO
  Cited by Google
  Similars in
SciELO
Similars in
SciELO  Similars in Google
 Permalink
Introduction
Environmental regulations stimulate research on wastewater purification and treatment 1. Conventional treatment methods involve microbial metabolism 2; the coagulation of colloid particles and solids in the water, selecting the coagulant according to the wastewater; membrane separation, trapping contaminant particles; and flotation or addition of gas bubbles, where the particles suspended in the water rise to the surface attached to the bubbles 3. Treatment methods have a contaminant removal efficiency that depends on the design, the size of the equipment, and the materials used.
In flotation methods, the particle-bubble collision probability influences the removal efficiency. The bubble must be smaller than the contaminant’s particle size 4. Several flotation techniques include a cyclonic static microbubble flotation column 5,6. The combination of flotation columns, cyclone separation, and microbubble generators yields bubbles of less than 10 μm in diameter and has a removal efficiency of 92,19 %. Electro-flotation 7 separates solid particles with bubbles between 15 and 80 μm in diameter which are produced by electrodes. Its separation efficiency is 64,5 %. In dissolved air flotation (DAF) 8, water saturated with pressurized air is passed through a pressure-reducing valve to generate microbubbles of 20-100 μm. This method has a removal efficiency of 90 %. At the industrial level, one of the main contaminants is grease. Industrial grease removal uses the DAF and induced air flotation (IAF) methods 9. The IAF method requires a more extensive setup than DAF. For an effective removal of contaminants and an adequate size reduction, the DAF method offers high efficiency by removing suspended grease particles while having a less complex setup in comparison with other flotation techniques 10.
The DAF method produces bubbles with characteristics such as larger gas-liquid surface area, higher gas retention, and slower rising velocity in order to achieve a high contaminant removal 11. The bubble size distribution influences these properties 12. Macro-bubbles have a high rising velocity and low collision with contaminant particles. Microbubbles decrease in size as they rise until they burst due to stagnation. Nanobubbles remain suspended in the water for longer periods of time without bursting 11. The DAF method uses microbubbles to increase the contaminant removal efficiency and flow velocity 13. The characteristics of microbubbles for flotation treatment are diameters ranging from 1 to 200 μm and an increased bubble inertial pressure with decreasing diameter without collapsing. The area-volume ratio is inversely proportional to the diameter. Cavitation pertains to the formation, growth, and collapse of bubbles 14. Hydrodynamic cavitation produces bubbles by pressure variation with increasing liquid velocities, and it is a low-cost, energy-efficient method 15. Other types of cavitation are acoustic fields, laser light photons, and elementary particles 16. The type of cavitation influences the bubble production efficiency, the equipment footprint, and the associated costs.
Some hydrodynamic cavitation methods involve a spherical body in a tube through which a liquid flows, generating bubbles by the decay of the internal pressure at the constriction of the channel 17. Others utilize the spiral injection of a fluid with a pump in a specific flow zone, reducing the pressure in its central axial part, generating bubbles by gas suction 18. In others, the fluid passes through a Venturi tube, which increases its velocity and reduces its pressure. The gas is self-primed from the low-pressure point and remains mixed with the liquid 19. Furthermore, pressurized solution injection involves injecting an air-water mixture at a pressure of 3-4 atm into a tank at atmospheric pressure. The pressure change causes the supersaturated air to form microbubbles in the water 4. Pressurized dilution is commonly used within the framework of the DAF method. Studies on microbubble generation via Venturi tubes range from laboratory to industrial scales, with bubbles suitable for grease removal in water 12,19.
The shape, size, motion, forces, and surrounding physicochemical environment make microbubble characterization difficult 20. There are several techniques to determine microbubble parameters, ranging from intrusive to non-intrusive methods 21. In recent years, high-speed camera photography has been used for microbubble characterization. This non-intrusive method is easy to use in industrial environments and is less expensive than electronic equipment 22,23 Calibration for image acquisition affects the accuracy of image processing. Camera calibration methods analyze real objects with known measurements. The intrinsic and extrinsic parameters of a camera are extracted from a set of correspondences between real three-dimensional points and two-dimensional image points 24. The calibration of electronic devices is more complex than that of cameras 25,26. In fact, the potential use of smartphone cameras for microbubble measurement has not yet been investigated.
This research implemented a DAF system with a Venturi tube microbubble generation method, analyzing the influence of the liquid recirculation pressure, the inlet type, and the airflow rate on microbubble production. The characterization of the diameter and the count of microbubbles generated was performed via a measurement system based on digital image processing installed in the contact zone of the DAF tank. This low-cost microbubble measurement system uses a smartphone camera to measure the diameter and count the microbubbles generated in a lab-scale DAF system at room temperature with clean water. The microbubble measurement algorithm developed in MATLAB (under a campus-wide license) allows for a fast and detailed characterization of dense bubble populations with different diameters.
Materials and methods
Venturi tube design and construction
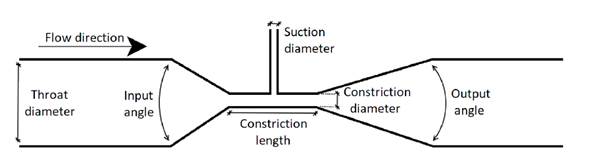
According to Bernoulli’s equation, when a liquid flows through a pipe, its velocity increases and its pressure decreases as the cross-sectional area of the pipe narrows. The air suction created in the narrowed or low-pressure area of a Venturi tube aids in the formation of bubbles. Air can be introduced into the tube by drawing it from the atmosphere or by injection using a pneumatic compressor. To produce microbubbles in the desired area, the geometric parameters of the tube must be considered, i.e., the throat diameter, inlet angle, cone diameter, suction diameter, cone length, and outlet angle (Fig. 1). The parameters with the greatest influence on microbubble size are the inlet and outlet angles of the Venturi tube 27.
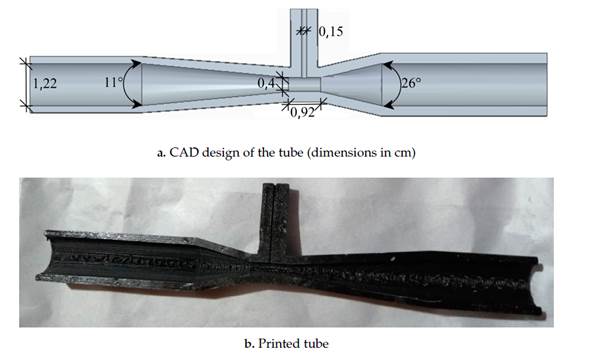
As the liquid flow increases at the inlet of a Venturi tube, the bubble size decreases if the inlet angle is large relative to the outlet angle. The progressive increase in the orifice diameter to a value smaller than the throat diameter causes a gradual increase in pressure and a decrease in liquid velocity, thus increasing the cavitation intensity. To optimize the size of the generated microbubble, it is necessary for the inlet angle and throat diameter to be at least twice as large as the outlet angle and the narrowing diameter, respectively 27. According to the influence of the geometrical parameters (Fig. 1), the authors of 28 provide some considerations regarding their optimal values. These parameters (Table I) allowed elaborating a CAD design (Fig. 2a) for 3D-printing in PLA (Fig. 2b).
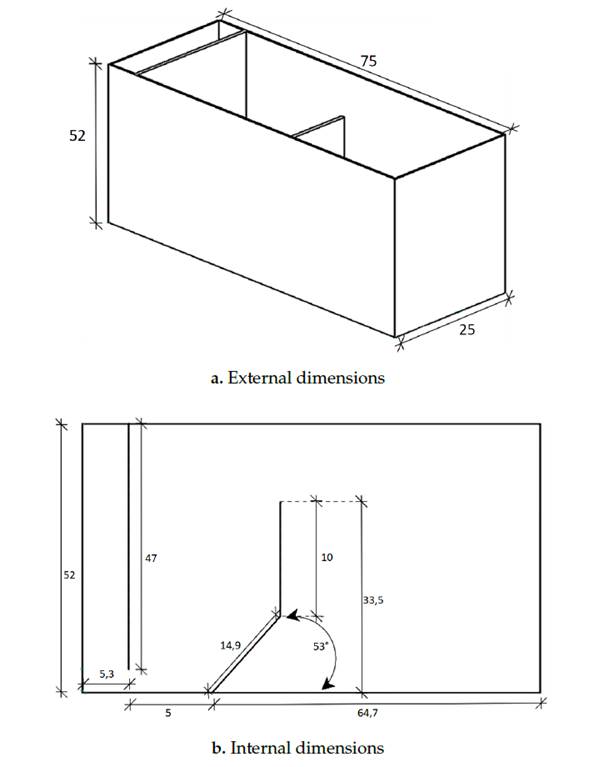
DAF tank design and construction
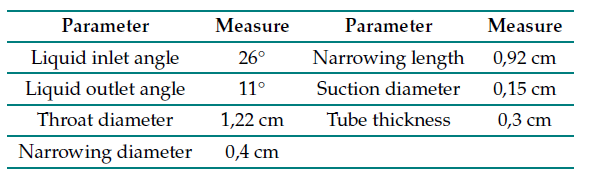
In the developed DAF system, the recirculation of the liquid through the Venturi tube produces pressurization and mixing with air 29. According to the operation and resistance of the developed Venturi tube (Fig. 2), the maximum recirculation flow rate is 16 L/min. In order to achieve a high rate of rising suspended particles, the design of the proposed flotation tank follows previous models 30, with internal structures for higher efficiency, lower cost, and smaller size (Fig. 3).
The four internal zones of the flotation tank are:
The measurement zone, a space in which a portion of the bubbles is periodically lifted, facilitates the acquisition of microbubble images for measurement.
The contact zone is an area of higher concentration of microbubbles and contact with Grease particles in the liquid to be treated.
In the clean liquid zone, the treated liquid flows to another tank and recirculates.
The sludge collection area is a tank for collecting the removed grease particles.
Prior to construction, the CAD design of the flotation tank provides external and internal measurements (Fig. 4). The 53° deflector angle (Fig. 4b) produces a high hydraulic load on the flotation tank, together with a size reduction, without causing turbulence in the contaminants, thus avoiding the re-mixing of contaminants with the treated liquid.
The design parameters of DAF systems are as follows.
The ratio of kilograms of air used to kilograms of solids separated for high concentrations of solids in the effluent is expressed by Eq. 1) (31:
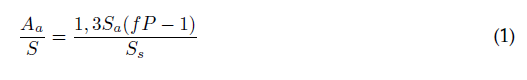
Where:
Aa/S: air-solids ratio, ml/mg
Aa: Air requirement kg/h
Sa: solubility in air ml/l
F: Fraction of dissolved air at a pressure P
P: Pressure atm
Ss: Influent suspended solids, g/m3 (mg/L)
- The hydraulic loading (HL) is the total flow rate per unit area (Q/A) (32). The total flow is shown in Eq. 2:
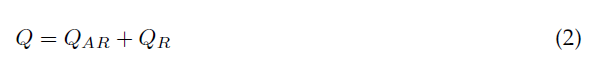
where QAR is the treatment flow rate and QR is the recirculation flow rate, expressed as Eq. 3:
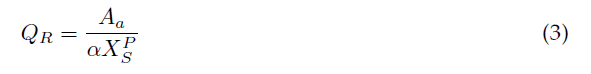
Here, XP S is the solubility of air in pure water at the working temperature and pressure (for temperatures between 20 and 30 °C, it varies between 18 and 15 ppm), and α is the impurity coefficient of the wastewater (nominal values are between 0,60 and 0,80) 33.
- The recirculation rate ( %R) is the ratio of the recirculation flow and the total flow.
- The hydraulic retention time (HRT), which indicates the residence time of the water to be treated in the flotation tank, is the ratio between the volume of water to be treated (V) and the total Flow rate.
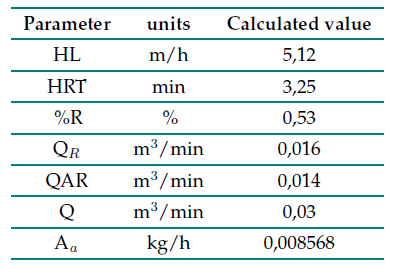
The design of the flotation tank and the Venturi tube determine the parameter values of the developed DAF system (Table II). The efficiency varies according to the ratio between the kilograms of air used and the kilograms of separated solids (A/S), with values between 0,005 and 0,09 30.
DAF system instrumentation
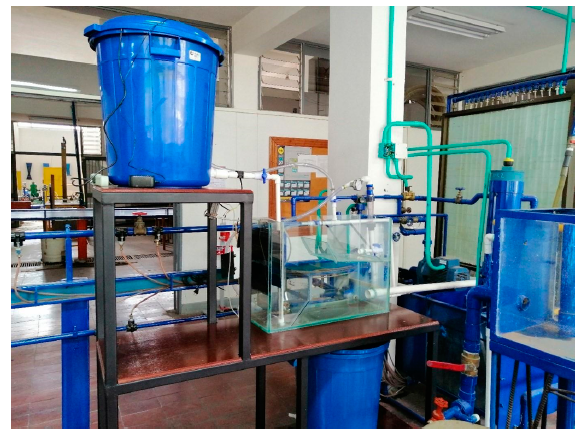
The developed system includes a flotation tank for removing contaminant particles; a tank for water treatment, with liquid temperature control and a mechanical stirrer for mixing and temperatura homogenization; an auxiliary tank to receive the treated water; two 2 HP motor pumps with a flow rate of 20 L/min, the first of which is responsible for the water flowing through the hydraulic circuit and the second for the removal of the separated sludge from the collection area of the flotation tank; three 1 inch light gate valves and four 1/2 inch unthreaded PVC ball valves; and a portable pneumatic compressor for injecting air into the Venturi tube.
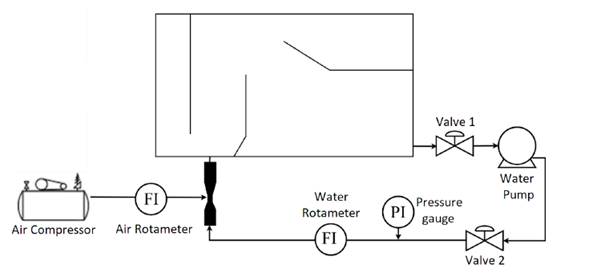
The DAF system’s flotation tank uses 1 cm thick glass, and the partitions inside it use 4 mm thick glass. The holding and auxiliary tanks are made of plastic and have a capacity of 160 L. The system uses a water rotameter (0-1.000 L/h) and a pressure gauge (0-60 psi) to measure the flow rate and the recirculation pressure from motor pump 1 to the Venturi tube. To measure the airflow into the Venturi tube, an air rotameter is used (0,3-0,5 L/min) (Fig. 5).
The Venturi tube is located at 3 cm from the bottom of the flotation tank. The coupling of the Venturi tube and the hydraulic circuit uses a 3/4 inch, 2mmthick transparent hose. The air inlet uses a 1/8 inch, 1 mm thick hose for the duct leading to the narrowing zone (Fig. 6).
Microbubble measurement system
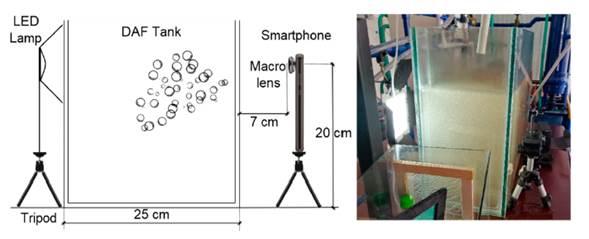
The main components of the microbubble measurement system are a 20-megapixel Huawei Mate 20 Lite smartphone camera with a 3X digital zoom, F/1,8 aperture, a 5.120 x 3.840 pixel resolution perframe, and slow-motion recording features. The smartphone camera has a 15X macro lens, and images are captured in an area of 1,8 x 2,2 cm with an 18WLED lamp lighting system at 110 Vac located backlit to the camera. The experimental setup components and adjustment accessories cost approximately 300 USD (Fig. 7).
A code developed offline in MATLAB measures the diameters and microbubble counts of the captured images, all of which are taken while the DAF system runs on clean water. The microbubble images are extracted from a 1.280 x 720-pixel slow-motion video featuring 20 seconds of operation as recorded by the measurement system. There is a two-second interval between each frame analyzed, resulting in a total of 10 images. Image processing is performed in three steps:
Thresholding by V-plane: In this case, a value of 0,95 is determined by trial and error, obtaining more detail than automatic thresholding segmentation methods.
Application of MATLAB correction filters (imdilate, imfill, imclearborder): In each thresholded image, two white fringes are generated by the surfaces bounding the measurement area. The filters remove these fringes and fill the gaps inside the microbubble borders.
Microbubble measurement using the imfindcirclesMATLAB function: For each 1. 280 x 720-pixel image, this function calculates the number and pixel radii of the microbubbles. With the radius of each bubble, the average and the standard deviation are calculated. Finally, the pixel size ratio converts these pixel values to μm. In this case, each pixel is 5,79 μm.
The microbubble measurement algorithm was developed in MATLAB 2019a and executed on a desktop computer with an Intel i3 processor, 8 GB RAM, an MSI Gt 730 4 GB Oc graphics card, and aWindows 10 operating system with a 64-bit architecture. The measurement algorithm takes 3 to 4 min to process the images (Fig. 8).
Results and discusión
The microbubble production of the proposed system helps to analyze the influence of recirculation pressure and the inlet air flow rate to the Venturi tube on the size of microbubbles created by air suction and injection.
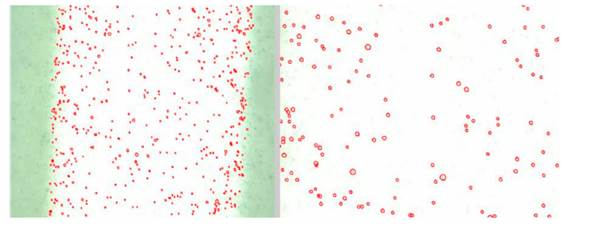
Hydrodynamic cavitation with air suction
The DAF system works with an air suction of less than 0,3 L/min, as higher values produce macrobubbles. In this case, there is a variation in pressure and recirculation flow (Fig. 9), which determines the number and diameter of the microbubbles produced. At an initial recirculation Flow rate of 16 L/min, the pressure is 36 psi. Reducing the flow rate through the recirculation line produces a pressure of 34 psi.
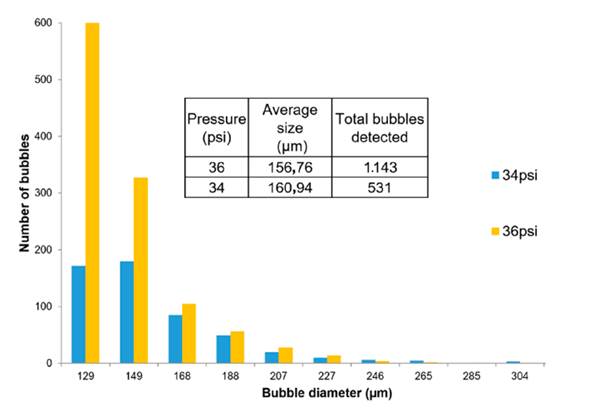
The increase in recirculation pressure from 34 to 36 psi reduces the diameter of the bubbles. The average diameter for the two pressures differs by 4 μm. At 36 psi, a bubble diameter of 134,90 μm corresponds to 52% of the bubbles generated. At 34 psi, this percentage drops to 32% for the same diameter. 34% of the bubbles generated at 34 psi have a diameter of 161,00 μm. At both pressures, bubble diameter values between 134,90 and 161,00 μm are generated: 82% of the population at 36 psi and 66% at 34 psi. The average number of bubbles detected per area is 1.143 at 36 psi and 531 at 34 psi.
Hydrodynamic cavitation with air injection
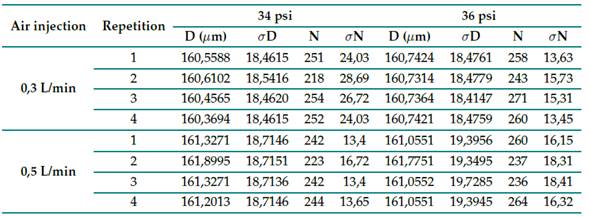
A 22 factorial design (Table III) was used to analyze the average diameter and number of bubles produced by air injection. Its evaluation factors are the air injection flow rate (0,3 and 0,5 L/min) and the recirculation pressure (36 and 34 psi). There are four measurements for each combination.
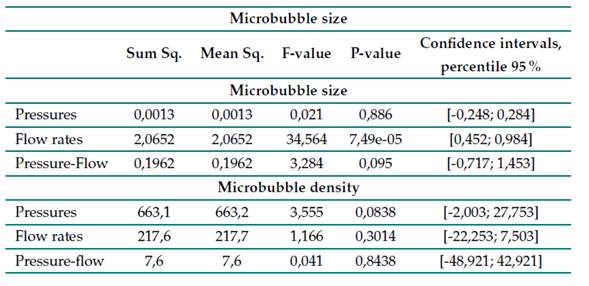
The results of the factorial design (α-value of 0,05, Table IV), indicate, with a p-value of 0,886, that the average bubble diameter does not vary significantly for different recirculation pressures. The p-value of 7, 49 × 10−5 indicates that the variation in the air injection flow rate affects the size of the microbubbles. On the other hand, the air flow rate, with a p-value of 0,3014, and the recirculation pressure (0,0838) have no influence on the number of bubbles generated. In no case does the variation of the parameters in combination influence the size and number of microbubbles.
Oil and grease removal
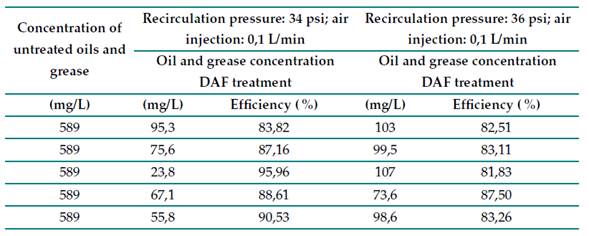
The cleaning tests consist of treating the synthetic domestic wastewater with the DAF prototype for 16 min. During the first minute, the system stabilizes at the set recirculation pressure and air injection. In the next seven minutes, the system forms a small region of foam or suspended solids. Within the next eight minutes, the system has a visible layer of solids, particularly the presence of oils and grease, which, in this case, were analyzed at Corporación Autónoma Regional del Cauca’s laboratory using the SM5520D Soxhlet method.
For each pair of parameters (34 psi at a 0,1 L/min air injection and 36 psi at a 0,1 L/min air injection), five cleaning tests were performed, with a new Venturi tube for each one, measuring the oil and Grease concentration (Table V). The average grease and oil removal at 34 psi was 89,22 %, as well as 83,64% at 36 psi. An ANOVA test, with an α-value of 0,05 and a p-value of 0,038, indicates a difference between the two evaluated parameter levels.
Discussion
By comparing both models for microbubble generation according to the smaller diameters obtained, it can be stated that air injection produces bubbles of a larger average size (160 μm) than air suction (156 μm). A higher air flow rate increases the amount of dissolved air in the water, which requires an increased recirculation pressure to break up the air cloud. Likewise, the increased air reduces the number of bubbles generated by the low air breakup. The bubbles are larger because of the larger amount of air, preventing the generation of new bubbles.
For most of the characteristics evaluated, there is no significant difference in the variation of the recirculation pressure. However, at a practical level, according to the results obtained, it is advisable to work with 34 psi, as it generates a lower cavitation effect in the Venturi tube and a lower power consumption of the system and the tests performed with synthetic domestic wastewater. This pressure reported a higher percentage of grease and oil removal.
The results show that the Venturi tube produces bubbles suitable for DAF systems. The Venturi tuve replaces the saturation tank and the pressure-reducing valve in the proposed system. These components account for 10 to 30% of the total costs in conventional DAF systems 27. Implementing our proposal on an industrial scale would result in a minimum 10% reduction in the cost of conventional DAF systems, as well as a reduction in the space required for installation.
The advent of modern cameras and computer processing power allows for the automatic online and offline monitoring of bubbles 21, as shown in Table VI. Nevertheless, it is necessary to calibrate the camera with a high accuracy, as this affects the performance and estimation of extrinsic and intrinsic parameters 24,34,35. The use of digital image processing equipment with offline or online algorithms costs more than 1.000 USD. The developed system generates an offline MB measurement with low computational cost and fast response times, which allows to take different samples in the field and make control decisions directly.
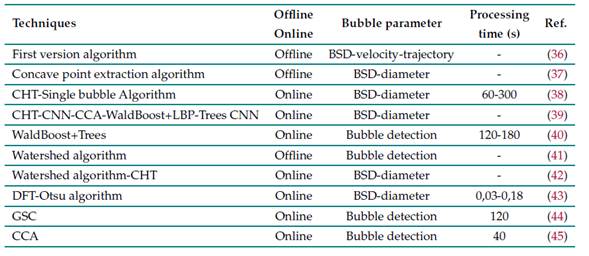
Regarding the location of the camera to measure microbubbles in DAF systems, measurement is typically performed at the top of the tank 40,41. At this point, the bubbles have reached their maximum size, and their removal capacity is reduced. Another way is to take a sample of the generated bubbles 38,43. In this case, the bubbles are measured before they reach their maximum size. However, changes in the uncontrolled environment of the bubbles may cause the analyzed sample to be unrepresentative. The developed microbubble measurement system performs a direct measurement of the bubbles generated by placing the chamber in the contact zone of the DAF tank, providing an adequate characterization of the generated microbubbles in order to determine their possible use in the removal of contaminants. Regardless of the location of the camera, any microbubble measurement system with digital image processing must have adequate lighting and adjust the chamber exposure parameters according to the characteristics of the environment in which the DAF system is located.
Conclusions
This research developed a DAF system using a Venturi tube microbubble generation method. The system replaces the saturation tank and the pressure-reducing valve of conventional systems, which leads to a reduction in the size of the proposed DAF system without affecting the hydraulic load. A microbubble measurement system counts and measures the microbubbles.
The proposed DAF system allows varying the recirculation pressure of the treated water and an air inlet by air injection or suction. The analysis of the variations in recirculation pressure and the inlet air flow rate evidenced the influence of these parameters on the quantity and size of the microbubbles generated. Regarding the combinations of parameters analyzed, the DAF system with a suction inlet air flow rate of less than 0,3 L/min and a treated water recirculation pressure of 36 psi generates a high number of microbubbles with the smallest possible size. In the case of air injection, increasing the inlet air flow rate generates an increase in microbubble size. There is no influence on the number of bubles generated for any given air flow rate and recirculation pressure.
Digital image processing is convenient for the estimation of microbubble parameters. The developed microbubble measurement system costs about 300 USD, a value below the equipment that is often used in research. For adequate detection and measurement, it is necessary to obtain images with a distinction between the background and the air bubbles, generating a good definition of the perimeter. The images in this study were taken with an ISO value of 320 and a shutter speed of 1/1.000 in an area of 1,8 x 2,2 cm.

