


 English (pdf)
 Article in xml format
 Article references
 Send this article by e-mail
 Cited by SciELO
  Cited by Google
  Similars in
SciELO
Similars in
SciELO  Similars in Google
 Permalink
Introduction
The mechanical formability of metal sheets is very important in the manufacture of structural elements for the automotive industry, electrical appliances, and the overall metalworking industry 1. Formability is the measure of the amount of deformation of a metal sheet before it fails, either by fracture or by localized necking, and it cannot be defined based on a single parameter, but depends, among others, on the particular forming process (for example, deep drawing and stretching operations), on the thickness of the sheet, and, to a large extent, on the intrinsic properties of the material 2,3.
The formability and quality of a product are directly or indirectly influenced by intrinsic properties such as ultimate strength (σu), the elastic limit (σy, 0,2 %), elongation to fracture, the strain hardening exponent (n), normal anisotropy (rm), and planar anisotropy (δr) 4,5.
Elongation to fracture is a measure of the ductility of a material and is therefore related to the formability of a metal sheet 2. The strain hardening exponent n, is a measure of how rapidly a metal becomes stronger and harder due to plastic deformation 6. In a material with a high value of n, the thickness is reduced more uniformly in drawing operations, and the elongation is greater before localized necking appears, which is why it is an indicator of good formability 7. The normal anisotropy rm defines the behavior of a metal sheet in terms of thinning during deep drawing and stretching operations. This occurs in the formation process and is defined by the preferential orientation of the grains and by the alignment of impurities and inclusions through the thickness (mechanical fibration) 8. Additionally, it indicates the ability of the metal sheet to resist thinning or thickening when subjected to drawing operations 6,9. Finally, sheets with a high value of rm, are preferred, given that, in sheets with a low normal anisotropy, localized cracks or necks may appear during the manufacturing process. On the other hand, the planar anisotropy Δr value should be as close to zero as possible; if its value is high, the sheet will deform more in some directions, forming the so-called ears in the drawing process 10.
One of the tests that allow predicting the ease of forming metal sheets and has had an important development is the forming limit diagram (FLD) 1. In this test, a series of metallic strips of different widths, which are marked with a network of circles, are tested according to ASTM E 2218 11. The deformations of the circles are measured along the major and minor axes (ε1 and ε2), classifying the points as good (no localized necking), marginal (localized necking), and fractured. The forming limit curve (FLC) is plotted on the boundary between the good and the marginal points 11. In the sheet forming process, the deformation is uniform up to the maximum stress (i.e., maximum load capacity of the material). Then, diffuse necking occurs, and the deformation is localized only in this area until fracture takes place 12,13.
Over the years, theoretical and empirical models have been developed to predict the formability of sheet metal. Some intrinsic properties of the sheet material have been used by some authors to develop empirical approximations of the FLD, with different levels of adjustment to the experimental results, such as the one proposed by 12 and those described by 14.
The main purpose of this work was to experimentally measure the formability of SG295 and SG325 steel sheets (2,2 and 2,3 mm thick) used by the metalworking industry. To this effect, various specimens were subjected to standardized traction tests: ASTM E 8M 15, ASTM E 646 16, and ASTM E 517 17. This, in addition to the simulative test for determining the FLC as per the ASTM E 2218 standard 11. To support the analysis of the results, the chemical composition of the sheets was determined, and a metallographic analysis was conducted.
This article is structured as follows. Section 2 describes the materials and methods used in the chemical, metallographic, and mechanical characterization of steel sheets. In Section 3, the results are presented, and a discussion is proposed. Finally, Section 4 presents the main conclusions of this research.
Materials and methods
Chemical composition and metallographic análisis
The material’s chemical composition was determined using an optical emission spectrometer (OES). The microstructure was observed and micrographs were taken in a reflected light optical microscope (ZEISS, Axio Scope A1).
Tensile test
The specimens were prepared according to 15, in order to determine the conventional yield limit at a 0,2% elongation (σy, 0,2 %), the ultimate strength (σu), and the elongation to fracture for a 50 mm gauge length (A50) (Fig. 1).
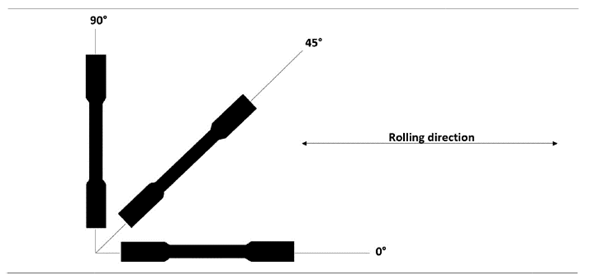
Figure 1 Assembly for cutting the specimens. Orientations of 0, 45, and 90° with respect to the last lamination
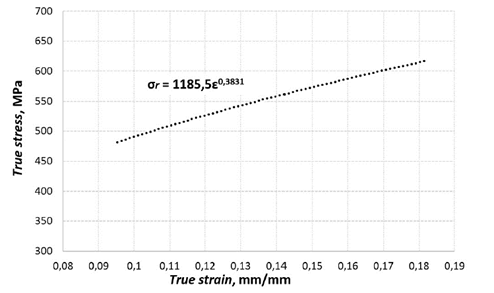
The tensile properties were calculated from the data obtained via a universal testing machine (SHIMADZU, AG 250) (Fig. 2).
Strain hardening exponent, n
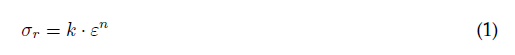
To determine this parameter, the specifications given by the ASTM E 646 standard 16 were followed. As suggested in said document, method B was used because the elastic deformations are much lower than 10% of the total deformation. The value of n was obtained from the slope of the curveσr vs ε in Fig. 2, calculated from Eqs. (1), (2), and (3).

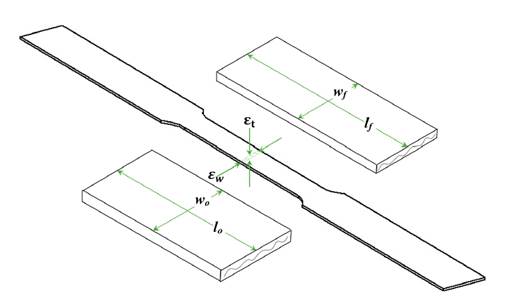
Normal anisotropy coefficient, r
This parameter was determined according to ASTM E 517 17. Four specimens were tested for each orientation with respect to the rolling direction (0, 45, and 90°), up to a deformation of 15%of the original length (lo) and at a test speed of 4 mm/min. rm and Δr were calculated using Eqs. (4), (5), and (6), taking the dimensions shown in Fig. 3 as reference.
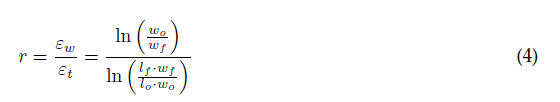
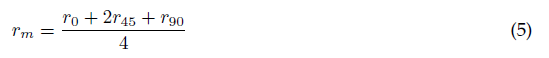
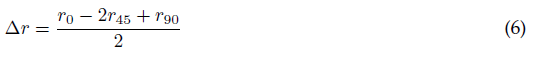
w = width strain
εt = thickness strain
lo = original gauge length
lf = final gauge length
wo = original width
wf = final width
Forming limit curves
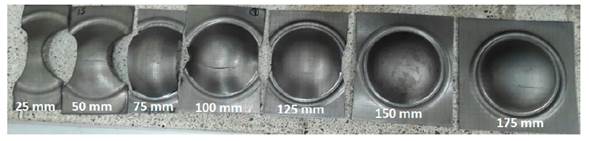
The FLCs were determined according to ASTM E 2218 11. Seven specimens (rectangular strips) with lengths of 175 mm and widths from 25 to 175 mm with 25 mm increments were manufactured and engraved with a grid of circles 2,5 mm in diameter. The sheets were deformed with a lubricated hemispherical punch which was designed exclusively for the test and attached to a universal machine (IBERTEST) (4). The deformation percentage of the circles along the length and width of the sheets was determined, and the curve of each sheet was drawn.
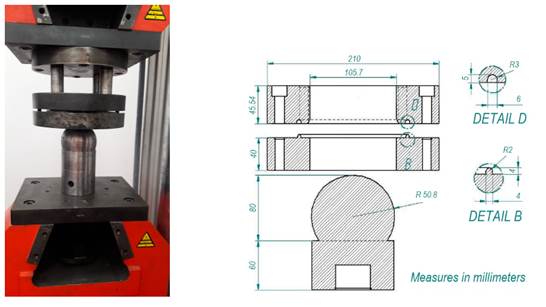
Figure 4 a) Device to determine the FLCs attached to the IBERTEST universal machine; b) measurements of the device according to 11
Analysis and discussion of results
Chemical composition
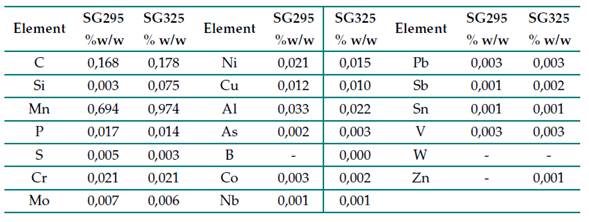
The results of the chemical analysis for the SG295 and SG325 steel sheets are presented in Table I. The values for the main components (carbon, manganese, silicon, phosphorus, and sulfur) are within the limits established for SG295 and SG325 steel sheets as per the JIS G3116 standard 18. Given their chemical composition, the two steels can be classified as carbon steels, and more specifically as mild steels 2.
Microstructure
The metallographic structure of the steels is shown in Fig. 5. As can be seen, the microstructure of SG295 steel is ferrite (90 %) and pearlite (10 %) with very fine equiaxed grains (10 ASTM). No grain elongation is observed in the rolling direction due to the recrystallization process inherent to hot rolling.
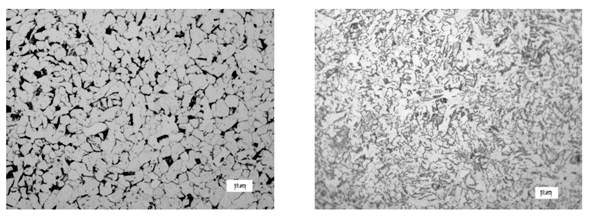
Figure 5 Micrograph of the steel samples: (a) SG295 and (b) SG325. Magnification: 500X; scale bar: 10 μm.
The microstructure of SG325 steel is ferrite (80 %) and pearlite (20 %), with the presence of small globules of retained carbide. The grains are equiaxed due to the recrystallization process inherent to hot rolling. The grain size is very fine (10-11 ASTM), which indicates higher strength but lower ductility. In the case of sheet metal, this fine grain size causes the appearance of orange peel. It should be noted that, in sheet metal forming operations, an ASTM grain size of 7 is preferred 8.
Conventional yield limit at 0,2% elongation, σy (0,2 %), and ultimate strength, σu
The values of these properties are different depending on the orientation in which they were measured (Table II). The average tensile strength for both cases is slightly above the expected limits, i.e., 440 and 490 MP for SG295 and SG325 steel sheets according to JIS G3116 18.
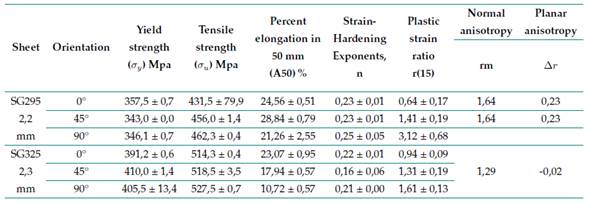
Regarding σy (0,2 %), the values are much higher than expected (295 and 325 MPa) for SG295 and SG325 steel sheets according to 18.
Elongation to fracture for a 50mm gauge length, A50
The tested sheets have a value slightly below the established limits (26 and 22 %) for SG295 and SG325 steel sheets according to 18.
Strain hardening exponent, n
In both cases, the sheets with an orientation of 45° with respect to the last rolling show the lowest value, especially in SG325 steel. These values are slightly below those reported by 8 for annealed low carbon steel (0,26), but they coincide with those presented by 6 for hot-rolled 0,2% carbon steel (0, 22.
Anisotropy coefficient, r
The rm values are slightly above the ranges published by 8 for hot-rolled steel (0,8-1,0). However, they are similar to the range mentioned by 9 for hot-rolled 0,2% carbon steel (1,0-1,6). In both cases, there is a high dispersion of the data, and an increase in anisotropy with the orientation angle is observed, especially in the case of the SG295 sheet. These differences can be associated with the crystallographic texture of the material, as suggested by some authors 19,20.
Forming limit diagrams, FLD
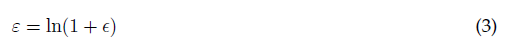
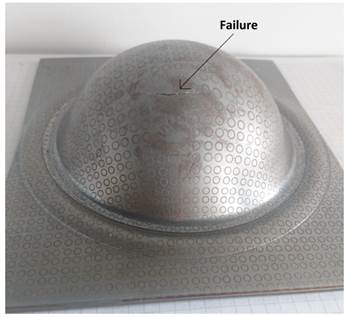
The morphology of the rectangular samples after deformation is shown in Figs. 6 and 7. To measure the deformation of the initial network of circles, the resulting ellipses were classified according to their appearance as good (no localized necking), marginal (localized necking), or fractured. The real deformations in the major (ε1) and the minor axes (ε2) were determined according to Eqs. (7) and (8).
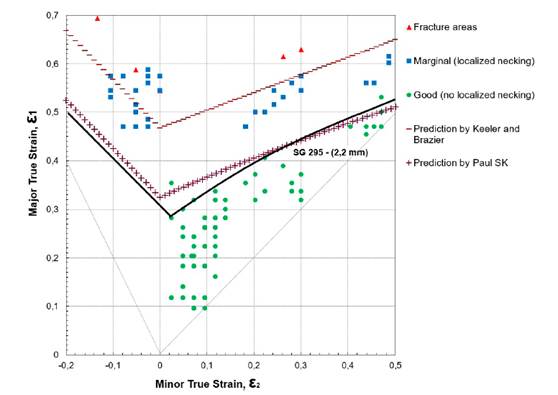
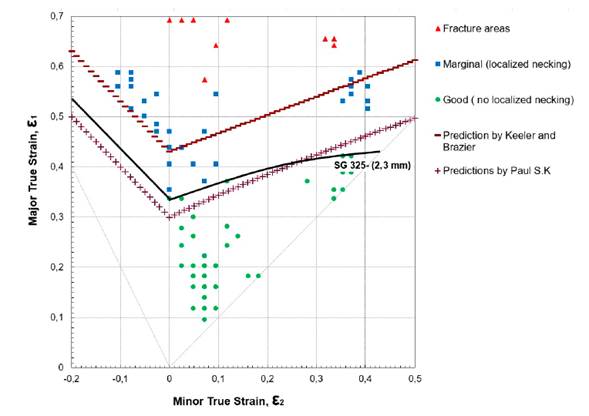
The formability limit curves in Figs. 8 and 9 exhibit a similar behavior in both steel sheets. However, the values of the largest true strain ε1, in the flat strain condition FLD0 (the lowest point of the curve) were different: 0,281 and 0,336 for SG295 and SG325, respectively. These values are lower than the 0,385 found by 8 for low-carbon steel and the 0,460 and 0,457 determined by 21 and 22 in low-carbon steels for deep drawing with 2 and 1,4 mm thickness, respectively.
The only difference between the two curves is on the left: the SG325 slider has a steeper slope, and therefore a greater area in the safe zone. This behavior may be the effect of its greater thickness since previous studies have found that the curve rises with the thickness of the sheet 4 12.
In addition to the experimental curve, Figs. 8 and 9 show two curves with empirical predictions made with the equations of the Keeler and Brazier 23 and Paul S. K. 12 models and the data in Table II. The Keeler and Brazier approximation model depends on the thickness of the shell and the strain hardening exponent n in order to determine the FLD0, while the Paul S. K. model also includes the ultimate strength σu, the elongation to fracture A50, and the anisotropy coefficient r. In both models, the left side of the curve is a straight line with a slope (-1), while the slope on the right side of the curve is 20° in 23 and is determined depending on the value of FLD0 in 12.
In the two steel sheets, it can be seen that the Paul S. K. prediction, the one that contemplates the greatest number of variables in the model, is the one with the best fit and is below the experimental curve, whereas that of Keeler and Brazier 23 is above it.
Conclusions
The results of the chemical and metallographic analysis of the materials classifies them as carbon steels, more specifically mild steels, with ferrite as the main microconstituent and the presence of pearlite and retained carbon globules.
SG325 steel reported better values in the characteristics of tensile strength σu, and the elastic limit σy (0,2 %), while SG295 behaved better against the elongation to fracture A50, the strain hardening exponent n, and the normal anisotropy rm.
In both materials, the values of the anisotropy coefficient increase with the angle of orientation regarding the last lamination.
The forming limit curves are very similar. However, the SG325 sheet achieves a greater area of deformation in the safety condition, which may be due to its greater thickness

