


 English (pdf)
 Article in xml format
 Article references
 Send this article by e-mail
 Cited by SciELO
  Cited by Google
  Similars in
SciELO
Similars in
SciELO  Similars in Google
 Permalink
INTRODUCTION
Physical activity plays an important role in the prevention of non-communicable chronic disease and lowers obesity risk. It regulates energy balance and preserves or maintains lean mass instead of fat mass 1,2.
Generally, childrens’ activities, such as playing, and the development of their fundamental movement patterns of movement, which include jumping, running, dancing, and riding a bicycle, provide a wide variety and large number of vigorous activities from which to choose. However, certain studies have revealed that, because the level of physical activity during free time, at these ages, has been significantly reduced 4, the above activities are no longer regularly performed 3.
The prevalence of excess weight and obesity in the United States in the last decade affected 37.1% of children aged 6-11 years old, and 34% of those aged 12-19 years old 5. Childhood obesity is a condition related to an increase in HBP, hypercholesterolemia, hyperinsulinemia, and metabolic syndrome, a decrease in growth hormone, respiratory changes, and bone problems 5, in addition to psychological and social changes 6. Further, obesity frequently continues into adult life. The numbers indicate that 40% of children who are overweight at seven years old continue on to become obese adults 7, and that physical activity is among the causal factors in their development.
Today’s lifestyles, which keep children inactive, are predisposing factors to excess weight gain (less time dedicated to physical activity, decrease in aerobic capabilities, and more time dedicated to sedentary activities such as watching television, playing videogames, and surfing the internet) 8,9.
In Colombia, the National Survey of Nutritional Status (NSNS) (2010) indicates that virtually half of the adult population is heavy for their stature, 32.3% overweight, and 13.8% is obese, according to both American tables and WHO criteria 10. However, Colombian studies offer little information on the prevalence of excess weight and obesity in the child population, and their relationship with factors such as eating habits, physical activity levels, physical condition, and sedentary activities. Furthermore, there is minimal data regarding those modifiable factors which contribute to excess weight gain, obesity, inactive lifestyles, or low weight, which are fundamental for the implementation of intervention measures aimed at the prevention of excess weight, obesity, low weight, and the consequences thereof 10,11.
Body Mass Index (BMI) is a fundamental indicator, in epidemiological studies, which allows for the up-to-date definition of a child or adult’s nutritional status as underweight, overweight, or obese 12,13. With its universal use, the BMI has been adopted by the WHO as an anthropometric norm which serves as a reference in the monitoring and classification of growth, development, and health status, associated with either a lack or excess of nutrients 14,15. To this effect, the present investigation seeks to establish the relationship between physical activity and the BMI in Colombian school children by way of a multicenter study.
MATERIALS AND METHODS
Design
Descriptive study with a correlational phase, carried out with adolescents between 10-12 years of age, educated in public and private institutions in the cities of Manizales (Caldas), Riohacha (Guajira), Popayán (Cauca), Guadalajara de Buga (Valle del Cauca), Yarumal (Antioquia), and Zarzal (Valle del Cauca), Colombia. A random, stratified sample was used, with uniform allocation. A margin of error of 0.3 kg/m2 was employed, as was 95% reliability, for a total sample of 2,651 children distributed thus: (Manizales, 448, Popayán 442, Riohacha 441, Yarumal, 440, Buga 440, and Zarzal 440). For the variance estimate, a study entitled, “Exposición a pantallas, sobrepeso y desacondicionamiento físico en niños y niñas” was used as base 16. Inclusion criteria for enrollment in the educational institutions were as follows: being between 1012 years old, participating voluntarily, having the informed consent of a parent or guardian, and possessing student permission.
Procedure
Once the final version of the sociodemographic variable form had been obtained, authorization was requested from the municipalities, ministries of education, and educational institutions, in order to administer said form. This was applied both by investigators and interviewers who had been previously trained by investigators, and with whom the process was repeated several times, in order to reduce bias in information collection. They then proceeded to present the study, explain the objective, and accompany participants in filling out the collection form.
Measurements
Observation techniques were used together with the survey. The tools employed included the sociodemographic variables survey form, with structured questions, and the physical activity form and PAQ-C lifestyle questionnaire. Said questionnaire has been validated for Colombia 17.
The PAQ-C measures physical activity levels, from moderate to vigorous, in the last seven days of the school year. It consists of ten questions with multiple-choice answers, on a scale of five points. These questions inquire about the activities performed during one’s free time, the physical activities performed in physical education class, during recess, lunch, just after school, in the afternoons, and on the weekends. It also elicits information about physical activity performed on
the weekend and the frequency with which physical activity is performed on each day of the week 18,19. To calculate the final score, the average of the first nine questions is calculated. Question 10 is not used as part of the total score. A score of one indicates low levels of physical activity, and five indicates high levels of physical activity. Internal consistency was determined using the Cronbach’s alpha coefficient and the reliability test, by way of the intraclass correlation coefficient. The internal consistency of the questionnaire revealed a Crocker reliability of 80 19 and internal consistency values between 0.79 and 0.89 20. The PAQ-C is thus a questionnaire which contributes to the evaluation of physical activity in boys and girls during the school year.
Through use of the Tanita BC-543 scale, participant weight was obtained, and size information was gathered using a measuring rod (Seca portable stadiometer). During this process, the children were barefoot, and minimally clothed. Weight was attained with 0.1 kg precision, and height with 0.1 cm precision. The scale was calibrated after each 100 measurements.
For management of the information obtained, the BMI was classified in accordance with that established by the WHO, 2004 (21), which provides standard deviations (SD) that differentiate those who are: at risk of malnourishment (-1.9 SD, -1 SD), malnourished (<-2 SD), eutrophic (-0.9 SD, 1 SD), overweight (1 SD, 1.9 SD), obese (2 SD, 2.9 SD), morbidly obese (>3 SD), at risk of small stature (-1.9 SD, -1 SD), chronically malnourished, or small for their age (size <-2 SD).
Statistical analysis
The data were processed and analyzed in the SPSS Version 21.0 program, licensed by the Universidad Autónoma de Manizales. A univariate analysis was performed, which made the presentation of data in tables of absolute and relative frequencies possible. Central tendency and variability or dispersion measurements were calculated next. For the bivariate analysis, associations were established between study variables. In order to determine the linear relationship between variables, the Pearson correlation coefficient was used. Statistical significance was established with <0.05 p values.
Ethical considerations
The entire study was framed within the current provisions for the protection of those human subjects who participated in the investigation. These are contained in the Colombian Ministry of Health’s Resolution 8430 of 1993, and the Helsinki Declaration, classifying study “with minimal risk”, in accordance with letter b of Article 11 22. The approval of the Universidad Autónoma de Manizales’ Investigation Ethics Committee was also obtained.
RESULTS
Exactly 2,651 schoolchildren between the ages of 10-12 years old participated in this study. The male-female ratio was 1:1, with 36.1% 10-yearold, 32.7% 11-year-old, and 31.2% 12-year-old boys.
In order to compare physical activity levels by both sex and age, previous verification of normality and homoscedasticity assumptions was necessary. It was shown that normality was not present, and that statistically significant differences occur between the sexes, p<0.05 according to the U MannWhitney test. Statistically significant differences were revealed, by age, in the average of the three groups, with significantly fewer differences than in the group of 10-year-olds, which had the lowest physical activity level score obtained, (p<0.05) according to the Kruskal-Wallis test (Table 1).
Table 1 Difference of means of physical activity by sex and age.
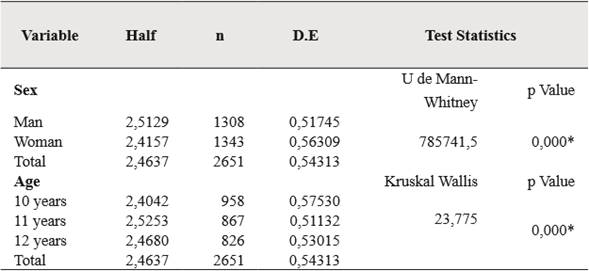
(*) Statistically significant association
Source: Author elaboration.
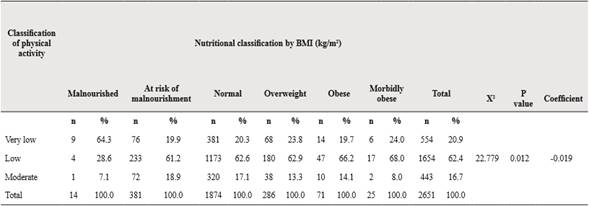
In both the male and female groups, the greatest percentage of participants presented normal BMIs, although statistically significant differences were found between these variables (p<0.05), even though the coefficient value supposes that there is no dependence relationship there between.
When comparing BMI averages by age and sex, it was observed that, in all age groups, and with both sexes, the greatest percentage of schoolchildren enjoyed normal BMIs. It is important to highlight that, in the group of 10 and 11-year-olds, malnourished children were present, and the risk of malnutrition in all age groups was higher in males than in females. Statistically significant differences between the sexes were not found in the BMI nutritional state p<0.05 (Table 2).
Table 2 Nutritional classification by BMI, age, and sex.
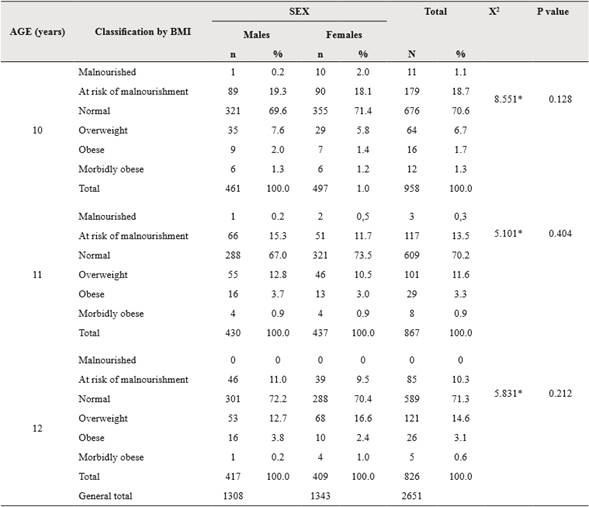
(*) Chi Square statistic
Source: Author elaboration.
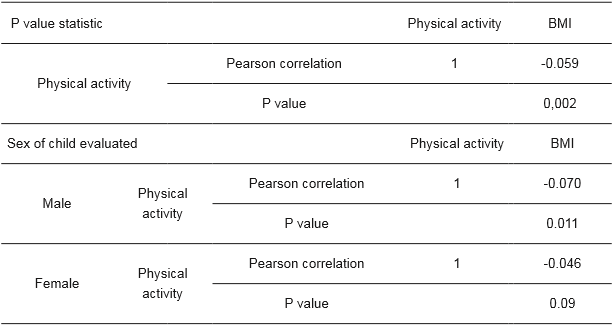
The correlation coefficient between physical activity and BMI was quite low. In other words, the greater the physical activity, the lower the BMI. This association was statistically significant in males (p<0.05) (Table 4).
DISCUSSION
In the population studied, 70.7% of the children were of normal weight, and 10.8% were overweight, data which contrasts with the results of Bojórquez’s investigation, in which 7.3% of children who participated were underweight, and 42% were overweight and obese 23. It also contrasts with that reported by Aviña et al., whose study reveals that, in the schoolchildren studied, 4.05% were underweight, and 45.3% were either overweight or obese 24. Similarly, Fernández finds that 3.7% of the children in their study were underweight, 79.5% were of normal weight, 7.9% were at risk of excess weight, and 8.8% overweight in their study 25.
Regarding sex and age, statistically significant differences were found with the degree of physical activity. Similar results were reported in a study of 3,742 children, with a significant difference in favor of males over females (26.27%). In another study, carried out in Madrid, which calculated the number of minutes that children dedicated to physical activity during the week, in a population of 253 students between 10-13 years old, it was found that the time that boys spent being physically active was significantly higher than that of girls (p<0.001) 28. Yet another study reported that just 46.1% of girls performed extracurricular physical sporting activities, in contrast to 60.3% of boys, 29. Similarly, Ruiz evaluated 120 schoolchildren from 12-14 years of age, and found a significant difference between sexes p = 0.000 30. This reveals that girls perform less physical activity than boys during both pre-adolescence and adolescence, which could affect their motor development 31. More recent studies evaluated the possible differences between anthropometric variables and the physical condition of schoolchildren in primary school and showed a difference in the level of physical activity between sexes 32.
In the population studied in the present investigation, the higher the amount of physical activity, the lower the BMI. This data differs from the results of by Chacón et al., who report that, about physical activity and the degree of obesity, the data do not correlate (p = 0.595), and that statistically significant differences were not found 33. In this same sense, Albán et al. (2011) did not discover any statistically significant difference between BMI and the type of physical activity 34. Additionally, one study carried out in Belgium, with 2,517 students ranging from 5-13 years old, concluded that the weight of the child negatively influenced future physical activity levels, and especially affected certain motor skills, such as gross motor coordination and vice-versa 35. Similarly, transversal studies have demonstrated negative correlations between BMI, gross motor skills, and coordination in the normal development of children and young adults. One investigation performed in Portugal, on children between 10-14 years old, revealed that all correlations between the motor coefficient (MC) and BMI were negative, and varied between 0.05 and 0.49 36. The authors recognize that those restrictions which are inherent to descriptive study may limit the present investigation. However, the sample framework suggests the presence of important evidence regarding the problem studied. From these results, new analytical and/or experimental studies, that permit a focus on the suggested causal relationships, may be formulated.
CONCLUSION
The fact that analysis of the relationship between physical activity and BMI in schoolchildren reveals that this association, apart from being statistically significant, is also inverse, should motivate physical activity in family, school, and social contexts. This is because it directly impacts their nutritional status. Both variables are considered to be predicting variables of adult cardiovascular problems, which, in the context of world public health, occupy the first places in causes of morbidity and mortality in different population groups. Similarly, the results of this investigation should be considered in training curriculums, in order to incentivize professionals in the importance of interdisciplinary work for the promotion of physical activity from childhood.

