


 English (pdf)
 Article in xml format
 Article references
 Send this article by e-mail
 Cited by SciELO
  Cited by Google
  Similars in
SciELO
Similars in
SciELO  Similars in Google
 Permalink
Introduction
Food and nutrition issues are global concerns because of their effects on human development, health, and well-being. Developing countries house most of the people who suffer the double burden of malnutrition, which coexists with inequitable development models and high levels of poverty 1,2. In 2016 Latin America and the Caribbean showed the highest concentration of wealth indexes, while 5.5% people suffered from hunger 3. In Colombia that reality is similar, in 2019 35.7% of its population was living in poverty and, with a Gini index of 0.526, the country was classified as the most inequitable in South America 4.
Health inequality refers to unnecessary, avoidable, and unfair differences, variations, and disparities in the health status of individuals and groups 5,6. In the specific case of nutrition, the economic and social circumstances of a country and its inhabitants result in a social gradient of the diet, which contributes to health inequalities 7. Food consumption is influenced by inequality, which is expressed by both deficiencies and excesses that originate nutritional imbalances 7, Therefore, it is the consumption pattern, more than the absence of specific nutrients in the diet, that evidences the real circumstances of food availability and the differentiated conditions of the population’s inclusion in different social environments 8.
The 2005 National Survey of Nutritional Status of Colombia (ENSIN) 9 showed that food insecurity (FI), defined as the household financial inability to access food in the required quantity and quality, was at the level of 42.7%, a value that increased by 1.9% in 2010 9,10. An FI rating was more common in households with lower income, in those with a female as the householder, and in the poorest regions of the country 9. There were also marked differences in FI according to socioeconomic status (following the household classification provided by the System for Identification of Potential Beneficiaries of Social Programs (SISBEN): 60.1% in Level 1 (the poorest) versus 27.8% in Level 4-6, and according to the type of area: 36.5% in urban areas versus 58.2% in rural areas 10. Similar results were found in other studies in regions and/or countries with different levels of development 8,11-13.
When considering consumption by food group, the 2005 ENSIN found that approximately 50% of the population did not report consumption of eggs and legumes, 25% did not report consumption of dairy products or vegetables, 33% did not report consumption of fruit, 15.2% did not consume any kind of meat or meat by-products, and only 10% reported not consuming cereals or their by-products, or tubers or plantains 14.
The situation described makes the relationship between inadequate food consumption and socioeconomic conditions evident. It is unknown, however, how these inequities are expressed in terms of food consumption by the population. Therefore, the objective of this study was to identify the inequities in food consumption of the Colombian population according to socioeconomic status and Food Security (FS) classification.
Materials and methods
This study was based on secondary sources of information (2005 ENSIN). Therefore, according to Resolution 008430 of 1993 by Colombia’s Ministry of Health, it is classified as No-risk Research. Implementation of the ENSIN was approved in 2004 by Profamilia’s Committee of Ethics and Clinical Studies, and fulfills the ethical principles developed by the Declaration of Helsinki (and its revision from 2008 in Seoul) for research in humans.
A descriptive, cross-sectional study was performed. The sources of information were data about food consumption and the qualitative evaluation of household food security. The analysis started with the first 24-hour recall applied by trained and standardized dietitian nutritionists to 39,413 Colombians, all of them apparently healthy, between ages 2 and 64 (pregnant women were not included) 9,14, and distributed in 17,741 households from all over the country. Food models, geometric shapes, and real-size pictures of kitchen utensils were used to determine the quantity of food ingested 15.
Given that the unit of analysis for all the FS information was each household, the analysis of ingested food required the summation of the consumption (grams) of each member of the household per group of food. The database was debugged to eliminate extreme values for each nutrient. Some values considered unacceptable were excluded, and others were corrected based on the original source. All data was entered in the Evaluation of Dietetic Consumption software, property of The School of Nutrition at University of Antioquia, and which includes nutritional information of the food composition tables of Colombia, Latin America, and the USDA Handbook 8 Database. The information about the nutrients was sent to the Department of Statistics at Iowa State University, where it was analyzed with PC-Side software version 1 (Personal Computer version of software for intake distribution estimation). The software estimated the usual consumption of a nutrient, and compared it with each of the estimated average requirements (EAR) by age group and gender.
The other variables included in the analysis were:
Socioeconomic Status - SES
This variable was obtained from the classification index made by the SISBEN, a Colombian targeting instrument that identifies potential beneficiaries of social programs 16. The index was constructed based on a questionnaire applied to households, which captures information on each of its members, characteristics of the housing unit and its habitability, socioeconomic conditions, and quality of life inside the household. People who are identified as potential beneficiaries can access benefits granted by the State by means of different programs, each of them with specific regulations and requirements 16. According to the characteristics evaluated, this index scored household between 0 and 100 taking into account urban and rural area. Thus, in urban household the distribution score was: level 1 (0 to 11 points), level 2 (11,01 to 22), level 3 (22,01 to 43), level 4 (43,01 to 65), level 5 (65,01 to 79) and level 6 (79,01 to 100); for the rural area it was: level 1 (0 to 17,5 points), level 2 (17,51 to 32), level 3 (32,01 to 51) and level 4 (51,01 to 100). The population in the lower levels of the SISBEN index are more vulnerable, and therefore a priority for the State’s economic and social programs.
Classification of the household food security -FS-
The 2005 ENSIN evaluated the household FS with the scale adapted by Álvarez and collaborators 17.
The scale has 12 items related to the availability of money to buy food, the decrease of food in the household because of the lack of money, and the experience of hunger by any of the household members. The frequency of each item was coded in the following way: “always”, three points; “sometimes”, two points; “rarely”, one point; and “never”, zero points. According to this code system, households with members under 18 years old had a score range between 0 and 36 points, and were classified into four categories: 0 points, “secure”; 1-12, “mild FI”; 13-24, “moderate FI”; and 25 or more, “severe FI”. Households without members under 18 years old had a maximum score of 21 and were classified as follows: 0 points, “secure”; 1-7, “mild FI”; 8-14, “moderate FI”; and 15 or more, “severe FI”. In this study, households were dichotomized into secure and insecure households, the last group including those with mild, moderate, and severe FI.
Data Analysis
The statistical analysis took into account percentile distributions, means, standard deviations, percentages, and 95% confidence intervals. The Kolmogorov-Smirnov test was used to evaluate the assumption of normality. The Mann-Whitney U test and the Kruskal-Wallis one-way analysis of variance were also used. In the latter, multiple comparisons were performed through the Mann-Whitney U test.
A multivariate analysis was performed through multinomial logistic regression models 18,19, with each of the food groups as a dependent variable. Each group of food was divided into quintiles of consumption and one of these quintiles was defined as the reference. The bottom quintile of consumption was used as the reference for the following groups of foods: sweets and sugars, non-alcoholic beverages, cereals, and tubers and plantains. The top quintile of consumption was used as the reference for meat, fruit, fats, eggs, dairy, and vegetables. SES and the FS classification were used as independent variables. In those cases, where the interaction was not statistically significant, the analysis was focused on the principal effects.
Data analysis was performed using SPSS software version 18 for Windows (Chicago: SPSS Inc.; 2010) and Stata version 10.1 (Stata Corporation, 702 University Drive East, College Station, TX, USA). All data were adjusted using the sampling weight of each household.
Finally, a latent class analysis (LCA) 20 was performed to capture the heterogeneity of the inequalities in food consumption in the households, which allowed the identification of the number, size, and characteristics of “latent” groups. The LCA took into account FS, SES, and food groups categorized into consumption quintiles as variables of classification. The likelihood ratio test statistic G2, the Bayesian information criterion (BIC), and the interpretability of the model’s parameter estimates were used to determine the optimum number of latent classes and the best-fitting model, and special attention was paid to the interpretability of the response profiles for each of the classes. The model with the lowest BIC and G2 was considered the best-fitting model. The previous criteria supported the selection of a model with three latent classes. To facilitate the interpretation, the classes were labeled: “households with low food consumption”, “households with moderate food consumption”, and “households with high food consumption”. These procedures were performed with poLCA 1.3.1 software package implemented in the R 2.12.0 statistical computing environment for Windows 20,21.
Results
The analysis according to the FS classification found that secure households had a higher median consumption of the following groups: meat, dairy, vegetables, fruit, and sweets and sugars. Insecure households showed a higher median consumption of cereals, tubers and plantains, and non-alcoholic beverages (Table 1).
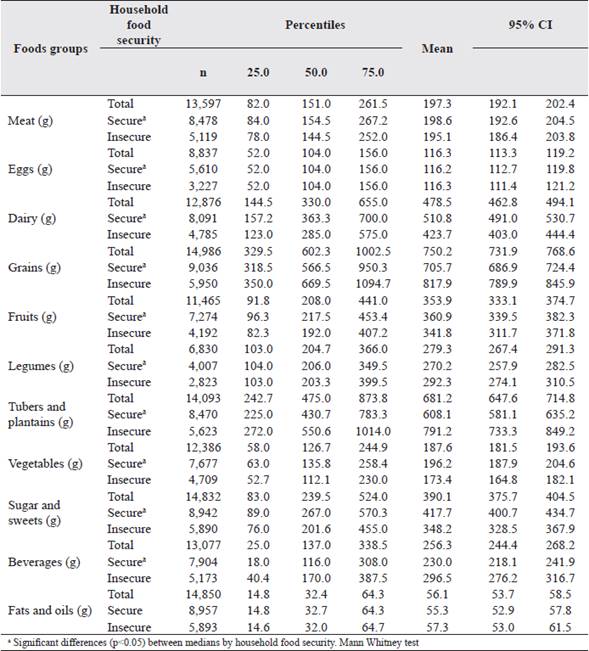
According to the median of grams of food consumption, for a higher SES there was a lower consumption of cereals, tubers and plantains, non-alcoholic beverages, and fats. On the contrary, there was a tendency for a higher consumption of dairy, fruit, vegetables, and sweets and sugars in Levels 3 and 4- 6 of SES. Egg consumption did not fluctuate across SES levels (Table 2).

Multinomial Analysis
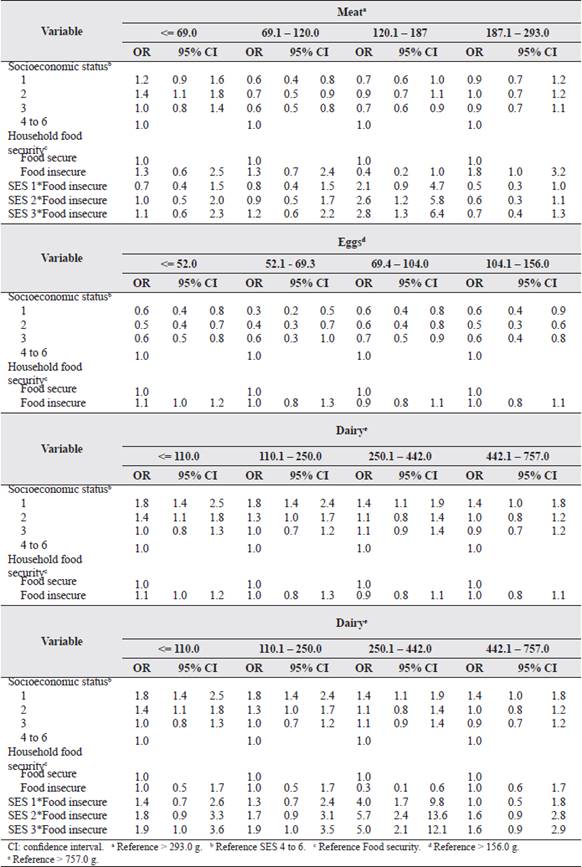
There was no clear tendency in terms of the probability of consumption of meat according to SES, but it was noticeable that, compared to the reference group, the probability of consumption between the first and third quintiles was lower for Levels 1, 2, and 3 of SES. Analyzing the interaction, the probability of consumption in the third quintile was higher among food-insecure households of Levels 2 and 3 of SES, while food-insecure households of Level 1 of SES had a lower probability of having meat consumption higher than the fourth quintile. Tables 3, 4 and 5 present disaggregated information for this and the other food groups.
Table 3 Association between consumption (grams) of meat, eggs and dairy groups by socioeconomic status and household food security, Colombia. 2017.
Source: Author’s elaboration
Table 4 Association between consumption (grams) of grains, fruits, legumes, tubers and plantains, vegetables groups by socioeconomic status and household food security, Colombia. 2017.
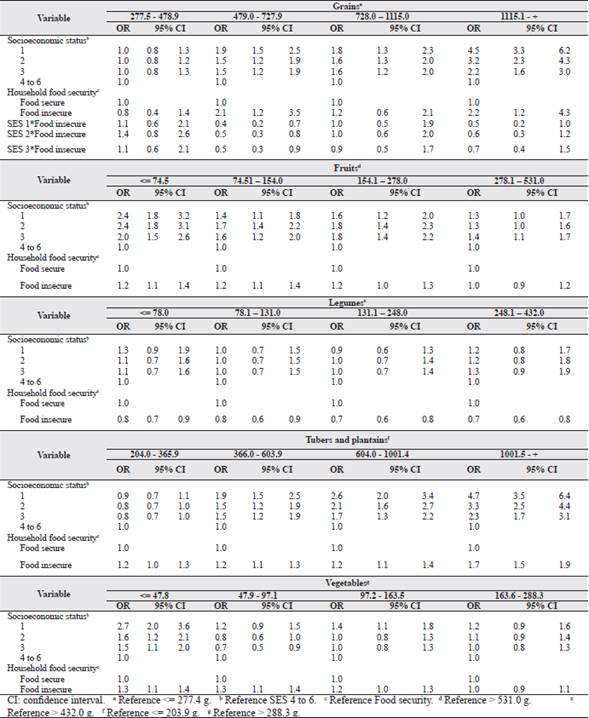
Source: Author's elaboration
Table 5 Association between consumption (grams) of sugar and sweets, beverages and fats and oils groups by socioeconomic status and household food security, Colombia. 2017.
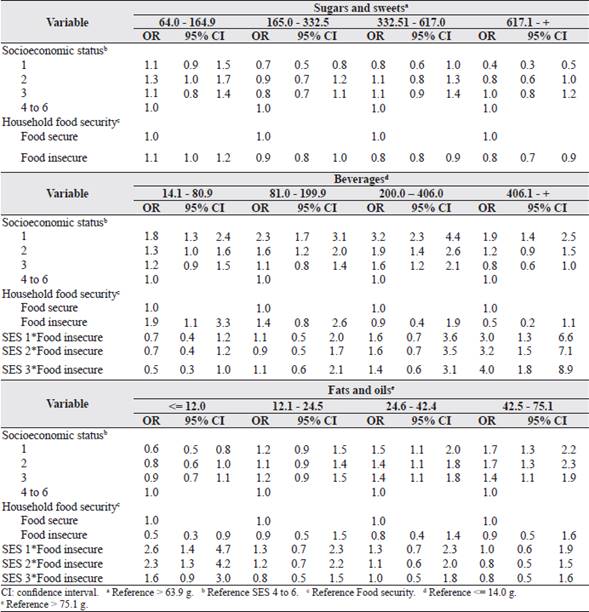
Source: Author’s elaboration
Taking FS into account, there was no difference in egg consumption across the different quintiles of consumption. However, the probability of its consumption was higher in the Level 4 - 6 of SES.
Households in Level 1 of SES have a lower probability of high consumption of dairy. Compared to food-secure households, the food-insecure households have a lower probability of having dairy consumptions equivalent to those of the third quintile. Analyzing the interaction between SES and FS, food-insecure households from Levels 1 to 3 of SES had higher probabilities of reaching the aforementioned consumptions.
In terms of cereal consumption, it was observed that at higher levels of SES there was a lower probability of consumption above 479g. Besides, in food-insecure households the probability of consumption between 479-727.9g and above 1115g was double that of food-secure households. The analysis of the interaction found an association between SES and FS for the second quintile, and food-insecure households in Level 1 of SES are 50% less likely to have cereal consumption higher than 1115g.
The analysis of fruit consumption showed that in all the levels of SES, especially in Level 1, the highest probability of consumption was associated with the first quintile. Probabilities of consumption in the second and third quintiles are higher for Levels 2 and 3 of SES. Food-insecure households presented a higher probability of consuming less than 154g of fruit. There was no effect of SES in the consumption of legumes, but considering FS, food-insecure households had a lower consumption of this food group.
The consumption of tubers and plantains showed a clear social gradient. To a higher SES there was a lower probability of consumption of this food group across all the quintiles of consumption. Also, in Level 1 of SES, the probability of consumption higher than 1001.4g was almost five times greater than in Level 4 - 6. Considering FS, food-insecure households had a higher consumption in all the quintiles.
Compared to households in Level 4 - 6, those in Levels 1 and 2 were most likely to consume less than 47.8g of vegetables. Food-insecure households were significantly different to food-secure households in the lowest quintiles of vegetable consumption (≤ 97.1 g). In terms of sweets and sugars, households in Level 1 of SES were less likely to consume more than 165g. Food-insecure households had a lower probability of consuming more than 332.5g of this food group.
The analysis of non-alcoholic beverage consumption showed that at a higher level of SES there was a lower probability of a high consumption of this food group, and this was more evident for the second and third quintiles. Besides, there was a significant interaction between FS and SES, and, for food-insecure households, the probability of being in the quintile of higher consumption of non-alcoholic beverages increased with the level of SES.
Compared to those in Levels 3 and 4 - 6 of SES, households in Levels 1 and 2 had a higher probability of having fat consumption above the third quintile. Besides, food-insecure households from Levels 1 and 2 of SES were more likely to consume ≤12g of fat.
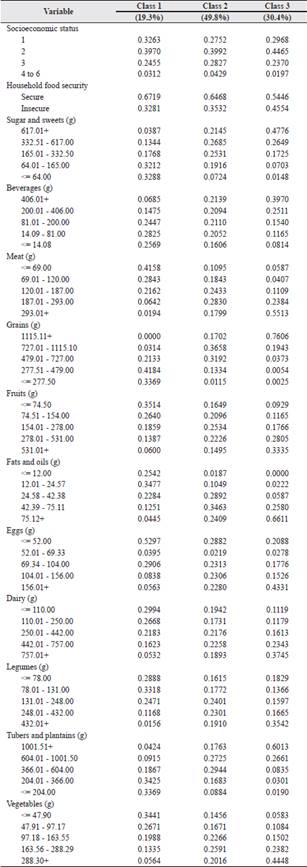
Latent Class Analysis
Finally, the LCA grouped 19.3% of the households under the class “low food consumption”. This group was characterized by mostly Levels 1 and 2 of SES; 67∙2% of food-secure households; and the following consumption of the food groups: sweets and sugars ≤165g, non-alcoholic beverages ≤81g, meat≤69g, cereals 277.5 - 479g, fruit ≤74.5g, fats 12 - 24.57g, eggs ≤52g, dairy ≤110g, legumes 78 - 131g, tubers and plantains ≤366g, and vegetables ≤47.9g.
The class “moderate food consumption” grouped 49.8% of the households and was characterized by a high presence of the Level 2 of SES; 64.7% of food-secure households; and the following consumption of the food groups: sweets and sugars 165-617g, non-alcoholic beverages >81g, meat 120-293g, cereals 479-1115.1g, fruit 154- 278g, fats 42.4-75.1g, eggs ≤52g, dairy 250-757g, legumes 131-432g, tubers and plantains 366- 1001.5g, and vegetables 97.2-163.5g.
The class “high food consumption” included 30.4% of the households and was characterized by a predominant presence of the Level 2 of SES; 54.5% of food-secure households; and the following consumption of the food groups: sweets and sugars >617g, non-alcoholic beverages >406g, meat >293g, cereals >1115.1g, fruit >531g, fats >75g, eggs >156g, dairy >757g, legumes >432g, tubers and plantains >1001.5g, and vegetables ≥288.3g (Table 6).
Discussion
Among the Colombian population there are inequalities in food consumption according to their SES. Households in the higher levels of SES showed higher consumption of the following food groups: dairy, fruit, vegetables, and sugars and sweets, while households in the lower levels of SES had higher consumption of the following food groups: cereals, tubers and plantains, non-alcoholic beverages, and fats. The LCA showed there was a high consumption of all of the food groups in the class “high food consumption”. The disaggregated analysis, however, found that conditional probabilities were higher at the expense of groups like sweets and sugars, non-alcoholic beverages, cereals, fats, and tubers and plantains. That profile was combined with a drop in the probability of FS regarding the other latent classes, and therefore households in this class were characterized by a higher caloric intake diet, but a lower nutritional density, which is an undesirable aspect, given its association with the appearance of non-communicable chronic diseases.
Our findings are consistent with those of Bragança and collaborators 22 in Brazil, who showed that an increase in per capita income promotes transformations in consciousness about the consumption of nutritional food. Our results are also similar to those of Giacomo and collaborators 23 who found that foods like sugar, oil, rice, bread, coffee, milk, meat, and eggs were eaten by 30% or more of the low-income population. In Nicaragua, it was observed that low-income rural households with an illiterate householder have monotonous diets based on a reduced number of foods, because more than half of their dietary energy comes from only five foods, especially cereals 24.
Also consistent with these results are those from a study in Medellín, Colombia, which established, through the methodology of the basic family shopping basket, that households from the highest SES had more availability of foods like dairy and meat, and more provision of fruit and vegetables. Besides, there was an evident social gradient in the number of available foods according to SES. Households from SES 1 reported 33 foods in a week, while those from SES 6 reported 67 25, showing the richest social level had access to double the amount of food than the poorest social level. Another study, conducted with displaced families from Girón-Santander (Colombia), found that, compared to other studies with non-displaced families in the region 26, the displaced families eat double the amount of cornmeal, 30% more rice and unrefined whole cane sugar, and almost three times more plantains; also, consumption of beef (or chicken) and milk was reported only by 31.7% and 59.4% of the families, respectively.
In terms of consumption patterns of the low-income families, studies in this field have shown that these families tend to eat protein sources in less quantity, variety, and frequency, and that those sources are replaced by carbohydrates or by meats with high fat content and less nutritional value. Given that in these households most of their low income goes to food shopping, the cost of food and the fluctuation of its prices are extremely serious issues. In these households the expense is oriented towards calorie-rich foods that must go a long way, be tasty, cheap, and, above all, be filling; all those requirements put aside the consumption of more expensive sources of protein and micronutrients (3, 27). Low quality and low-cost diets are associated with a high energy intake and a growing prevalence of obesity 28,29.
In terms of consumption patterns, there were clear differences among the food groups. It is important to mention that even though households in the highest SES had the highest consumption of fruit and vegetables, they did not reach the amount of 400g/person/day recommended by the World Health Organization (WHO) 30. The trend towards low consumption of fruit and vegetables also has been observed in other countries in the Latin American countries such as: Argentina, Brazil, Chile, Colombia, Costa Rica, Ecuador, Peru, and Venezuela 8,31.
Different studies have shown that FI has a significant inverse relationship with the frequency of consumption of fruit, vegetables, meats, and eggs, all of which could result in a poor health and nutritional status 8,13.
The classification of the households’ food security also pointed out inequalities in food consumption in Colombia. Food-insecure households had a lower consumption of foods with high nutrient density like dairy, meat, fruit and vegetables, a result that was also found in Mexico 32.
It is important to keep in mind that the error in the estimation of the 24-hour recall is not necessarily correlated with the error in the classification of the household FS. Even though in our study the residuals are significantly correlated with IA and SES, this doesn’t imply that a bias in the estimation of the 24-hour recall is connected to a bias in the classification of the household FS. Besides, because of the algorithm used by the National Planning Department to estimate SES, the errors in the measurements of SES and food consumption are independent.
Our findings show that the population in the lowest SES was characterized by the consumption of a diet limited in protein and micronutrients, which represents a risk factor for stunting, poor cognitive development, and chronic diseases related to nutrition, all of which contributes to the human and economic underdevelopment of the country and the region 33. For a developing country such as Colombia, these types of foods of high nutritional value are more consumed by the population in high SES, since these are more expensive and the population in low SES consider them luxurious food 34.
Different studies show that the availability of food in Colombia has increased in the last decades 35,36, therefore, availability is not an obstacle to achieving food security in the country. On the other hand, poverty and inequality indeed restrict the poorest population’s access to high quality and diverse foods.
Health inequalities are a reflection and a consequence of social and economic inequalities; besides, they are related to the enforceability of human rights and constitute a social injustice phenomenon, all of which cause measurable results in health losses and drastic consequences in the nutritional status of the population 37.
At this point, is worth mentioning that structural factors that cause the problems of hunger and malnutrition in the world, and specifically in the country, have not been resolved. Poverty, hunger, and inequity are still phenomena affecting an important segment of the population and are the main obstacles to achieving food and nutrition security.
Some studies have shown that a population’s health is mainly affected by the economic and social conditions that cause people to get sick and look for medical attention. As a result, the more effective strategies are beyond the scope of the health care system, and therefore multi-sector policies have to be applied 1,33,38. Similar issues exist in the area of nutrition, in which inequalities in consumption among social groups is determined by their economic and social conditions 7,27,29.
In this study, families from the lowest SES and living in food-insecure households had the lowest consumption of the food groups with high nutritional value: meat, dairy, and fruit and vegetables. This situation proves the fact that individual lifestyle choices are determined by social and economic factors, which somehow hinder the individual’s ability to change his lifestyle 39,40.
Strengths and limitations of the study
This is the first study that has explored, in a national representative sample, the inequalities in food consumption in Colombian households, according to SES and FS classification by means of a validated and easy-to-apply method.
However, given the cross-sectional nature of the study, there was no way to establish causality between the evaluated variables. Food consumption data did not include a second recall, which could have affected the precision of the intra- and inter-individual variability. The 24-hour recall was applied to people aged 2 to 64 years, and was not applied to pregnant women, therefore the households’ consumption might not reflect the consumption of all of their members. Besides, even though scientific references consider that food consumption is influenced by factors like age, nutritional status, educational level, and knowledge about food and nutrition, in this study food consumption was estimated by household, and therefore it was not possible to adjust consumption by any of the aforementioned possible confusing factors.
Conclusions
The results of this study show there are inequalities in food consumption in Colombia. Those inequalities are associated with variables like SES and FS, which determine financial access to food, and become an indicator of people’s social rank and human capital development of the countries. All this translates into differentiated consumption in terms of the quality of the diet, therefore people and families in the most unfavorable socioeconomic status have diets with less nutritional value.
Some alternatives that could be proposed to reverse the inequalities in food consumption in the country are aimed at: state support for the agroecological production of healthy foods such as fruits and vegetables; strengthening of food distribution models through short circuits and fair and supportive markets; price subsidies for foods of high nutritional quality; promotion of healthy environments for the responsible consumption of food and; tax exemption for foods with high nutritional density and taxed processed foods with high caloric contribution and low contribution of critical nutrients.

