


 Spanish (pdf)
 Article in xml format
 Article references
 Send this article by e-mail
 Cited by SciELO
  Cited by Google
  Similars in
SciELO
Similars in
SciELO  Similars in Google
 Permalink
Introduction
Osteoporosis is a systemic disease characterized by loss of mineral bone mass. Due to its prevalence around the world, osteoporosis is considered a serious public health problem. At least 30% of postmenopausal women in the United States and Europe have osteoporosis. (1 About 40% of these women and 15-30% of men will have one or more fragility fractures. (2
The World Health Organization (WHO) defines the disease according to the measurement of bone mineral density (BMD) by dual x-ray absorptiometry (DXA). BMD values of the femoral neck ≤-2.5 SD are considered osteoporosis. (3,4 The main difficulty in assessing fracture risk is that the T score threshold ≤-2.5 SD has a high specificity but low sensitivity and many of the fragility fractures occur in individuals with BMD values above the osteoporosis threshold. (5
FRAX is the most widely used fracture risk assessment tool, demonstrating a high predictive capacity. (6 FRAX uses mortality and fracture rates and by combining multiple risk factors (age, sex, body mass index, family history of fracture, alcohol and tobacco consumption, rheumatoid arthritis, use of glucocorticoids and fragility fractures) and the presence or absence of femoral neck DXA, predicts a percentage of fracture risk. (7 The FRAX has been validated and adapted to different countries, covering almost 80% of the world's population, (8 including Ecuador for where it was adapted in 2009. (9
Due to the great variability in fracture and mortality rates in the different regions, the FRAX model is calibrated based on local epidemiology, which makes it difficult to use universal intervention thresholds based on FRAX. For example in the study of Maldonado et al. it was found that the risk of major osteoporotic fracture according to FRAX Ecuador was 1.4%, and when the FRAX calculators for Colombia, Brazil and the United States (Hispanic) were applied to the same population, the fracture risk percentages were higher (4.8%, 3.20%, and 2.08% respectively). (10 Due to this difference in values and the new trend of implementing intervention and evaluation curves in the osteoporosis management guidelines, (11,12 the authors launched in July 2017 a proposal of these curves for the Ecuadorian population. (13 In this paper we present the elaboration and application of these curves.
Methods
Using the FRAX Ecuador model available on the web, we calculated the probability of major osteoporotic fracture and female hip fracture without any risk factor and without the inclusion of BMD. The probabilities were calculated in 5-year intervals from 40 years to 90 years. The BMI was set at 25 kg/m2 for all calculations.
Likewise, the probabilities of a major fracture and a hip fracture were calculated in 3 different scenarios:
History of prior fracture without the inclusion of BMD.
T score -2.5 SD without other clinical risk factors.
T score -1.5 SD without other clinical risk factors.
These scenarios were established based on recommendations from the osteoporosis treatment guidelines. The National Osteoporosis Foundation recommends initiating treatment in patients with a T score ≤-2.5 SD (BMD based intervention threshold). (14 On the other hand, the National Osteoporosis Guideline Group (NOGG) recommends intervention in women with a history of fragility fracture without the need for BMD and in women without prior fracture but with an age-specific FRAX probability equivalent to that of a woman with prior fracture (intervention threshold based on FRAX). (15 The T score -1.5 SD was chosen to represent osteopenia. The probabilities of fracture by age of the intervention thresholds were compared with the specific probabilities by age without clinical risk factors (without the inclusion of BMD).
In addition, the evaluation thresholds for BMD were calculated according to the NOGG. Several studies have shown that the inclusion of BMD in the calculation of the FRAX probability is most useful when the fracture probabilities are close to the intervention threshold, (16,17 that is, in people in whom there is a reasonable probability of that by including BMD in the FRAX calculation their risk of fracture goes from high to low or vice versa. Based on that, the evaluation thresholds were defined as follows:
The lower evaluation threshold corresponds to the FRAX probabilities for which neither the treatment nor the BMD test should be considered. This was based on the 10-year probability, without BMD, of a major osteoporotic fracture, in women without clinical risk factors, since the guidelines state that people without clinical risk factors should not be considered eligible for evaluation. (18
The upper evaluation threshold corresponds to the FRAX probabilities for which treatment can be recommended without the need for BMD. The intervention threshold was set at 1.2 times since Kanis et al. (15 found that when patients have a fracture probability equal to or greater than 20% of the intervention threshold, the addition of BMD in the calculation of FRAX probability has no greater effect.
Results
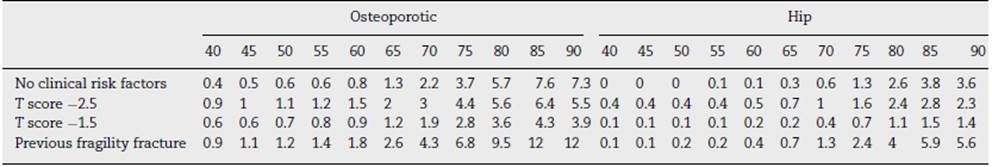
In women without risk factors, the probability of a major osteoporotic fracture increased with age from 0.4% at 40 years to 7.3% at 90 years. Likewise, the probability of hip fracture increased with age from 0% at 40 years to 3.6% at 90 years. The probability of a major osteoporotic fracture increased in women with a T score of -2.5 SD from 0.9% at 40 years to 5.5% at 90 years; with a T-score of -1.5 SD, from 0.6% at 40 years to 3.9% at 90 years; and in women with a history of fracture from 0.9% at 40 years to 12% at 90 years (Table 1).
Intervention threshold
In 50-year-old women with a T score -2.5 (intervention threshold based on BMD), the probability of osteoporotic fracture was 1.8 times higher than in women of the same age without any risk. As the age progressed, the difference in probabilities between these two groups was decreasing. From the age of 80, the probability of fracture was lower in women with T score -2.5 than in women without risk factors. The same happened with the T-score group -1.5, from the age of 65, the probability of fracture was lower in this group than in women without risk factors. On the other hand, the probability of fracture was consistently higher in the group of women with a history of fracture (intervention threshold based on FRAX), than in women without risk factors (Table 2).
Table 2 Ratios between FRAX probabilities of major fractures when compared with the group of women without risk factors. The points from which the FRAX probabilities with T score −1.5 and −2.5 are lower than in women without FR are shown in red.
| 40 | 45 | 50 | 55 | 60 | 65 | 70 | 75 | 80 | 85 | 90 | |
| T score -2.5 vs no FR | 2.3 | 2.0 | 1.8 | 2.0 | 1.9 | 1.5 | 1.4 | 1.2 | 1.0 | 0.8 | 0.8 |
| T score -1.5 vs no FR | 1.5 | 1.2 | 1.2 | 1.3 | 1.1 | 0.9 | 0.9 | 0.8 | 0.6 | 0.6 | 0.5 |
| 1.8 | |||||||||||
| Previous fracture vs no FR | 2.3 | 2.2 | 2.0 | 2.3 | 2.3 | 2.0 | 2.0 | 1.7 | 1.6 | 1.6 |
Fig. 1 shows the comparison of intervention curves. As evidenced, the curve corresponding to T-score -2.5 crosses the curve of women without risk factors, thus demonstrating that the intervention threshold using a fixed T score becomes less appropriate as age advances. On the other hand, the FRAX intervention curve with a history of prior fracture is always above the curve of women without risk factors. This suggests that the probabilities equivalent to a previous fracture constitute a better reference value above which patients could receive treatment in the absence of a previous fracture.
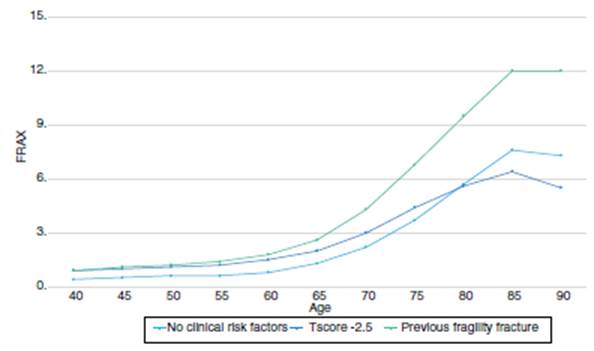
Fig. 1 10-year probability (%) of major osteoporotic fracture in Ecuadorian women without risk factors, with a T score of −2.5 SD, −1.5 SD and previous fracture.
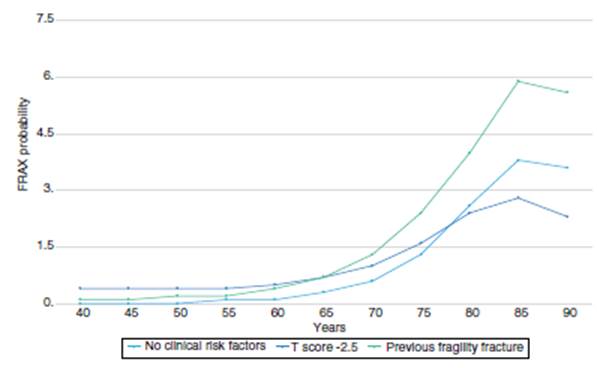
We found similarities when analyzing the probabilities of hip fracture. From the age of 80, the probability of fracture with a T score -2.5 SD was lower than in women of the same age but without risk factors. With a T score -1.5 this trend was seen from the age of 65 (Fig. 2).
Evaluation threshold
According to the NOGG guidelines, the intervention threshold corresponds to the FRAX probability equivalent to a woman with a previous fragility fracture. The lower evaluation threshold was established in the age-specific probabilities of women without clinical risk factors. The superior evaluation was set at 1.2 times the intervention threshold. The three thresholds are shown in Table 3.
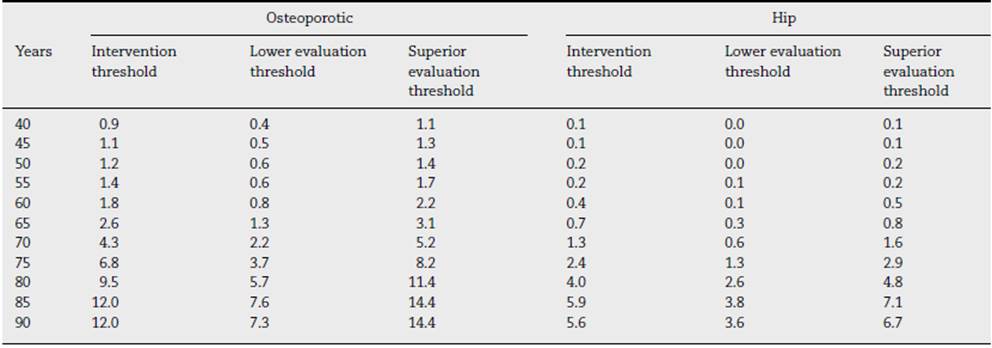
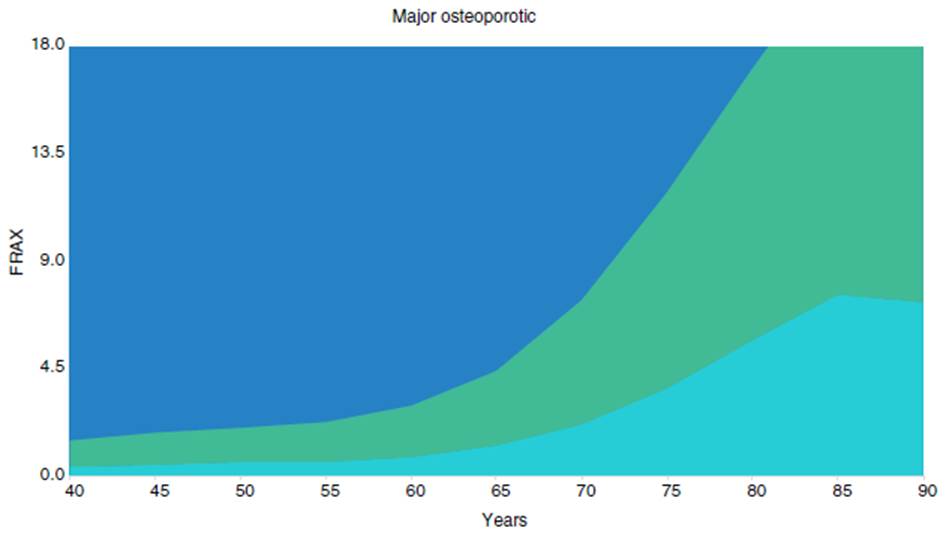
Fig. 3 shows the established thresholds based on the FRAX of major osteoporotic fracture. The orange area is where the treatment could be recommended, the gray area is where the treatment would not be recommended and the yellow area is where BMD could be measured to improve the estimation of the risk of fracture.
Discussion
BMD has proven to be a predictor of fracture risk. (19 For this reason, criteria based on BMD have been adopted as intervention thresholds, however, it is evident that there is a weakness in the use of fixed BMD values. At first, a T score of -2.5 was a strong risk factor for fracture at an early age, but as the age advanced the association with fracture risk decreased. An 80-year-old woman from Ecuador with a T score of -2.5 has a lower probability of fracture than a woman of the same age without any risk factor, which makes the T score -2.5 seem like a fracture protective factor at that age.
Similar results were presented in the study by Johansson et al. (20 since the FRAX probability in 85-year-old women with T score -2.5 was lower than in women without risk factors, while for women with a T score -1-5 the effect was seen from the age of 70. In another study, (21 starting at age 80, a T score of -2.5 SD appeared to be a protective factor for fracture. The reason for this event is the decrease in BMD that occurs with age. In one study it was shown that the average T-score for women of 80 years was less than -2.5, (22 demonstrating that in women > 80 years old, clinical risk factors alone are enough to make therapeutic decisions. Applying DXA in these age group may have no influence on the fracture risk.
Another problem in recommending treatment only when the BMD T score is <-2.5 SD is that the high probability of fracture associated with other risk factors is ignored. For example, treatment should be offered to a 65-year-old woman who smokes and consumes alcohol if she has a T score of -2.5 SD but not with a T score of -2.0, ignoring the fact that in both cases the probability of fracture (3.2% with T score -2.5 and 2.3% with T score -1.5) is higher than the threshold based on BMD (2%). Likewise, a 65-year-old woman with a family history of hip fracture would only be treated if she has a T score of -2.5 SD (Frax 3.5%) but not a T score of -2.0 (FRAX 2.9%).
Finally, the intervention threshold based on BMD makes it necessary to perform densitometries to all patients, which within the country's macroeconomic condition is not routinely accessible. On the other hand, the intervention threshold based on the FRAX has the advantage of making it easy to estimate the probability of fracture within any establishment or situation, without necessarily requiring a bone densitometry test. In the present study, we apply the intervention threshold recommended by the NOGG to the Ecuadorian population based on the probability of age-specific fracture equivalent to that of a woman with a previous fragility fracture. This ranged from 0.9% at 40 years to 12% at 90 years, so women with a FRAX probability equal to or greater than these values should be eligible for treatment without densitometry. For example, a 60-year-old woman with RA who uses corticosteroids even in the absence of BMD should be considered for treatment since her FRAX probability (2%) exceeds that of a woman with a previous fracture (1.8%).
The use of evaluation thresholds proposed by the NOGG improves the risk assessment in patients near the threshold and decreases the number of densitometries required. People with a FRAX probability below the lower evaluation threshold do not require further intervention, while those above the upper evaluation threshold can be considered for treatment without densitometry. People with a FRAX probability within the limits of the evaluation thresholds should undergo densitometry and their FRAX should be recalculated using BMD.
In 2017, Clark et al. (23 published the FRAX intervention thresholds of seven Latin American countries, including Ecuador. Our results are similar to those presented in that study, which suggests that there has been no modification of the FRAX Ecuador calculator, although it is evident that the model used underestimates the probability of fracture of the Ecuadorian population. This is because the epidemiology of fractures in Ecuador has changed dramatically. The study that served as a reference for the elaboration of the FRAX Ecuador model reported a crude annual incidence of hip fracture of 49.5 per 100,000 inhabitants, 38.8 per 100,000 men and 63.2 per 100,000 women. (9 In 2018, López et al. (24 reported a Crude annual incidence of 123 cases per 100,000 inhabitants, 74.6 per 100,000 men and 165.8 per 100,000 women, figures that are significantly higher than in the previous study. Likewise, the hospital mortality rate due to hip fracture has increased from 4.4% in men and 2.9% in women9 to 5.1% in men and 3.8% in women. (24 Another study by López et al. (25 demonstrated an increase in the rate of mortality from hip fracture from 1.3 per 100,000 women and 2.19 per 100,000 men in 1997 to 6.5 per 100,000 women and 3.5 per 100,000 men in 2016. Due to these changes the revalidation of the FRAX Ecuador calculator is fundamental in order to be applicable to the current reality of the Ecuadorian population.
Conclusion
Data shows the importance of applying tools such as FRAX, specific for each country and also the creation of evaluation and intervention curves that allow discerning according to each patient the need for the use of resources such as DXA and specific treatments. Due to a possible underestimation of the FRAX calculator in the probability of fracture for the Ecuadorian population, a modification is essential.

