Services on Demand
Journal
Article
Indicators
-
 Cited by SciELO
 -
 Access statistics
Related links
-
 Cited by Google
 -
 Similars in
SciELO
 -
 Similars in Google
Share
Revista MVZ Córdoba
Print version ISSN 0122-0268On-line version ISSN 1909-0544
Rev.MVZ Cordoba vol.12 no.1 Córdoba Jan./June 2007
ORIGINALES
METHODOLOGY FOR DETERMINATION OF PLASMA CORTISOL IN FISH USING COMPETITIVE ENZYME-LINKED IMMUNOSORBENT ASSAY (ELISA)
METODOLOGÍA PARA LA DETERMINACIÓN DE CORTISOL PLASMÁTICO EN PECES USANDO LA PRUEBA DE INMUNOENSAYO ENZIMÁTICO (ELISA)
Yohana Velasco-Santamaría1*, M.Sc, Pablo Cruz-Casallas2, Ph.D
MRes student, University of Plymouth, Dake Circus Plymouth Devon, PL4 8AA, United Kingdom1. Instituto de Acuicultura, Facultad de Ciencias Agropecuarias y Recursos Naturales, Universidad de los Llanos, Villavicencio (Meta) Colombia2. Grupo de Investigación sobre Reproducción y Toxicología de Organismos Acuáticos - GRITOX. *Correspondence: E-mail:ymvelasco@yahoo.com.
ABSTRACT
Objective. To determine plasma cortisol procedure in fish using competitive enzyme-linked immunosorbent assay (ELISA). Materials and methods. Two plasma samples of juveniles rainbow trout Oncorhynchus mykiss were analized by using ELISA human kit for cortisol assay. For standard curve calibration seven standard solutions of cortisol in human plasma (0, 20, 50, 100, 200, 400 and 800 ng.ml-1) were used. For the recovery test 50, 100 and 200 ng.ml-1 standard solutions of cortisol were used; for the linearity test four dilutions of the fish plasma samples (1/2, 1/4, 1/8 and 1/16) were prepared. To each well fish plasma samples and standard solutions were added and its content were conjugated to peroxidase and subsequently enzyme substrate was added. The enzymatic reaction was stopped by addition of phosphoric acid 0.5 M and the absorbance was read at 450 nm. The accuracy of the pipetting procedure was assessed previously. The recovery and linearity percentages, the standard curve and parallelism were determined. Results. The standard curve showed a high correlation coefficient (r2 = 0.998). The cortisol concentration of two samples fluctuated between 64 and 72 ng.ml-1. Only the 200 ng.ml-1 standard solution showed a recovery percentage superior to 80%; in contrast, in 50 and 100 ng.ml-1 the recovery percentage fluctuated between 52 and 71%. In the dilution of 1/2 to 1/8 were observed a good linearity (86 to 168%); the samples showed parallelism with the standard curve. Conclusions. The use of human plasma cortisol for ELISA procedure is an accuracy and efficiency test for fish cortisol plasma determination.
Key words: Cortisol, ELISA, fish, Oncorhynchus mykiss, rainbow trout, plasma.
RESUMEN
Objetivo. Describir el procedimiento para determinar cortisol plasmático en peces, utilizando la prueba de inmunoensayo enzimático (ELISA). Materiales y métodos. Dos muestras de plasma de trucha arco iris Oncorhynchus mykiss fueron analizadas empleando un kit de ELISA desarrollado para humanos. Siete soluciones estándar conteniendo 0, 20, 50, 100, 200, 400 y 800 ng.ml-1 de cortisol fueron usadas para construir una curva de calibración. Para la prueba de recuperación se emplearon las soluciones estándar de 50, 100 y 200 ng.ml-1; finalmente, para la prueba de linealidad se prepararon cuatro diluciones de las muestras de plasma, así: 1/2, 1/4, 1/8 y 1/16. A cada pozo de la placa se adicionaron tanto las muestras de plasma como las soluciones estándar, las cuales fueron conjugadas con peroxidasa y posteriormente se adicionó el substrato de la enzima. Esta reacción enzimática se detuvo por medio de la adición de ácido fosfórico (0.5 M) y posteriormente, la absorbancia fue medida a 450 nm. La precisión del procedimiento de pipetaje fue evaluado previo a la prueba. El porcentaje de recuperación y de linealidad, así como la curva de calibración y de paralelismo fueron determinadas. Resultados. La curva estándar mostró un alto coeficiente de correlación (r2 = 0.998). La concentración de cortisol en las dos muestras de plasma fluctuó entre 64 y 72 ng.ml-1. Sólo la solución estándar de 200 ng.ml-1 mostró un porcentaje de recuperación superior al 80%; en contraste, en las soluciones estándar de 50 y 100 ng.ml-1 el porcentaje de recuperación fluctuó entre 52 y 71%. En las diluciones de 1/2 y 1/8 se observó un buen porcentaje de linealidad (86 a 168%). Finalmente, las muestras mostraron cierto grado de paralelismo con la curva estándar. Conclusiones. El uso de la prueba de ELISA para determinar cortisol plasmático en humanos, es confiable y eficiente para la cuantificación de cortisol plasmático en peces.
Palabras clave: Cortisol, ELISA, Oncorhynchus mykiss, peces, trucha arco iris, plasma.
INTRODUCTION
There are three different stress responses in teleosts including primary, secondary and tertiary response, each of one with several physiological mechanisms (1). In the primary responses, cortisol is the principal corticosteroid identified in teleosts (2), being the most sensitive steroid hormone marker (1) produced in the interrenal cells by the ACTH stimulation and released in response to a variety of stressors (3, 4). The main responses influenced by stress include effects on ionic and osmotic regulation with changes in the plasma ionic concentration, branchial ionic fluxes, plasma osmotic pressure, volume and composition of the urine and salt absorption (5); protein and carbohydrate metabolism, stimulating gluconeogenesis from amino acids and glycogen in the liver and thus increasing blood glucose (1, 6); blood cell movement from haematopoietic and lymphoid tissues (7); immune system with disturbance in tissue repair, anti-inflammatory reactions, phagocytosis and lympoid system (7,8) and effects on growth (7).
Cortisol has been measured using enzyme-linked immunosorbent assay (ELISA), one of the most suitable immunoassay techniques owing to high sensitivity and specificity (1). In addition, this technique does not require expensive instrumentation or advanced technical expertise (9,10); perhaps, the most significant advantage on others immunoassays such as radioimmunoassay (RIA) is that ELISA does not need radioisotopes (10). In fish the use of direct ELISA is the most common (11, 12); however, Tintos et al (1) validated the use of indirect ELISA assay to determine plasma cortisol in fish. Therefore, the aim of the present study was describe the methodology of the competitive ELISA to measure plasma cortisol in juvenile rainbow trout Oncorhynchus mykiss (Walbaum).
MATERIALS AND METHODS
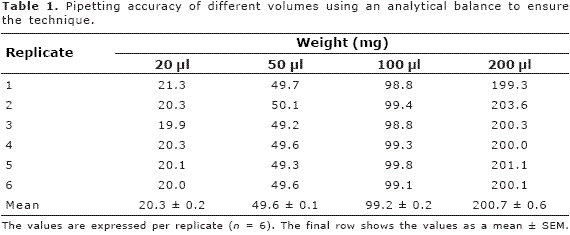
Pipetting calibration. Pipetting volume of 20, 50, 100 and 200 µl were weighed in analytical balance in order to guaranty the accuracy of the pipetting procedure during the ELISA assay. Each volume taken was weighed in a plastic container with a previous zeroing of the balance. Table 1 shows the weight of each pipetting volume.
ELISA assay for cortisol. Two juveniles of rainbow trout Oncorhynchus mykiss with c.a. 15 - 20 cm of fork length and 90 - 150 g of body weight were anaesthetized by immersion in MS-222 solution (0.1%, Sigma Co., St Louis, Missouri). Blood samples were taken from the caudal peduncle using heparinized syringes to obtain plasma after centrifugation at 10,000 x g for 5 min, maintained on ice until determination of cortisol concentrations.
Ninety-six well plates for cortisol ELISA (DRG Diagnostics, Frauenbergstrasse, Germany) were used. For this assay only 38 wells were used and the fish plasma samples were analysed in duplicate.
Recovery test. Three Eppendorf tubes of 1.5 mL were prepared with standard solution of 50, 100 or 200 ng.ml-1 and fish plasma samples. Standard solutions and fish plasma samples were mixed 1:1 (v:v) and to each tube previously labelled were added 30 µl of fish plasma sample and 30 µl of the respective standard solution. The tubes were maintained at room temperature (c.a. 20ºC).
Linearity test. Four Eppendorf tubes (1/2, 1/4, 1/8, 1/16) indicating the dilution of the fish plasma sample were labelled; in this case standard solutions and fish plasma samples were mixed 1:1 (v:v). For the first dilution (1/2) 30 µl of fish plasma sample and 30 µl of standard 0 ng.ml-1 were mixed. Consequently, 30 µl of the 1/2 dilution and 30 µl of 0 ng ml-1 standard solution was taken and mix in the second tube to prepare the dilution of 1/4. This procedure was repeated for the two remainder dilution. The samples were maintained at room temperature.
Assay protocol. For the assay, 20 µl of each of cortisol human plasma standard solution (0, 20, 50, 100, 200, 400 and 800 ng.ml-1) and fish plasma sample were added in duplicate to the plate. In the same way, the samples for the recovery and linearity test were dispensed in others wells. Standard solutions and fish plasma samples for recovery test were assayed in duplicate.
Subsequently, 200 µl of enzyme conjugated to horseradish peroxidase (DRG Diagnostics, Frauenbergstrasse, Germany) was added into each well. Finally, the wells were gently mixed on a plate mixer at a 200 beats.min-1 for 10 min and incubated for 1 h at room temperature.
The well contents were briskly eliminated to avoid any residual content. The solution of each well was removed by washing the plate three times with 400 µl of PBS and shaking out the content onto absorbent paper with the aim of removing residual drops that could affect the accuracy and precision of the assay. Subsequently, 100 µl of TMB (tetramethylbenzidine) enzyme substrate (DRG Diagnostics, Frauenbergstrasse, Germany) was added to each well and incubated for 15 min at room temperature. The enzymatic reaction was visualized by the colour change and was stopped by addition of 100 µl of 0.5 M phosphoric acid (H2PO3). The intensity of colour is inversely proportional to the concentration of cortisol in the samples. Absorbance was read in a spectrophotometer at 450 nm on a microtiterplate reader within 10 min after addition of stop solution.
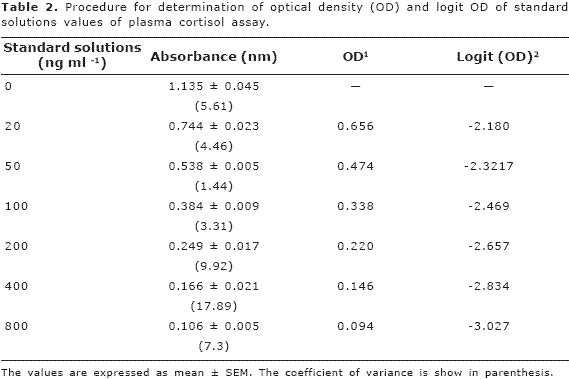
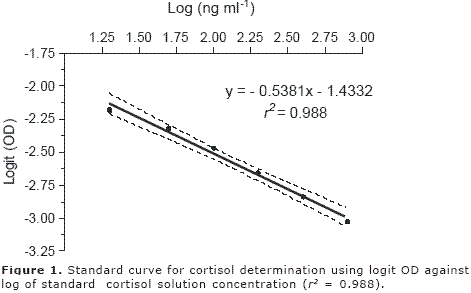
Curves. A standard curve was plotted with the aim of calculating the concentration of cortisol of each plasma sample. The curve was plotted with log concentration of each standard solution against logit optical density. For this, the mean of the absorbance values of 20, 50, 100, 200, 400 and 800 ng.ml-1 standard solutions was used. The optical density (OD) was calculated as absorbance of the each standard solution over the absorbance of the zero standard solution. Once OD was determined, the logit OD was calculated using the follow equation: Logit OD: log (OD/(100-OD)).
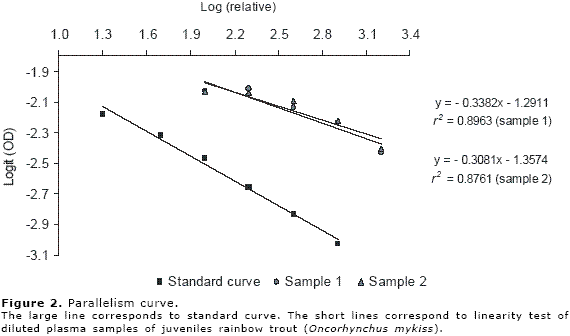
Finally, with the aim to verify the parallelism between standard curve and fish diluted plasma samples, the logarithm relative (log relative) of the fish diluted plasma samples against logit OD of these diluted samples were plotted in the same graph with the standard curve.
All values are expressed as mean ± SEM. For all statistical analysis, GraphPad InStat Software version 3.06 (1992-2003) and GraphPad Prism Software version 4.03 (1992-2005) were used.
RESULTS
The accuracy of the pipetting procedure was observed in the four pipetting volumes evaluated (Table 1). Table 2 summarises the results of optical density (OD) and logit OD of the standard solutions. Most of the values of absorbance for standard solutions showed a coefficient of variance (CV) less than 10%; however, the 400 ng.ml-1 standard solution showed a high CV (18%).
The standard curve showed a high correlation coefficient between logit OD and log of standard solution concentration (Figure 1). According to the equation obtained with the standard curve (Y = -0.5381x-1.4332), the equation for cortisol determination was calculated as follows:
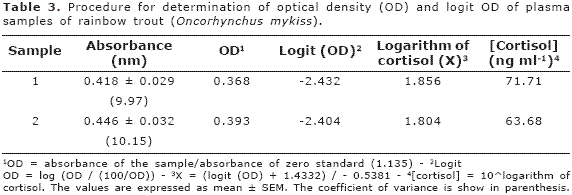
X = (logit OD + 1.4332) / - 0.5381
Where X corresponds to the cortisol concentration expressed as a logarithm; then, the antilogarithm of X value was calculated to obtain the final concentration of cortisol. The procedure for calculation of the cortisol concentration is summarises as follows: the absorbance obtained for each sample was used to obtain the OD; both OD and logit OD were calculated as described above. In the two plasma fish samples a low CV was observed. The cortisol concentration of two fish samples fluctuated between 64 and 72 ng.ml-1 (Table 3).
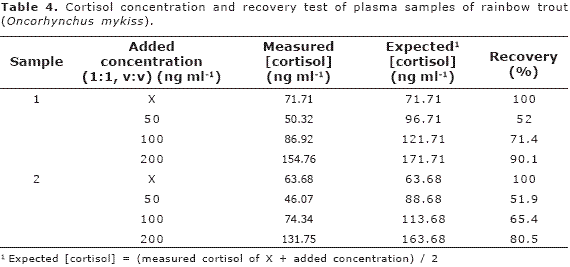
The final concentration of cortisol and recovery percentage is shows in the Table 4. Only the 200 ng.ml-1 standard solution showed a recovery percentage superior to 80%; in the remainder concentrations (50 and 100 ng.ml-1) the recovery percentage fluctuated between 52 and 71%. On the other hand, in the dilution of fish plasma sample 1/2, 1/4 and 1/8 were observed a good percentage of linearity (86 to 168%); however, the dilution of 1/16 showed the greatest value (superior to 280%, Table 5). Finally, the fish plasma samples showed a good parallelism with the standard curve (Figure 2).
DISCUSSION
The basal cortisol plasma levels in rainbow trout fluctuate between 2 to 25 ng.ml-1 (1,10). Due to cortisol being the most readily stress hormone to assess the activity of hypothalamic-pituitary-interrenal axis - HPI - (4), the increase of plasma levels has been frequently associated to short-term stressors (13).
Several factors affect the plasma cortisol levels in fish including size and age of fish, time of day, rearing temperature (10, 14, 15), reproductive stage (16), acclimation conditions, handling (11, 13), tank confinement (10, 13), use of anaesthetics (17), changes of osmotic condition (12), air exposition (11, 13) and fish strains (16). Variation of response to stressful condition among species has been reported, being salmonids one of the species that respond almost immediately to handling and crowing stress (11, 16). In the present study, the higher values of plasma cortisol (three-fold) observed could be associated with these later conditions, especially with the handling stress.
The coefficient of variance, smaller than 10%, could reflected a good level of reproducibility; however, the low number of individual sampled did not offered a high level of accuracy, being necessary a major number of repetitions.
The low percentage of recovery can not be attributed to inaccuracy of pipetting itself owing to the fact that the volume was verified correctly on the analytical balance; however, it is probably that during the pipetting method some errors have occurred. Although the procedure was done at room temperature, is probable that the bound enzyme could be affected by temperature variations and edge effects. On the other hand, due to washing procedure affecting greatly the sensitivity and precision of the assay, is probable that the contents had not been removed correctly and this affected the recovery percentage.
The good percentage of linearity reflects a high sensitivity and affinity of this ELISA human kit to determine plasma cortisol in fish; this result was confirmed by the good parallelism observed between standard curve and fish samples dilution curve proving the validity of this assay.
In conclusion, the use of human plasma cortisol for ELISA procedure is useful for fish cortisol plasma determination and could be used as a tool to assess the stress effects in fish; however, the methodology requires high accuracy and rigour to avoid errors in the results and interpretation.
Acknowledgements
This study is part of Y. Velasco Master Research project and was supported by the Programme Alâan, the European Union Programme of High Level Scholarships for Latin America, scholarship No. E06M103042CO. The authors wish to thank Dr. Katherine Sloman for her orientation and logistical support during the assay procedure.
REFERENCIAS
1. Tintos A, Miguez J, Mancera J, Soengas J. Development of a microtitre plate indirect ELISA for measuring cortisol in teleosts, and evaluation of stress responses in rainbow trout and gilthead sea bream. J Fish Biol 2006; 68(1): 251-263. [ Links ]
2. Tripathi G, Verma P. Pathway-specific response to cortisol in the metabolism of catfish. Comp Biochem Physiol B 2003; 136(3): 463-471. [ Links ]
3. Leung W, Chan P, Bosgoed F, Lehmann K, Renneberg I, Lehmann M et al. One-step quantitative cortisol dipstick with proportional reading. J Immunol Methods 2003; 281(1-2): 109-118. [ Links ]
4. Donaldson E. The pituitary-interrenal axis and indicator of stress in fish. In: Pickering AD (Ed.), Stress and Fish Bristol Academic Press Inc 1981, pp.367 [ Links ]
5. Eddy F. Effects of stress on osmotic and ionic regulation in fish. In: Pickering AD (Ed.), Stress and Fish, Bristol, Academic Press Inc 1981, pp.367. [ Links ]
6. Nelson D, Cox M. Lehninger Principles of Biochemistry, W.H. Freeman & Co 2005, pp.1119. [ Links ]
7. Chester J, Chan D, Henderson I, Ball J. The adrenocortical steroids, adrenocorticotropin and the corpuscles of Stannius. In: Hoar WS and Randall DJ (Eds.), Fish Physiology: The Endocrine System, London, Academic Press Inc 1969, pp.446. [ Links ]
8. Ellis A. Stress and the modulation of defence mechanims in fish. In: Pickering AD (Ed.), Stress and Fish, Bristol, Academic Press Inc 1981, pp.367. [ Links ]
9. Jensen K, Ankley G. Evaluation of a commercial kit for measuring vitellogenin in the fathead minnow (Pimephales promelas). Ecotoxicol Environ Saf 2006; 64(2): 101-105. [ Links ]
10. Barry T, Lapp A, Kayes T, Malison J. Validation of a microtitre plate ELISA for measuring cortisol in fish and comparison of stress responses of rainbow trout (Oncorhynchus mykiss) and lake trout (Salvelinus namaycush). Aquaculture 1993; 117(3-4): 351-363. [ Links ]
11. Carey J, McCormick S. Atlantic salmon smolts are more responsive to an acute handling and confinement stress than parr. Aquaculture 1998; 168(1-4): 237-253. [ Links ]
12. Kelly S, Woo N. The response of sea bream following abrupt hyposmotic exposure. J Fish Biol 1999; 55(4): 732-750. [ Links ]
13. Bayunova L, Barannikova I, Semenkova T. Sturgeon stress reactions in aquaculture. J Appl Ichthyol 2002; 18(4-6): 397-404. [ Links ]
14. Cataldi E, Di Marco P, Mandich A, Cataudella S. Serum parameters of Adriatic sturgeon Acipenser naccarii (Pisces: Acipenseriformes): effects of temperature and stress. Comp Biochem Physiol A 1998; 121(4): 351-354. [ Links ]
15. Lankford S, Adams TE, Cech J. Time of day and water temperature modify the physiological stress response in green sturgeon, Acipenser medirostris. Comp Biochem Physiol 2003; 135(2): 291-302. [ Links ]
16. Schreck C, Contreras-Sanchez W, Fitzpatrick M. Effects of stress on fish reproduction, gamete quality, and progeny. Aquaculture 2001; 197(1-4): 3-24. [ Links ]
17. Ortuño J, Esteban M, Meseguer J. Effects of four anaesthetics on the innate immune response of gilthead seabream (Sparus aurata L.). Fish Shellfish Immunol 2002; 12(1): 49-59. [ Links ]


