


Services on Demand
Journal
Article
 English (pdf)
 Article in xml format
 Article references
 Send this article by e-mail
Indicators
-
 Cited by SciELO
 -
 Access statistics
Related links
-
 Cited by Google
 -
 Similars in
SciELO
Similars in
SciELO -
 Similars in Google
Share

 Permalink
Revista MVZ Córdoba
Print version ISSN 0122-0268On-line version ISSN 1909-0544
Rev.MVZ Cordoba vol.16 no.2 Córdoba May/Aug. 2011
ORIGINAL
Genetic diversity of six populations of red hybrid tilapia, using microsatellites genetic markers
Diversidad genética en seis poblaciones de tilapia roja, usando microsatelites como marcadores genéticos
Boris Briñez R,1,2 * M.Sc, Xenia Caraballo O,1 M.Sc, Marcela Salazar V,1 MD.
1Centro de Investigaciones para la Acuacultura de Colombia (Ceniacua), Cra 9 C No. 114-60, Bogotá, Colombia.
2State University of Campinas - UNICAMP, Department of Genetics, Evolution and Bioagents. Institute of Biology, Brazil.
*Correspondencia: borisbrinez@hotmail.com
Recibido: Septiembre de 2009; Aceptado: Julio de 2010.
Abstract
Objective. To determine and evaluate the genetic diversity of six populations of red hybrid tilapia, with the purpose to assess the potential benefit of a future breeding program conducted at the Research Center for Aquaculture (Ceniacua), Colombia. Material and methods. A total of 300 individuals, representing a wide genetic variability, were genotyped using a fluorescent microsatellite marker set of 5 gene-based SSRs in 6 different farms belonging to 4 States of Colombia. Results. The result showed that the mean number of alleles per locus per population was 8.367. The population 5 had the highest mean number of alleles with 9.6 alleles, followed by population 4 with 9.4 alleles, population 2 with 9.2, population 3 with 8.0, population 1 with 7.2 and population 6 with 6.8 alleles. The analysis of the distribution of genetic variation was (17.32%) among population, while among individuals within populations was (28.55%) and within individuals was high (54.12%). The standard diversity indices showed that population 4 was the more variable (mean He=0.837) followed by population 1 (mean He=0.728), population 3 (mean He=0.721), population 5 (mean He=0.705), population 2 (mean He=0.690), population 6 (mean He=0.586). Highly significant deviations from Hardy-Weinberg, exhibited all of the populations, mostly due to deficits of heterozygotes. Genotype frequencies at loci UNH 106 of population 5 and loci UNH 172 of population 6 were Hardy-Weinberg equilibrium (HWE). Conclusions. The results of this study, contribute to the genetic breeding program of Tilapia, conduced by the Research Center for Aquaculture. The Fst distance showed that the samples are differentiated genetically and it is possible to use at the beginning of the genetic program. However, it is recommended to introduce others individuals to the crossbreeding program.
Key words: Breeding programmes, fishes, genetic diversity. (Sources: AIMS, CAB).
Resumen
Objetivo. Determinar y evaluar la diversidad genética de seis poblaciones de tilapia roja híbrida, con el propósito de evaluar el potencial beneficio de un futuro programa de mejoramiento adelantado en el Centro de Investigación para la Acuicultura (CENIACUA), Colombia. Materiales y métodos. Fueron genotipados un total de 300 individuos utilizando un grupo de 5 microsatélites fluorescentes. Las muestras se tomaron en 6 fincas diferentes en 4 departamentos de Colombia, representando una amplia variabilidad genética. Resultados. El número medio de alelos por locus por población fue de 8.367. La población 5 tuvo el número más alto de alelos por locus: 9.6, seguida de la población 4 con 9.4, población 2 con 9.2, población 3 con 8.0, población 1 con 7.2 y población 6 con 6,8 alelos. Los análisis de distribución de la variación genética fueron de (17.32%) entre las poblaciones mientras que dentro de las poblaciones fue de (28.55%), y entre los individuos fue de (54.12%). Los índices de diversidad estándar mostraron que la población 4 fue la más variable (media He=0.837) seguida de la población 1 (media He=0.728), población 3 (media He=0.721), población 5 (media He=0.705), población 2 (media He=0.690) y población 6 (media He=0.586). Todas las poblaciones mostraron desviaciones significativas de equilibrio de Hardy-Weinberg, debido principalmente a la falta de heterocigotos. Las frecuencias genotípicas de los locis UNH 106 de la población 5 y loci UNH 172 de la población 6 estuvieron en equilibrio de Hardy-Weinberg. Conclusiones. La distancia Fst evidenció que las muestras estan diferenciadas geneticamente y es posible usar esas poblaciones para el programa de mejorameinto genético, sin embargo, es recomendable introducir otros individuos.
Palabras clave: Diversidad genética, peces, programas de mejoramiento (Fuentes: AIMS, CAB).
Introduction
Cichlids are an emerging model system for studying a broad range of questions at the interface of organismal biology and genomics (1). Tilapias (Oreochromis spp.) are cichlid fishes, which have become one of the most important species in global aquaculture. Native to Africa, several species of tilapia have been introduced to tropical areas of Asia and the Americas to increase supplies of animal protein.
World aquaculture production of tilapia is second only to carp, and now exceeds 1.5 million tons per year (2). Long time ago a tilapia was considered a fish of low value but in the last years, it reaches up the acceptation among consumers and now is one of the most species-rich families.
Aquaculture practices may inadvertently decrease the genetic variability present in farmed stocks by breeding among related individuals or by the use of small numbers of founding broodstock. Selective breeding programs can also lead to decreased diversity when they utilize only a small number of "superior" families that may be related or use a mass selection approach with high selection intensities (3). Unless pedigree records are maintained, there is often a probability of selecting related individuals as parents for constructing the next generation and thereby increasing inbreeding (4). Conversely, breeding programs may deliberately introduce divergent stocks and utilize crossbreeding programs to increase diversity and productivity (5). However, the extent of stock mixing, the relative survival of the different stocks and the extent to which they are disseminated are important issues that frequently need to be addressed for effective management of aquaculture species (6). There is also often a need to evaluate the status of wild stocks in aquaculture species as escapes of aquaculture stocks are common and these fish can have negative effects on resident indigenous forms (7).
Molecular markers have been used to assist breeding programs in many ways. These studies, based on the structure of genetic diversity are important and efficient to discovery of genes involved in phenotypes of interest. Microsatellites, or simple sequence repeats (SSRs), represent a unique type of tandemly repeated genomic sequences, which are abundantly distributed across genomes and demonstrate high levels of allele polymorphism. They are codominant markers of relatively small size, which can be easily amplified with the polymerase chain reaction. These features provide the foundation for their successful application in a wide range of fundamental and applied fields of biology and medicine, including forensics, molecular epidemiology, parasitology, population and conservation genetics, genetic mapping and genetic dissection of complex traits. In the field of fisheries and aquaculture, microsatellites are useful for the characterization of genetic stocks, broodstock selection, constructing dense linkage maps, mapping economically important quantitative traits and identifying genes responsible for these traits and application in marker assisted breeding programmes (8).
In Colombia, given the great potential of Tilapia in terms of global demand and commercial market and the fact that shrimp farming has been affected by lethal diseases, the Research Center for Aquaculture of Colombia (CENIACUA) has implemented the use of intensive shrimp farming systems for growing Tilapia (9). The Center has demonstrated the usefulness of the technology and the necessity of studies in genetic diversity that assist the efficiency of the breeding programs.
The objective of this study was to determine and evaluate the genetic diversity of six populations of red hybrid tilapia (Oreochromismossambicus X O. niloticus), that were differentiated genetically in the process of adaptation to different farm environments. This study was conducted the Research Center for Aquaculture (Ceniacua), Colombia, using Five microsatellite and 50 samples per strain. with the purpose to assess the potential benefit of a future breeding program using these populations.
Materials and methods
Sample collection and storage. A total of 300 samples were collected in six different locations of four States in Colombia (Huila, Risaralda, Valle del Cauca and Meta). An aliquot of tissue was placed into an eppendorf pipette with 99% ethanol and then carried to the molecular biology laboratory for DNA extraction and microsatellites analyses.
DNA extraction. An amount of 30 mg of tissue was cut from each sample and DNA was extracted using a modified protocol of Chomczynski and Sacchi (10). In brief, preserved tissue was wash in TE 1X buffer (10 mMTris pH 8.0, 10 mM EDTA) 5 minutes at 14.000 rpm. Then the samples were cut and incubated with 500 µl of guanidine isothiocyanate for 30 minutes at 60°C. Subsequently, a volume of isopropanol was added and centrifugated for 15 minutes at 14.000 rpm. To wash the DNA, a volume of ethanol 70% to the upper layer was added and the sample was centrifugated for 5 minutes at 13.000 rpm. The DNA pellet was then air-dried, resuspended in 100 µl of TE and stored at -20°C until used.
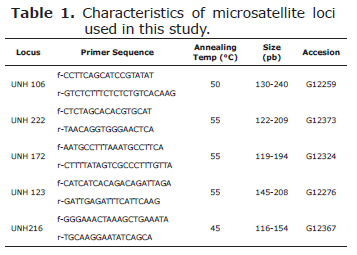
Microsatellites selection. Five microsatellites were selected (UNH 106, UNH 222, UNH 172, UNH123, and UNH216) (Table 1), based on the level of heretozygosity and the good amplification obtained.
Polymerase chain reaction and electrophoresis. The polymerase chain reaction (PCR) was performed in a 20 µl reaction volume with a final concentration of 200 µM each dNTPs, 2.5 mM MgCl2, 0.5 µM of each primer loaded with Cy5, about 10-100 ng of template DNA, 1 X Taq buffer and 1.25 units of Taq polymerase. PCR cycling conditions were as follows: 4 min at 94°C, 35 cycles of 20 s at annealing temperature (45-55°C) (Table 1), and 20 s at 72°C, followed by a final elongation step of 4 min at 72°C. PCR products were separated on a 6% denaturing polyacrylamide gel using an ALFwin sequence analyzer 2000 (Amersham Biosciences) following manufacturer's instructions and the bands were analyzed using the software AlleleLocator 1.03 (Amersham Pharmacia Biotech AB).
Genetic diversity analysis. Changes in genetic variation of the populations were evaluated by estimating, expected heterozygosity (He) number of alleles, conformation of Hardy Weingberg, linkage disequilibrium Fst, the F statistics for the hierarchy of individuals within the species (Fit) and populations (Fis) were estimated using the program POPGENE Version 1.32 (11).
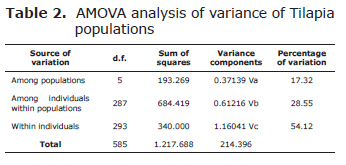
Analysis of molecular variance (AMOVA) was used to partition the total genetic variance into components due to differences between populations, among individuals within populations, and among individuals within each stock. That was calculated using the software Arlequin 3.1 (12).
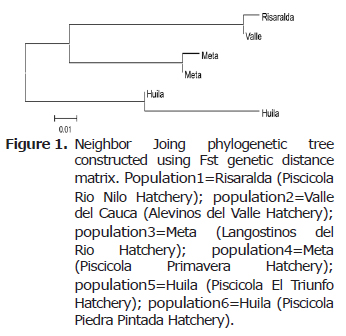
Neighbor joing phylogenetic tree were constructed based on Fst and corrected average pairwise difference distance matrices using the program Mega 4.0 (13) (Figure 1).
The distributions of the samples were observed plotting the likelihood of individual genotypes in all populations (Figure 2) using the software Statistic 7.1 (14).
Results
All five microsatellite loci were polymorphic, with UNH123 as the most variable locus with 16 alleles, and the less variable UNH 106 and UNH 172 with 4 alleles respectively.
Allele sizes ranged from 130 to 240 bp for UNH106, 122 to 209 bp for UNH222, 119-194 bp for UNH 172, 145 to 208 bp for UNH 123 and 116 to 154 bp for UNH 216 (Table 1). The mean number of alleles per locus per population was 8.367.
The population 5 had the highest mean number of alleles with 9.6 alleles, followed by population 4 with 9.4 alleles, population 2 with 9.2, population 3 with 8.0, population 1 with 7.2 and population 6 with 6.8 alleles.
The analysis of the distribution of genetic variation indicated among population variation was very low (17.32%), while among individuals within populations was (28.55%) and within individuals was high (54.12%) (Table 2).
The standard diversity indices showed that population 4 was the most variable (mean He=0.837) followed by population 1 (mean He=0.728), population 3 (He=0.721), population 5 (mean He=0.705), population 2 (mean He=0.690), population 6 (mean He=0.586).
Highly significant deviations from Hardy-Weinberg, exhibited all of the populations, mostly due to deficits of heterozygotes. Genotype frequencies at loci UNH 106 of population 5 and loci UNH 172 of population 6 were Hardy-Weinberg equilibrium (HWE).
The molecular diversity indices showed that population 4 had the highest average gene diversity over loci (0.837 +- 0.464), followed by population 1 (0.723 +- 0.409), population 3 (0.721 +- 0.408), population 5 (0.694 +- 0.395), population 2 (0.673 +- 0.385), population 6 (0.586 +- 0.343).
The population 4 had the highest correlation of the alleles on the gametes (Theta) (5.164) followed by population 1 (2.678), population 3 (2.593), population 5 (2.394), population 2 (2.229), population 6 (1.415).
The Wright's F statistics showed the highest fixation indices Fit and Fis, which illustrated their deficits of heterozygotes (Fis=0.34535 and Fit=0.45875).
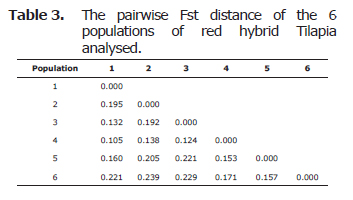
Genetic differentiation between populations was analyzed using FST pairwise differences. All estimates of pair wise FST were significant (p<0.05). The largest genetic differentiation between populations, using FST pairwise differences, was between the cultured populations 2 (Alevinosdel Valle Hatchery in the Valle del Cauca) and population 6 (PiscicolaPiedraPintada Hatchery lacated at the Huila state) (Table 3).
The neighbor joing phylogenetic trees were constructed using Fst genetic distance matrix. The Risaralda and Valle samples formed one group, the populations of Meta formed other group, while the populations from huila were clustered into another one (Figure 1).
The dispersion graph showed that the samples from population 2 from Valle del Cauca State, Alevinos del Valle Hatchery are concentrated in one group and the others samples form another group (Figure 2).
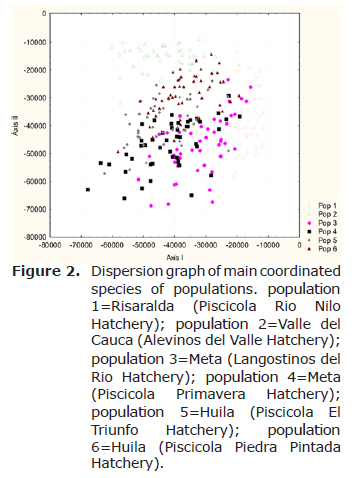
This could be explained by the geographic localization and the fact that the other samples have more genetic diversity and possibly more selection pressure.
Discussion
Microsatellites are highly variable nuclear genetic markers, which are inherited co-dominantly in a Mendelian fashion (15).
Microsatellites have been found suitable for a variety of applications in fisheries and aquaculture research, particularly where genetic differentiation within and between populations may be limited. Potential applications in aquaculture include monitoring changes in genetic variation as a consequence of different breeding strategies, the investigation of interactions between wild and cultured populations, parentage assignment and estimation of relatedness between potential breeding pairs (4,7,15-17).
Genetic diversity is important to cultured populations because it provides the necessary spectrum of genotypes for adaptive response to changing conditions and heterozygous individuals usually are superior to less heterozygous individuals in many economically important characteristics like growth, fertility and disease resistance (18).
The original red tilapias were bred in separate instances in Taiwan, Israel, and Florida by crossing mutant-colored O. mossambicus with either the Nile (O. niloticus), blue (O.aureus) or Zanzibar tilapia (O. urolepis-hornorum) (19).
Like the Nile tilapia, the red tilapia hybrids have been propagated in Asia, and are now widely cultured in Central and South America.
The red tilapia hybrids are colored either gray, albino, pink, red-orange and dark-blotched. In most cases, the characteristics of red tilapias were morphometrically intermediate (in terms of snout shape, mouth width, head length to standard length ratio, mouth width to head width ratio, and peduncle length to peduncle depth ratio) between the species used in the hybrid crosses (20).
The red-orange hue of the red tilapia comes from the O. mossambicus parent, where the red coloration is inherited as a simple Mendelian recessive (21).
Hence, because of (a) the use of relatively few and possibly bottlenecked mutant-colored female founder stocks in the original hybrid crosses, and; (b) the propagation of stocks through several generations using the red-orange hybrid progenies as parents for subsequent crosses, genetic variability of the red tilapia hybrids is not as high as expected and the stocks have become less divergent (22).
The results obtained in this study, for mean expected heterozygosities ranging from 0.587 to 0.837 agreed with those obtained for Rowena et al (22) who found values ranging from 0.567 to 0.715.
That indicated that variability of the red tilapia is low. Rowena et al (22) showed the same results for mtDNA-RFLP analysis where the five red tilapia stocks were also noted to be less variable. These results may be counterintuitive in that interspecific hybrids such as the red tilapias might be presumed to be more variable and divergent from each other than the Nile tilapias, having been produced by crossing entirely different species.
The values of Ho showed significant differences with He. That frequently happens in cultured populations (22, 23).
The Fis and Fit values represent a measured of genetic frequencies in relation to panmitic frequencies expressed in excess or deficiency of heterozygotes and can be interpreted as endogamy coefficient (f). The results show inbreeding in all the population due to an excess of homozygosis.
Looses in genetic variability is hope because of the characteristics of reproduction, the origin of strains and the genetic improvement management.
Melo et al (24) worked with commercial hatcheries and found 39 alleles in 5 loci. Rutten et al (23) studied 4 strains of Nile Tilapia and obtained a range of 5 to 7,5 alleles by locus. Rowena et al (22) found a variation of 4.8 to 10 alleles by locus. In this study, was obtained a mean of 6.33 to 11.66 alleles by locus.
The AMOVA represent high percentage of molecular variation due to with individuals (54.12%) and less percentage between populations (17.32%). Melo et al (23) found low variability with individuals. It could be associated with imbalance proportion of males and females used to reproduction. Rowena et al (22) found low genetic differentiation among populations of Nile tilapia.
The results of this work demonstrated that the microsatellites technique is a powerful tool to evaluated commercial fish populations. These data will allow to take decisions on facts about the reproductive management and the intensity of the selection, with the purpose to maintain low level of inbreeding.
References
1. Kocher TD. Adaptive evolution and explosive speciation: the cichlid fish model. Nat Rev Genet 2004; 5:288-298. [ Links ]
2. Food and Agriculture Organization, The State of World Fisheries and Aquaculture 2004. (fecha de acceso Julio 21 de 2009). URL disponible en: http://www.fao.org/sof/sofia/index_en.htm. [ Links ]
3. Thai BT, Burridge CP, Austin CM. Genetic diversity of common carp (Cyprinus carpio L.) in Vietnam using four microsatellite loci. Aquaculture 2007; 269:174-186. [ Links ]
4. Hutchings JA and Frase DJ. The nature of fisheries and farming induced evolution. Mol Ecol 2007; 17:294-313. [ Links ]
5. Yue GH, Ho MY, Orban L, Komen J. Microsatellites within genes and ESTs of common carp and their applicability in silver crucian carp. Aquaculture 2004; 234:85-98. [ Links ]
6. Dunham AR. Aquaculture and Fisheries Biotechnology Genetic Approaches, Cambridge: CABI Publishing; 2004. [ Links ]
7. Cross TF. Genetic implications of translocation and stocking of fish species, with particular reference to Western Australia. Aquac Res 2000; 31:83-94. [ Links ]
8. Chistiakov DA, Hellemans B, Volckaert FAM. Microsatellites and their genomic distribution, evolution, function and applications: A review with special reference to fish genetics. Aquaculture 2006; 255:1-29. [ Links ]
9. Sierra JF, Mendoza RM, Martínez PX. Evaluación del Cultivo de Tilapia del Nilo (Oreochromis niloticus) y Tilapia Roja (Oreochromis Sp.) en Diferentes Sistemas Intensivos de Granjas Camaroneras Como Alternativa Productiva del Sector Camaronicultor Colombiano. 2009. (fecha de acceso Octubre 7 de 2010). URL disponible en: http://www.ceniacua.org/html/prg_pub.html. [ Links ]
10. Chomczynski, P. and Sacchi, N. The Single-step method of RNA isolation by acid guanidinium thiocyanate-phenol-chloroform extraction: twenty-something years on. Nat Protoc 2006; 1:581-585. [ Links ]
11. Yeh FC, Boyle TYZ, Xiyan JM. POPGENE, version 1.32: Microsoft Window-based freeware for population genetic analysis. University of Alberta and Center for International Forestry Research, 2001. [ Links ]
12. Schneider S, Roessli D and Excoffier L. Arlequin ver. 3.1: A software for population genetic data analysis. University of Geneva, 2006. [ Links ]
13. Tamura K, Dudley J, Nei M, Kumar S. MEGA4: Molecular Evolutionary Genetics Analysis (MEGA) software version 4.0. Mol Biol Evol 2007; 24: 1596-1599. [ Links ]
14. Hill T and Lewicki P. Statistics methods and applications. StatSoft. 2007. [ Links ]
15. Liu ZJ and Cordes FJ. DNA marker technologies and their applications in aquaculture genetics. Aquaculture 2004; 238:1-37. [ Links ]
16. Cross TF, Coughlan J, Burnell G, Cross MC, Dillane E, Stefansson MO, Wilkins NP. Utility of microsatellite loci for detecting reduction of variation in reared aquaculture strains compared with wild progenitors and also as genetic "tags" in breeding programmes: evidence from abalone, halibut and salmon. Aquaculture 2005; 247:9-10. [ Links ]
17. Davis GP and Hetzel DJS. Integrating molecular genetic technology with traditional approaches for genetic improvement in aquaculture species. Aquac Res 2000; 31:3-10. [ Links ]
18. Beardmore AL, Mair CG, Lewis CG. Biodiversity in aquatic systems in relation to aquaculture. Aquac Res 2008; 28: 829-839. [ Links ]
19. Lovshin LL. Criteria for selecting Nile tilapia and red tilapia for culture. In: K Fitzsimmons. (ed.). Tilapia Aquaculture in the 21st Century. Rio de Janeiro, Brazil: American Tilapia Association and Departamento de Pesca e Aqüicultura; 2000. [ Links ]
20. Moreira AA, Hilsdorf AWS, Da Silva JV, De Souza VR. Genetic variability of two Nile tilapia strains by microsatellites markers. Pesq Agropec Bras 2007; 42:521-526. [ Links ]
21. Lugo MG, Alvarez IG, Novoa MO, Córdoba GM. Comparison of growth fillet yield and proximate composition between Stirling Nile tilapia (wild type) (Oreochromis niloticus, Linnaeus) and red hybrid tilapia (Florida red tilapiaxStirling red O. niloticus) males. Aquac Res 2003; 34:1023-1028. [ Links ]
22. Rowena MR, Romana E, Ikedab M, Basiao ZU, Taniguchi N. Genetic diversity in farmed Asian Nile and red hybrid tilapia stocks evaluated from microsatellite and mitochondrial DNA analysis. Aquaculture 2004; 236: 131-150. [ Links ]
23. Rutten MJM, Komen H, Deerenberg RM, Siwek M, Bovenhuis H. Genetic characterization of four strains of Nile tilapia (Oreochromis niloticus L.) using microsatellite markers. Anim Genet 2004; 35: 93-97. [ Links ]
24. Melo DC, Oliveira DAA, Ribeiro LP, Teixeira CS, Sousa AB, Coelho EGA, Crepaldi DV, Teixeira EA. Caracterização genética de seis plantéis comerciais de tilápia (Oreochromis) utilizando marcadores microssatélites. Arq Bras Med Vet Zootec 2006; 58: 87-93. [ Links ]

