


Serviços Personalizados
Journal
Artigo
 Inglês (pdf)
 Artigo em XML
 Referências do artigo
 Enviar este artigo por email
Indicadores
-
 Citado por SciELO
 -
 Acessos
Links relacionados
-
 Citado por Google
 -
 Similares em
SciELO
Similares em
SciELO -
 Similares em Google
Compartilhar

 Permalink
Revista MVZ Córdoba
versão impressa ISSN 0122-0268
Rev.MVZ Cordoba vol.18 no.3 Córdoba set./dez. 2013
ORIGINAL
Parainfluenza-3 and bovine respiratory syncytial virus: intraherd correlation adjusted for sensitivity and specificity
Parainfluenza-3 y virus respiratorio bovino sincitial: correlación intrahato ajustado por la sensibilidad y especificidad
José Segura C,1* Ph.D, Daniel Figueroa Ch,2 M.Sc, Luis García-M,2 Ph.D, Alfonso Pescador R,2 Ph.D.
1Universidad Autónoma de Yucatán, Campus de Ciencias Biológicas y Agropecuarias, Mérida, Yucatán, México.
2Universidad de Colima, Centro Universitario de Investigación y Desarrollo Agropecuario.
*Correspondencia: jose.segura52@hotmail.com
Recibido: Marzo de 2012; Aceptado: Abril de 2013.
ABSTRACT
Objective. The purpose of this study was to compare the intra-class correlation coefficients (ICC) and design effects (D) estimates adjusted or unadjusted for sensibility (Se) and specificity (Sp) of the diagnostic tests using a Bayesian procedure. Materials and methods. Sera from 232 animals from 44 randomly selected herds, to detect antibodies against parainfluenza-3 virus (PIV3) from non-vaccinated dual-purpose cattle from Colima Mexico, were used. Only 176 animals from 33 herds were used to evaluate the presence of the bovine respiratory syncytial virus (BRSV). Results. The ICC and D values adjusted and unadjusted for PIV3 were 0.33, 2.73, 0.32, and 2.71, respectively. For BRSV the values were 0.31, 2.64, 0.28 and 2.49. Conclusions. The adjusted or unadjusted ICC and D estimates were similar because of the high Se and Sp of the diagnostic tests and the relatively high prevalence of the diseases here studied.
Key words: Bovine respiratory syncytial virus, design effect, intraclass correlation, parainfluenza-3 virus, (Source: CAB).RESUMEN
Objetivo. El propósito de este estudio fue comparar los valores de los coeficientes de correlación intraclase (ICC) y efecto de diseño (D) ajustados y no ajustados por la sensibilidad (Se) y especificidad (Es) de la prueba de diagnóstico usando procedimientos bayesianos. Materiales y métodos. Se utilizaron los sueros sanguíneos de 232 animales de 44 hatos seleccionados al azar, para detectar anticuerpos contra el virus de la parainfluenza-3 (VPI3) en bovinos de doble propósito, no vacunados en Colima, México. Se usaron 176 animales de 33 hatos para evaluar la presencia del virus respiratorio sincitial bovino (VRSB) Resultados. Los valores ajustados y no ajustados de ICC y D para VPI3 fueron 0.33, 2.73, 0.32 y 2.71, respectivamente. Para VRSB los valores fueron 0.31, 2.64, 0.28 y 2.49. Conclusiones. Los estimadores de ICC y D fueron similares debido a la alta Se y Es de las pruebas de diagnóstico y a la relativa alta prevalencia de las enfermedades estudiadas.
Palabras clave: Correlación intraclase, efecto de diseño, virus parainfluenza-3, virus respiratorio sincitial bovino (Fuente: CAB).
INTRODUCTION
The responses to the animal infection within herds (clusters) are normally correlated due to similarity caused by environmental and geographical factors, by characteristics linked to the choice of herd, or by management practices within herds. The intraclass correlation coefficient (ICC) is a measure of correlation between the individuals from a cluster (herd) that is used in the design and statistical analysis of epidemiologic studies (1). As an analytical tool, ICC has been used to adjust for infection clustering as part of a variance inflation factor (VIF) or design effect (D) for prevalence estimations (2).
The square root of the D measures, the increase in the standard error of the estimated prevalence due to the sampling procedure and it is used in calculating the correct sample size in cluster studies (3,4). It can be also used to adjust the significant levels of risk factors and confidence intervals in cross sectional cluster studies (4, 5). Knowing D for a specific disease may sample size calculation relatively easily. According to Solís et al (3), sample size for a cluster study can be calculated as D*n; where n is the sample size for a simple random survey (n=Z2pq/L2); p is the expected prevalence; Z is the table value for a standardized normal distribution with a desired confidence level and L is the desired precision or sampling error.
Statistical procedures that account for infection clustering but do not rely on ICC were also used (6) including Bayesian hierarchical models presented in Branscum et al (1,7). If the infectious status of each sampled animal were known, positive or negative ICC data could be estimated in different ways (8). However, in many epidemiological studies, researchers have only apparent infectious status data which can be used to estimate ICC, so ICC could be biased. Field studies are typically implemented by sampling animals from multiple herds and testing the sampled animals with an imperfect diagnostic test. Using data obtained from these studies, makes estimators calculated as suggested by Ridout et al (8) biased unless they are adjusted for imperfect test accuracy (1).
The previous authors proposed a Bayesian approach to estimate the ICC, which incorporates imperfect sensitivity (Se) and specificity (Sp), in a simulation study. In that study, they showed that ICC values obtained using analysis of variance are two- to three-fold lower than those using Bayesian approaches, and adjusting herd prevalence for Se and Sp in the diagnostic test. However, Branscum et al (1) did not compare the ICC values obtained using the adjusted and unadjusted data of the Bayesian approach.
The objective of this study was to determine the effect of imperfect sensitivity and specificity on ICC and D estimates using Bayesian procedures.
MATERIAL AND METHODS
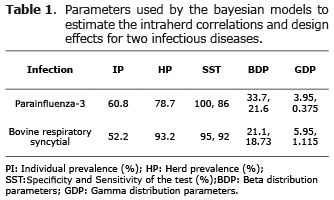
Data source and study design. A two-stage cross-sectional study was carried out from November 2007 to March 2008 in Colima, Mexico. Information on 232 animals from 44 randomly selected farms, was used (9) to detect antibodies against parainfluenza-3 virus (PIV3) from non-vaccinated dual-purpose cattle from Colima Mexico. However, because of economic constraints, blood samples of only 33 of the 44 farms were evaluated for BRSV. Herd sizes varied from 12 to 350 animals. The number of animals sampled within each herd varied between 4 and 8, and only animals over 6 months of age were sampled, to avoid the detection of maternal antibodies. The detection of serum antibodies for the viral diseases PIV3 and BRSV was carried out using commercial indirect ELISA kits (SVANOVA Biotech, Uppsala, Sweden). The individual and herd prevalence for PIV3 and BRSV have been reported in a previous study (9) and are shown in Table 1. The sensitivity (Se) and specificity (Sp) of the diagnostic tests for those infections were 100 and 86%, and 95 and 92% (10), respectively. The optical density (OD) was measured at 450 nm with a Titertek Multiscan Spectrophotometer (Flow Laboratories, Irvine, UK). The sample OD-corrected values <0.20 were considered negative as indicated by the ELISA kit.
Intraherd correlation coefficient and design effect estimates. Binomial data (Yij) were modeled as beta-binomial assuming independent beta prior distributions for Se, Sp, µ (mean prevalence distribution) and γ (variability of prevalence) modeled using a gamma prior distribution. The Bayesian model was:
Yij|pi ~ Bernoulli(pi)
pi = πiSe + (1-πi)(1-Sp)
πi = πi* with probability 1-τ
πi = 0 with probability τ
πi*|µ,γ ~ Beta(µγ, γ(1-µ))
µ ~ Beta(αµ, βµ)
γ ~ Gamma (αγ, βγ)
Se ~ Beta(αSe, βSe)
Sp ~ Beta (αSp, βSp)
Where pi is the apparent prevalence for the ith herd, πi is the infection prevalence of the ith herd and τ is the proportion of infected herds sampled, which was set to the herd prevalence of the sample.
The ICC based on the above model was calculated as suggested by Branscum et al (1):
![]()
D was estimated as (3):
D = 1+(b-1) x ICC
Where b is the average number of animals sampled per herd.
The model used the WinBUGS program (11). In this study a total of 20,000 samples of possible ICC and D values were generated and the results of the first 500 rounds were deleted. The parameters of the prior beta distributions (αµ and βµ) were obtained with the Betabuster software (12). On the other hand, the parameters of the prior gamma distribution (αγ and βγ) were obtained according to Hanson et al (13), using a program developed in the Gauss software for Windows. The parameters used in this paper are shown in table 1.
RESULTS
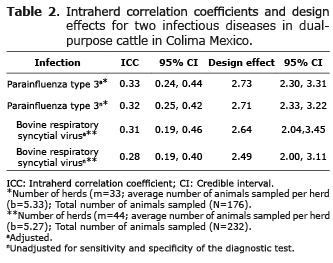
The ICC and D values, adjusted for Se and Sp of their respective diagnostic tests, and their 95% credible intervals for PIV3 and BRSV are presented in table 2. ICC values for PIV3 were 0.33 (adjusted) and 0.32 (unadjusted) and their D values were 2.73 (adjusted) and 2.71 (unadjusted). For BRSV the ICC values were 0.31 (adjusted) and 0.28 (unadjusted) and the D values 2.64 (adjusted) and 2.49 (unadjusted). Credible intervals are provided in table 2.
DISCUSSION
The results for the unadjusted and adjusted ICC and D closely agree for both PIV3 and BRSV data because the Se and Sp of the ELISA tests were high. A simulated scenario considering Se and Sp of 70% provided ICC values of 0.38 and 0.35 for PIV3 and BRSV and D values of 3.03 and 2.83, respectively, which produced a slight increase in the parametrical estimates. Another factor that may affect the results here found is the prevalence of the diseases. Branscum et al (1) used a prevalence of 26% for ovine progressive pneumonia, whereas in this study the prevalence for PIV3 and BRSV was much higher (60.8 and 52.2%, respectively) and closer to 50%.
Branscum et al (1) showed that treating diagnostic test results as indices of true infection status and variance analysis procedures can result in two- to three-fold underestimation of the true ICC. They concluded that their Bayesian model for ICC estimation, which accounted for diagnostic test imperfection and uncertainty in the true values of Se and Sp, provided reasonable estimates of the ICC for simulated data. However, they compared ICC estimates using analysis of variance and Bayesian procedures. They also observed that their ICC estimates for data from a study on ovine progressive pneumonia gave similar results by using analysis of variance and Bayesian procedures, because of the high Se and Sp in the diagnostic test. In the present study the adjusted and unadjusted estimates were both obtained using Bayesian procedures.
Estimations of ICC or D are needed in order to perform sample size calculation when the unit of interest (animal) is clustered within herds. One program (among others) that uses D to calculate sample size is OpenEpi (14). ICC or D also could be used for adjustment of standard errors, and prevalence and odd ratios confidence intervals in cluster sampling studies, where computer programs are not available. However, because of the variability in herd susceptibility to diseases, and environmental and management differences between regions, it may be inappropriate to uniformly assign a particular value of the ICC to a specific disease process, even when the ICC has been estimated through a well-designed epidemiologic study.
ICC and D values for PIV3 and BRSV (adjusted for Se and Sp) found in this study (0.33 and 2.73, and 0.31 and 2.64, respectively) were different from those reported (4) in beef cattle in Yucatan (0.19 and 3.44 for PIV3, and respectively), which used an analysis of variance methodology. The prevalence and average number of animals per herd in the Solis-Calderon et al (4) study were 90.8% and 14 animals, and 85.6% and 14 animals, respectively. Even though the ICC values here obtained were larger, the D values were smaller, because of the small number of animals (mean=5.3 animals) sampled in each herd. McDermott and Schukken (15) showed that cluster size has the single most important effect on the VIF or D. The ICC values for PIV3 and BRSV obtained in this study indicate that nearly 30% of the variation of the disease is explained by in-between herd variation and 70% by animal o individual risk factors within herds.
The D values for PIV3 and BRSV indicate that under the conditions of this study, sample size should be 2.73 and 2.64 times greater than the sample size needed for a simple random sampling survey, in order to achieve the same prevalence precision. Unfortunately, ICC and D are unknown at the beginning of the study, so it is desirable that cluster-sampling studies report both the ICC and D values to design better survey studies and obtain unbiased prevalence confidence intervals.
The differences here reported and those by Solís-Calderón et al (4) suggest that each region requires the use of appropriate ICC and D values, since the incidence of a disease depends on environmental factors in the region and specific practices within the herd, as well as the number of animals sampled per herd. However, ICC and D values for a given disease could be used from one region to another, when management and environmental conditions are similar and where the infection is endemic and in reasonable equilibrium (1).
In conclusion under the conditions of this study the ICC and D values for PIV3 and BRSV indicate that similar sample sizes are required for both diseases to achieve the required precision in prevalence estimates. The report of ICC and D values could help plan and design epidemiological studies and to adjust parameter estimates of cluster studies.
Acknowledgement
Authors thanks Dr Jorge Sosa Argaez for calculating the gamma distribution parameters used in this study.
REFERENCES
1. Branscum AJ, Gardner IA, Wagner BA, McInturff PS, Salman MD. Effect of diagnostic testing error on intra-cluster correlation coefficient estimation. Prev Vet Med 2005; 69:63-75. [ Links ]
2. Bohning D, Greiner M. Prevalence estimation under heterogeneity in the example of bovine trypanosomosis in Uganda. Prev Vet Med 1998; 36:11-23. [ Links ]
3. Bennett S, Woods T, Liyanage WM, Smith DL. A simplified general method for cluster-sampling surveys of health in developing countries. World Health Stat Q 1991; 44:98-106. [ Links ]
4. Solís-Calderón JJ, Segura-Correa JC, Aguilar-Romero F, Segura-Correa VM. Detection of antibodies and risk factors for infection with bovine respiratory syncytial virus and parainfluenza virus-3 in beef cattle of Yucatan, Mexico. Prev Vet Med 2007; 82:102-110. [ Links ]
5. Solís-Calderón JJ, Segura-Correa JC, Aguilar-Romero F, Segura-Correa VM. Prevalencia de anticuerpos contra Histophilus somni y factores de riesgo en ganado para carne en Yucatán, México. Vet Mex 2008; 39:29-38. [ Links ]
6. Wagner B, Salman MD. Strategies for two-sampling designs for estimating herd-level prevalence. Prev Vet Med 2004; 66:1-17. [ Links ]
7. Branscum AJ, Gardner IA, Johnson WO. Bayesian modelling of animal- and herd-level prevalences. Prev Vet Med 2004; 66:101-112. [ Links ]
8. Ridout MS, Demetrio CGB, Firth D. Estimating intraclass correlation for binary data. Biometrics 1999; 55:137-148. [ Links ]
9. Figueroa-Chávez D, García-Márquez LJ, Pescador-Rubio A, Valdivia Flores AG, Segura Correa JC. Detection of antibodies and risk factors for infection with bovine respiratory syncytial virus and parainfluenza virus-3 in dual-purpose farms in Colima, Mexico. Trop Anim Health Prod 2012; 44:1423-1437. [ Links ]
10. Graham DA, McShane J, Mawhinney KA, McLaren LE, Adair BM, Merza M. Evaluation of a single ELISA system for detection of seroconversion to bovine viral diarrhea virus, bovine respiratory syncytial virus, parainfluenza-3 virus, and infectious bovine rhinotracheitis virus: comparison with testing by virus neutralization and hemagglutination inhibition. J Vet Diag Invest 1998; 10:43-48. [ Links ]
11. Lunn DJ, Thomas A, Best N, Spiegelhalter D. WinBUGS 1.4.3 a Bayesian modeling framework: concepts, structure, and extensibility. Stat Comput 2000; 10:325-337. [ Links ]
12. Chun-Lung S. Betabuster software. [On line]. [Accessed 2012/03/15.]. Availabe URL in: http://www.epi.ucdavis.edu/diagnostictests/betabuster.html. [ Links ]
13. Hanson TE, Johnson WO, Gardner IA. Hierarchical models for estimating herd prevalence and test accuracy in the absence of a gold-standard. J Agric Biol Environ Stat 2003; 8:223-239. [ Links ]
14. Dean AG, Sullivan KM, Soe MM.OpenEpi:Open Source Epidemiologic Statistics for Public Health, [On line] Version 2.3.1.2001. [accessed 2012/03/15]. Availible URL in:www.openepi.com [ Links ]
15. McDermott JJ, Schukken YH. A review of methods used to adjust for cluster effects in explanatory epidemiological studies of animal populations. Prev Vet Med 1994; 18:155-173. [ Links ]
