


Services on Demand
Journal
Article
 English (pdf)
 Article in xml format
 Article references
 Send this article by e-mail
Indicators
-
 Cited by SciELO
 -
 Access statistics
Related links
-
 Cited by Google
 -
 Similars in
SciELO
Similars in
SciELO -
 Similars in Google
Share

 Permalink
Revista MVZ Córdoba
Print version ISSN 0122-0268
Rev.MVZ Cordoba vol.19 no.1 Córdoba Jan./Apr. 2014
ORIGINAL
Application of the logistic model to describe the growth curve in dogs of different breeds
Aplicación del modelo logístico para describir la curva de crecimiento en perros de diferentes razas
Sandra Posada O,1* Ph.D, Luis Gomez O,2 M.Sc, Ricardo Rosero N,1 Ph.D.
1Universidad de Antioquia, Faculty of Agricultural Sciences, Animal Science Research Group-GRICA, AA 1226, Medellin, Colombia.
2Empresa Solla S.A., AA 1272, Medellin, Colombia.
*Correspondence: slposada@gmail.com
Received: February 2013; Accepted: August 2013.
ABSTRACT
Objective. To model the growth in dogs of different size and breeds that during their development showed a relative body weight according to the standards of their racial group. Materials and methods. The data used were obtained from the Canine Research Center (CIC), property of Empresa Solla S.A., located in the municipality of Rionegro (Antioquia, Colombia). The parameters of the growth curve were defined based on the logistic model using the procedure PROC NLIN of the SAS. Results. The adult weight (a) ranged from 2.12 Kg (York Shire Terrier) to 32.88 Kg (Weimaraner). For small, medium and large breeds, growth rates (1/b) during the exponential phase ranged between 9.91-18.91%, 9.12-13.83% and, 8.17-14.38%, respectively, and the average age at which 50% of the adult weight was reached (x0) was 3.49±0.03, 4.21±0.42 y 5.27±0.86 months, correspondingly. Large dog breeds reached maturity (T99) later than smaller breeds, 14.37±1.79 vs. 9.46±1.63 mo. Conclusions. The logistic model was able to describe the growth in dogs of different size, however, a larger sample size will improve its predictive ability, given the individual variability that characterizes growth.
Key words: Body size, body weight, growth model, growth rate, regression analysis (Source: CAB, USDA).
RESUMEN
Objetivo. Modelar el crecimiento en perros de diferentes tamaños y razas, que durante su desarrollo exhibieron un peso corporal relativo acorde con los estándares de su grupo racial. Materiales y métodos. Los datos utilizados fueron obtenidos del Centro de Investigaciones Caninas (CIC) de la Empresa Solla S.A., ubicada en el municipio de Rionegro (Antioquia, Colombia). Los parámetros de la curva de crecimiento fueron definidos desde el modelo logístico utilizando el procedimiento PROC NLIN del programa estadístico SAS. Resultados. El peso de los adultos (a) fluctuó entre 2.12 Kg (York Shire Terrier) hasta 32.88 Kg (Weimaraner). Para las razas pequeñas, medianas y grandes, las tasas de crecimiento (1/b) durante la fase exponencial fluctuaron entre 9.91-18.91%, 9.12-13.83% y, 8.17-14.38%, respectivamente, y la edad media a la cual se alcanzó el 50% del peso adulto (xo) fue 3.49±0.03, 4.21±0.42 y 5.27±0.86 meses, correspondientemente. Las razas de perros grandes alcanzaron la madurez (T99) mucho más tarde que las razas de perros pequeños, 14.37±1.79 vs. 9.46±1.63 meses. Conclusiones. El modelo logístico fue adecuado para describir el crecimiento en perros de diferente tamaño, no obstante, un tamaño de muestra mayor mejoraría la capacidad predictiva del mismo, dada la variabilidad individual que caracteriza el crecimiento.
Palabras clave: Análisis de regresión, modelo de crecimiento, peso corporal, tamaño corporal, tasa de crecimiento (Fuente: CAB, USDA).
INTRODUCTION
Growth is a complex process of cell proliferation in which there are interactions between genetics, nutrition, and other environmental influences. The most usual growth measurement is body weight, whereupon growth can be summarized through mathematical models that translate into cumulative weight gain curves (1). Growing dogs go through three critical periods in the first 12 months of life, namely, a lactation period, a weaning period and a post-weaning period: the latter is critical for skeletal development and other body systems. In relation to age, the fastest growth occurs during the first 3-6 months of life, while maturity (adult size) is reached between 10-16 months for large breeds and between 6-12 months for smaller breeds, at which time most of the dogs have increased their weight at birth in between 40 and 50 times (2). Depending on the breed, adult body weight varies more than 100 times, from 2-6 lb. for Chihuahuas up to 150-180 lb. for St. Bernards (3).
During growth, it is essential to provide a balanced diet so the animal shows proper skeletal and muscular development and the typical growth rate of the specimens of its breed and reaches its normal adult size. According to the NRC (4), growing dogs require twice the energy required by adult dogs of the same breed per unit of body weight. A decrease in the energy contribution to 1.6 and 1.2 times the maintenance level is recommended when 50% and 80% of the adult weight is reached, respectively. However, in the opinion of Case et al (2) and Hawthorne et al (3), the energy demand is affected by variations in the size, corporal estructure, temperament and coat type, which generates differences in the growth patterns of specific breeds. Increases in the growth rate lead to an early maturity, inadequate skeletal development, increase in the number of fat cells, increased risk of obesity in adulthood and the reduction of longevity (5).
The logistic model expresses the growth phenomenon of organisms analytically. Both the animal and human population face obstacles to survival, which increase proportionally in relation to the excess of the total population. This means that after a period of rapid growth in the population there is always a period of slower progress, which finally tends to stabilize (6). Applied to nonlinear models, the logistic curve models the sigmoid function, where growth is initially exponential models (increases by a constant percentage depending on time), and after certain time slows down (growth rate decreases) and finally, in maturity, stops.
Little information is available on the parameters that define the growth curves of specific breeds, which could guide the personnel responsible for the ownership of pets (breeders, owners, professionals) on the target growth rate at which the feeding and activity level of the animal should be directed, for improving their health and wellbeing in adulthood. The objective of this study was to apply the logistic model to describe the growth parameters of dogs of different breeds, small, medium and large, that during their development displayed adequate relative body weight and body condition.
MATERIALS AND METHODS
Study site. The data used for the construction of the growth curves were obtained from the Canine Research Center (CIC) of Empresa Solla S.A., located in the municipality of Rionegro, to the east of the department of Antioquia (Colombia). The agro-ecological conditions in the area correspond to an average temperature of 17°C, relative humidity of 75%, annual precipitation of 2280 mm and height above sea level of 2125 m.
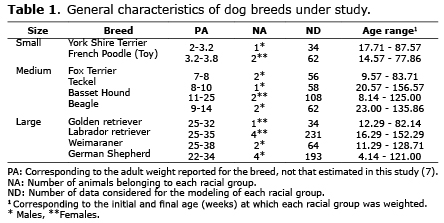
Animals. Dogs (n=21), corresponding to 10 different breeds, classified as small (n=3), medium (n=7) and large (n=11), were included in this study. For each breed, the information corresponding to the number of individuals evaluated, the age range for the application of the model and the number of data used for modeling is shown in table 1.
Feeding and handling. The animals were fed with a variety of commercially available, nutritionally complete foods of Premium and Super Premium categories, formulated to meet the nutritional demands of the growth stage. The variety of foods offered is because the specimens of the CIC must be trained for carrying out palatability tests. The quantity supplied was individualized, based on the body weight and energy requirements (4), and guaranteed twice per day, every 8 and 18 hours, in the kennels assigned to each animal.
From 5 p.m. and until 9 a.m. of the next day, the animals were kept in 2x4 m kennels, which had a top cover (roof) in the feeding and leisure areas and outdoor area for rest and excretion activities. Once the first ration has been offered, the animals were organized into three groups, prior study and observation of their hierarchical structure, and located in open spaces, in which they socialized. Likewise, the animals had access to adequate space for their training (agility), an activity that each animal practiced according to an expert's criteria, taking into account the age and experience level. Finally, each animal made walks with an average duration of one hour, twice a week.
Collection of information and data processing. The weighing of each specimen was made with a weekly frequency, always at the same time and before the first daily ration. The age of each animal was calculated, after the record of the date of birth, to build the weight-age database.
For each breed, the parameters of the growth curve were defined based on the logistic model described by Hawthorne et al (3), corresponding to:
y = a/{1+exp[-(x-x0)/b]}, where,
y= body weight reached at age x,
a= adult body weight (asymptotic weight) (grams),
(1/b)= growth rate during exponential phase (%), and
x0= time needed for reaching 50% of adult weight (weeks).
The adjustment of the data to this model and the estimates of parameters were carried out through an iterative process using the Marquardt algorithm of the procedure for nonlinear models PROC NLIN of SAS (8). All the specimens belonging to a same breed were considered for adjusting the model. Whenever the logistic function cannot calculate the adult body weight, the age (weeks) at which each breed reached 99% of their adult weight (T99) was calculated from the estimated parameters.
RESULTS
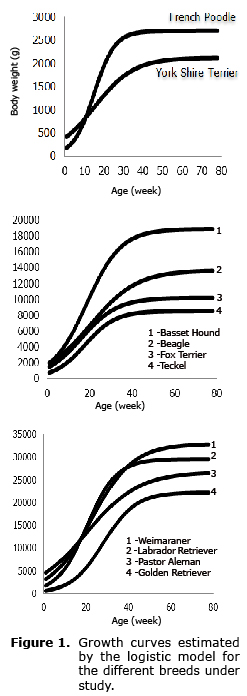
The growth curves estimated from the logistic model for each of the breeds, small, medium and large are shown in figure 1.
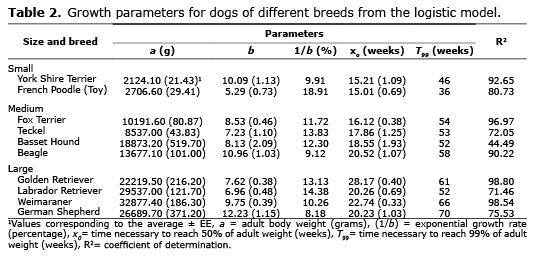
The estimates of the parameters, resulting from the adjustment of the weight-age data to the non-linear growth model, with the respective standard errors (EE), are shown in table 2. The adult weight (a) ranged between 2.12 Kg (York Shire Terrier) to 32.88 Kg (Weimaraner). Fifty percent of the adult weight was reached at 15.11±0.14, 18.26±1.82 and 22.85±3.74 (x0) weeks in small, medium and large breeds, respectively. The duration of this growth phase was increased in proportion to the adult weight and during the same, the growth rates were exponential (the body weight logarithm increased linearly). Growth rates during the exponential phase (weight increase rate per week) (1/b) fluctuated between 9.91 and 18.91% for small breeds, 9.12 and 13.83% for medium-sized breeds, and 8.18 and 14.38% for large breeds. It was noted that small breeds reached 99% of their adult body weight (T99) between 36 and 46 weeks, medium breeds between 52 and 58 weeks and large breeds between 52 and 70 weeks. Finally, the coefficients of determination (R2) for all breeds evaluated fluctuated between 44.49 and 98.80%.
DISCUSSION
The logistic curve models the sigmoid function, where growth is initially exponential (increases by a constant percentage depending on time), after certain time slows down (growth rate decreases) and finally, in maturity, stops. This behavior is observed in the growth curves showed in figure 1, where the rapid acceleration phase is followed by a phase of lower growth rate - as the animal approaches its adult weight (asymptotic weight) - and then a stabilization phase of the body weight, corresponding to the adult weight.
In relation to the behavior of the parameters (Table 2), it is observed that the exponential growth phase increases with the adult weight estimated by the model (a), showing higher values for the parameter x0. The Spearman's rank correlation analysis showed the direct and meaningful relationship that exists between the parameters a and xo (r=0.6959, p<0.05). Between growth functions with behavior sigmoidal, the logistic equation sets the turning point exactly at 50% of the mature weight of the animal (9), which explains the direct relationship recorded between parameters a and x0. In contrast to the results of this study, where the correlation between parameters a and 1/b was neither high nor significant (-0.32, p=0.3642), Malhado et al (10) in an experiment with buffalos, found that the correlation between these parameters was high (-0.71), whose biological interpretation is that animals with higher growth rates are less likely to reach higher weights at maturity, when compared with those that grow more slowly in the beginning of their life. Sarmento et al (11) highlights that this relationship, biologically, is the most important. The inverse of the parameter b (1/b) reflects a relative growth rate during the exponential phase, which for the logistic model is before reaching 50% of the asymptotic weight, i.e. before the turning point. Tables 1 and 2 show that the moment when body weight measurements began exceeded the parameter x0 for the York Shire Terrier, Dachshund and Beagle breeds, which illustrates the lack of data during the exponential phase, biasing the results of 1/b for the breeds mentioned.
Case et al (2) confirmed the shorter duration of the period of faster growth in small breeds, which ends at around 3 months of age, while in large and giant breeds, the exponential growth may be extended in 1 and 2 months, respectively. As an empirical rule, small and medium-sized dogs (adult weight up to 25 Kg) reached around 50% of their adult weight at approximately 4 months of age and those with a weight over 25 Kg, at about 5 months of age. This concept coincides with the results of this study, where small, medium and large breeds exhibited a mean value for the parameter x0 corresponding to 3.49±0.03, 4.21±0.42 and 5.27±0.86 months, respectively (average + standard deviation).
From the results of this study it is concluded that the duration of the growth period of dogs depends on the size of the animal. Large dog breeds reach maturity much later than small dog breeds. Ninety-nine percent of the adult body weight (T99) for small, medium and large breeds was achieved on average at 9.46±1.63, 12.52±0.61 and 14.37±1.79 months, respectively (average+standard deviation). These findings are in line with the indications given by Case et al (2), concerning that maturity (adult size) is reached between 10 and 16 months of age for large breeds and between 6 and 12 months of age for smaller breeds.
Based on the general concept that the growth curve stabilizes at one year of age, most food manufacturers and industry professionals recommend guaranteeing puppy food until that time, nevertheless, it is important to highlight that this concept is only applicable to medium breed puppies. When dealing with large or giant breeds it will be necessary to extend the supply of nutrients to meet the growth demands for an additional period, which was mathematically evidenced from the parameters of the logistic model used for the analysis of the data of this study. According to the NRC (4), medium, large and giant breeds reach 95, 88 and 80% of their mature weight (20, 35 and 60 Kg, respectively) at 12 months of age. Nutritional guidelines, as well as professionals and personnel responsible for pet ownership, must guide the handling plans (feeding and activity) from the knowledge of the growth curves that characterize different breeds, which albeit of similar sizes have differences in the parameter estimated, as evidenced in this study. It is recognized that the growth rate provides valuable information about the associated nutritional risks, namely obesity and developmental orthopedic disease, common in pets.
In this study, the logistic model was appropriate to describe the growth of different-sized dogs, however, a larger sample size will improve its predictive capability, given the individual variability that characterizes growth.
REFERENCES
1. Trangerud C, Grøndalen J, Indrebø A, Tverdal A, Ropstad E, Moe L. A longitudinal study on growth and growth variables in dogs of four large breeds raised in domestic environments. J Anim Sci 2007; 85:76-83. [ Links ]
2. Case LP, Carey DP, Daristotle L, Hayek MG, Raasch MF. Development and Treatment of Obesity. Canine and Feline Nutrition, 3th edición. USA: Mosby Elsevier; 2011. [ Links ]
3. Hawthorne AJ, Booles D, Nugent PA, Gettinby G, and Wilkinson J. Body-Weight Changes during Growth in Puppies of Different Breeds. J Nutr 2004; 134:2027S-2030S. [ Links ]
4. National Research Council -.NRC. Nutrient requirements of dogs and cats. 1a ed. Washington, D.C: National Academy Press; 2006. [ Links ]
5. German AJ. The Growing Problem of Obesity in Dogs and Cats. J Nutr 2006; 136:1940S-1946S. [ Links ]
6. Ulloa JTI, Rodríguez JAC. El modelo logístico: Una alternativa para el estudio del crecimiento poblacional de organismos. REDVET [en línea] 2010; [fecha de acceso 15 de septiembre de 2013]; 11(3). URL disponible en: http://www.veterinaria.org/revistas/redvet/n030310/031004.pdf. [ Links ]
7. American Kennel Club. AKC Breeds complete breed list. [en línea] AKC: 2012; [acceso 30 de septiembre de 2013]. URL disponiblen en: http://www.akc.org/breeds/complete_breed_list.cfm. [ Links ]
8. SAS/STAT: User guide version [programa de ordenador]. Versión 9.1.3. Cary (NC): SAS Institute Incorporation; 2003. [ Links ]
9. Kuhi HD, Porter T, Lopez S, Kebread E, Strathe AB, Dumas A, Dijkstra J, France J. A review of mathematical functions for the analysis of growth in poultry. World Poultry Sci J 2010; 66:227-240. [ Links ]
10. Malhado CHM, Ramos AA, Carneiro PLS, Souza JC, Wechsler FS, Eler JP, Azevêdo DMMR, Sereno JRB. Nonlinear models to describe the growth of the buffaloes of murrah breed. Arch Zootec 2008; 57:497-503. [ Links ]
11. Sarmento JLR, Regazzi AJ, Souza WH. Estudo da curva de crescimento de ovinos Santa Inês. Rev Bras Zootec 2006; 35:435-442. [ Links ]
