


 English (pdf)
 Article in xml format
 Article references
 Send this article by e-mail
 Cited by SciELO
  Cited by Google
  Similars in
SciELO
Similars in
SciELO  Similars in Google
 Permalink
INTRODUCTION
Anadara tuberculosa belongs to the Mollusca phylum, Bivalvia class, Arcoida order and Arcidae family. This species sustains one of the main artisanal fisheries of the coastal zone in the Nariño Pacific region, constituting an important source of protein for the human communities of the littoral and its extraction volumes have depended as much on the necessities of family supply as on local commerce 1. There is an uncontrolled increase in the extraction of this resource where it is distributed, especially in southern Colombia 2,3. This increase in exploitation poses a problem associated with the natural supply of the resource, for fishery and for the communities that obtain their daily livelihood from this activity 2. Due to these and other indications of a decline in the fishing density in Colombia and other countries 1,4,5, A. tuberculosa was included in the Red Book of Marine Invertebrates of Colombia as a threatened species in the Vulnerable category 6.
Currently there are tools to evaluate genetic diversity, which include molecular markers that are a set of techniques that allow visualizing or indicating the presence of allelic variants, as a result of some type of mutation through evolutionary time 7. The application of these markers provides information on the history, demography, ecology and behavior of species that can assist in risk assessment, prioritization, delineation of units and design of effective conservation strategies 8. Since 1970 the analysis of mitochondrial DNA (mtDNA) has been established as a powerful tool for evolutionary studies in animals. The cytochromo oxidase sub-unit I (COI) is part of a complex gene encoding of transmembrane proteins, involved in the electrical transport and catalysis of the respiratory chain of eukaryotic organisms and has been the subject of population genetic variability studies due to its universality and evolutionary importance 9. The mtDNA has characteristics such as its matrilineal inheritance, it is haploid, has a high rate of evolution and includes conserved and variable regions, which has made it a tool used in several studies 10-12. Therefore, the purpose of this research was to use COI as molecular marker to estimate genetic diversity in five mangrove islands in Tumaco, Colombia.
MATERIALS AND METHODS
Sampling. The collection of individuals was carried out in five mangrove islands located in Tumaco, in the southwest of the department of Nariño, Colombia (1° 48' 24" N, 78° 45' 53" W): San Jorge, La Tiburonera, El Pajal, La Playa or Resurrection and Bajito Vaqueria. The individuals were collected during low tide hours, when mangroves are uncovered, lasting approximately from four to six hours. Ten specimens were collected at random from each mangrove and were taken to a sterile area where a sample of the muscle tissue of the foot was taken. The samples were placed in absolute alcohol previously arranged in individual 1.5 ml microtubes and were stored at room temperature.
DNA Extraction. The 50 samples were transported to the laboratory (Laboratory of Animal Genetic Improvement of Universidad de Nariño) where the extraction of DNA was carried out. Between 50 and 100 mg of preserved tissue were taken, the tissue was washed with distilled water three times and shook with Vortex (Labnet, USA). It was subsequently macerated until small particles were obtained and buffered saline was immediately added (0.4 M NaCl, 100 mM Tris-HCl pH 8 and 2 mM pH 8 EDTA). Afterwards 80 μl of 20% SDS and 16 μl of proteinase K (20 mg ml-1) were added and homogenized inversely for 1 minute. Each sample was incubated for 16 hours at temperatures of 55-65 °C. In order to separate the DNA from the proteins present, 300 μL of 5M NaCl was added and inversely mixed 5 times, followed by centrifugation at 10,000 rpm for 35 minutes. The supernatant was transferred into a volume of 400 μL to a new microtube and the same volume of isopropanol was added thereto, admixed inversely and then incubated at -20 °C from 15 to 60 minutes.
To isolate the DNA, it was centrifuged at 10,000 rpm for 20 minutes and the supernatant was discarded. Finally, the DNA was washed with 300 μL of 70% ethanol and centrifuged at 10,000 rpm for 5 minutes. Excess ethanol was removed and the precipitated DNA was dried in the presence of heat for 15 minutes. Finally, the DNA was resuspended in 150 μL of TE buffer. To improve DNA quality, a treatment was carried out with RNAse (20 mg ml-1) and incubated at 37 °C for 1 hour.
PCR of the mitochondrial gene COI. PCR amplification was carried out in a reaction volume of 25 μl using the following working components and concentrations: 10 ng μl-1 of DNA; 2 mM of dNTPs (Promega, Madison, USA); 1 μM of primers (IDI, Coralville) forward (LCO1490) and 1 μM of reverse (HCO2198); 2.5 mM of MgCl2; 0.5 units of Taq polymerase (Promega, Madison, USA) and the volume was completed with nuclease-free water (IDI, Coralville). The gene was then amplified in a thermocycler (Bio-rad MyCycler, Hercules, CA, USA) with the following program: 1 denaturation cycle of 5 minutes at 94 °C; followed by 35 hybridization cycles, composed for 30 seconds at 94 °C, 45 seconds at 50 °C and 1 minute at 72 °C; finally, an extension cycle for 7 minutes at 72 °C (Concepto Azul). The PCR products were sequenced with an ABI 3730 XL Automated Sequencers (Macrogen Inc., Seoul, Korea).
Statistical analysis of sequences. Sequences were verified with the GenBank database for COI by BlastN. The sequences obtained with identity percentages greater than or equal to 95% were edited with the Bioedit program and aligned with the Mega4 program. The haplotype and nucleotide diversity was estimated with the DnaSp5 program. The same program was used to estimate the Fs statistic 13 and the distribution between pairs of frequencies (Mismatch distribution) was evaluated. Finally an analysis of nucleotide variation and population structure was carried out through AMOVA (Analysis of Molecular Variance), executing 10,000 permutations with the 2006 Arlequin program.
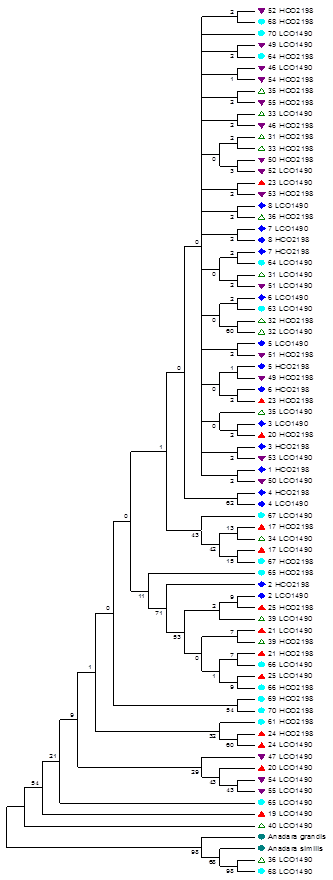
In addition, a phylogenetic tree was elaborated using sequences of sister species as external groups (A. similis and A. grandis), for the same gene, available in GenBank and a tree was constructed with the UPGMA method on the Mega4 program.
RESULTS
The PCR products showed a molecular size of 710 bp. According to the BlastN analysis, 74 sequences had identity percentages greater than or equal to 95%, which were used for the estimation of genetic parameters. For the populations evaluated, the haplotype diversity was 0.6830±0.0600 (variance of 0.0035) and nucleotide diversity was 0.0399±0.0195 (variance of 0.0004). Table 1 shows the values analyzed for each population.
Table 1 Haplotype diversity (h) and nucleotide diversity () for the populations evaluated according to DNAsp.
| Population | |||||
|---|---|---|---|---|---|
| h | 1 | 2 | 3 | 4 | 5 |
| 0.943 ±0.040 | 0.859 ±0.063 | 0.879 ±0.058 | 0.882 ±0.052 | 0.962 ±0.040 | |
| 0.012 ±0.003 | 0.014 ±0.003 | 0.096 ±0.066 | 0.008 ±0.001 | 0.103 ±0.062 | |
| 1: San Jorge, 2: La Tiburonera, 3: El Pajal, 4: La Playa y 5: Bajito Vaqueria. | |||||
Ninety-nine changes were observed in the sequences of the species A. tuberculosa, corresponding to mutations describing 21 haplotypes (Table 2).
Table 2 Transitions and transversions of the 21 haplotypes found in A. tuberculosa population. Calculated with Mega4
| Transitions/ Transversions | ||
|---|---|---|
| G --> A | 21.76 | |
| T --> C | 26.79 | |
| C --> T | 20.22 | |
| A --> G | 5.62 | |
| T --> A | 3.79 | |
| C --> G | 1.26 | |
| G --> T | 3.79 | |
| C --> A | 2.86 | |
| The general transition / transversion trend id R = 1.857 |
The analysis of nucleotide variation showed percentages of base composition equal to 22.6% for cytosine (C), 23.5% for thymine (T), 38.7% for adenine (A) and 15.2% for guanine (G). The mean nucleotide difference (k) was 5.56. We analyzed 640 bases, where 541 monomorphic sites and 99 polymorphic sites were found, of which 81 were parsimonious sites that provided information to define the haplotypes found. A total of 74.39 transitions and 11.70 transversions were identified, as described in Table 2.
On the other hand, the analysis of the distribution between pairs of sequences (Mismatch distribution) performed in the five islands under study as a whole, showed a unimodal distribution as shown in Figure 1. The solid line (blue) represents the expected distribution in the case of individuals collected from different islands belong to a stationary population. The dotted line (red) represents the observed distribution. When the analysis was done separately for each island, a unimodal distribution for La Tiburonera and a multimodal distribution for the other islands was observed (San Jorge, El Pajal, La Playa and Bajito Vaqueria) (Figure 2).
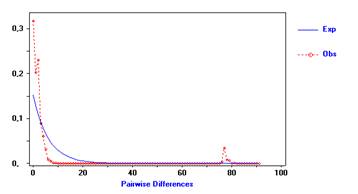
Figure 1 Frequency distribution of the number of nucleotide differences between sequences of the COI gene of Anadara tuberculosa for all sequences as a whole.
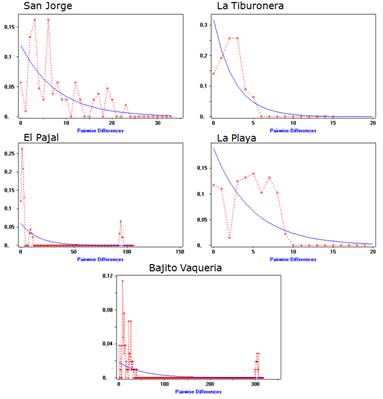
Figure 2 Frequency distribution of the number of nucleotide differences between pairs of COI gene sequences of Anadara tuberculosa in the five populations evaluated.
The value of the Fs statistic of Fu was negative and non-significant (Fs=-2.96). When it was estimated for each island studied, a negative value was found in three of them (San Jorge Fs=-0.87, La Tiburonera Fs=-0.94 and La Playa Fs=-0.20) and a positive value was found for the remaining islands (El Pajal Fs=4.53 y Bajito Vaqueria Fs=2.57).
The molecular analysis of genetic variance and structure showed that there is no population structure in the mitochondrial region of A. tuberculosa studied (Table 3), finding that only 4.20% of the total variation observed is explained by the variation between islands (FST=0.042, p≤0.05).
Table 3 Analysis of Molecular Variance (AMOVA) according to 2006 Arlequin program. Degrees of freedom (D.F.), Sum of squares (S.C.), p≤0.05.
| Variation sources | D.F. | SC | Variance components | Variance percentage |
|---|---|---|---|---|
| Between populations | 4 | 201.695 | 1.34188 Va | 4.20 |
| In populations | 69 | 2.111.657 | 30.60372 Vb | 95.80 |
| Total | 73 | 2.313.351 | 3.194.560 |
As shown in Table 4, the paired population analysis revealed genetic differences below 0.10, except for the data observed between the Tiburonera and Playa islands (FST=0.19, p≤0.05).
Table 4 Values of the fixation index (FST) among pairs of populations, according to 2006 Arlequin program.
| Site | Fixation Index (FST) | FST between population pairs | ||||
|---|---|---|---|---|---|---|
| SJ | LT | EP | LP | BV | ||
| Total | 0.04201 | |||||
| SJ | 0.09248 | 0.000 | ||||
| LT | 0.01677 | 0.086 | 0.000 | |||
| EP | -0.02837 | 0.027 | -0.035 | 0.000 | ||
| LP | 0.10020 | 0.044 | 0.186 | 0.071 | 0.000 | |
| BV | 0.01314 | 0.073 | -0.013 | -0.031 | 0.148 | 0.000 |
| SJ: San Jorge; LT: La Tiburonera; EP: El Pajal; LP: La Playa y BV: Bajito Vaqueria. NS: no significant differences; *: p≤ 0.05 | ||||||
Finally, Figure 3 shows the phylogenetic tree of the resulting groups among individuals from the five islands. A total of 138 positions were found in the final data set.


DISCUSSION
A. tuberculosa is a bivalve mollusk that is associated with the roots of mangroves, especially Rhizophora spp., In the American Pacific. In Colombia, they are the most exploited bivalves in the Pacific coast and the communities that inhabit this region benefit from them 2.
The results obtained in this study, using the COI gene as genetic marker, are the first reports on the genetic diversity for A. tuberculosa; therefore, the results obtained were analyzed by comparison with studies on other bivalves.
The haplotype diversity found for A. tuberculosa in this study is lower (H=0.683) and the nucleotide diversity is greater (π=0.040) than those found in another study for Neosarmatium meinerti14. Similarly, for a domesticated mussel Mytilus coruscus, it shows a genetic diversity with the same tendency (H=0.895 and π=0.008), 15. These diversity results indicate a possible population expansion 16; however, more advanced studies are needed to specify this aspect such as metagenomics, epigenomics, proteomics, metabolomics 17.
Although studies report the same relationship between haplotype and nucleotide diversity, Regionieri et al 14 and González et al 16 report values higher than those found for A. tuberculosa in this study (h=0.683). This loss of variability is probably associated with the fishing of this species without any catch restriction by minimum size (1.18), thus avoiding the genetic flow to the next generation. Similarly, this declining trend in genetic diversity may be related to the discharge of large volumes of waste into mangroves, the high water temperatures reported and oil pollution. The genetic diversity observed is the result of the action of the forces of mutation and natural selection, derived from the response of individuals to natural and anthropological environmental changes.
On the other hand, the value of the Fs statistic of Fu reported in this study shows an excess in the number of alleles, as it would be expected from a recent population expansion by linkage or drag. With respect to the analysis of the distribution between pairs of sequences or "Mismatch distribution" carried out in the five study populations as a whole, it showed a unimodal distribution, demonstrating that there is a moderate population expansion and that it is in demographic growth or that it has suffered a recent demographic expansion. The analysis for each population shows only a unimodal distribution for La Tiburonera, and for the other populations (San Jorge, El Pajal, La Playa and Bajito Vaqueria) the distribution is multimodal, suggesting that these populations are unequal and stationary. Multimodal distributions also represent a reduction in the effective size of the population, which leads to a multimodal mismatch, or that populations are in demographic equilibrium after passing through a bottleneck.
In this study, the genetic variation observed between islands (FST=0.04, p≤0.05) evidences the absence of the population structure of this species for the COI gene in the Tumaco cove, values that were also similar to those reported in studies for other mollusks 15,19. On the other hand, the analysis by populations pairs showed no differences between pairs of islands: El Pajal and San Jorge, La Playa and San Jorge, El Pajal and La Tiburonera, Bajito Vaqueria and La Tiburonera, or between Bajito Vaqueria and El Pajal. In this way, the existence of a genetic population is inferred as in the observations made in other countries 18,20.
The analysis also shows that there is a structure between the islands of La Tiburonera and San Jorge, Bajito Vaqueria and San Jorge, La Playa and La Tiburonera, La Playa and El Pajal, as well as between Bajito Vaqueria and La Playa. The FST value between these islands indicates almost identical allelic frequencies and close to zero. This value also indicates that most haplotypes are shared and have similar frequencies 19.
According to the results of the phylogeny, it is possible to observe the formation of heterogeneous groups of individuals from different mangrove islands, asserting that genetic differences between individuals from each island are not explained by geographic distance. However, it is difficult to trace the phylogeny of organisms in the presence of an horizontal gene transfer, with the use of individual genes as markers 21. All contemporary molecules have their own history that goes back to an individual molecular ancestor. But, it is likely that these molecular ancestors were present in different organisms at different times.
In conclusion, this study showed moderately high haplotype diversity (0.683±0.060) when the individuals from each island were treated as one group. Similar values were observed when each island was considered as a population: San Jorge 0.943±0.040, La Tiburonera 0.859±0.063, El Pajal 0.879±0.058, La Playa 0.882±0.052 and Bajito Vaqueria 0.962±0.040 . This shows that, despite the decrease in the density of the population of A. tuberculosa in mangroves, there is no decrease in the values of genetic diversity.
Similarly, the nucleotide diversity reported in general was low for all the islands and equal to 0.040±0.020 and for each island studied: San Jorge 0.013±0.003, La Tiburonera 0.014±0.003, El Pajal 0.096±0.066, La Playa 0.008±0.001 and Bajito Vaqueria 0.103±0.062.
The molecular analysis of variance did not show any genetic structure FST=0.042 (p≤0.05) between islands; therefore, it is considered as a single population with genetic differences within the islands, a fact that is justified by the variation between individuals.
The results obtained from this study generate new knowledge and will serve as comparison parameters for future works aimed at the conservation of A. tuberculosa and will become tools for the optimization of repopulation strategies within the mangroves analyzed in the Tumaco cove.

