


 English (pdf)
 Article in xml format
 Article references
 Send this article by e-mail
 Cited by SciELO
  Cited by Google
  Similars in
SciELO
Similars in
SciELO  Similars in Google
 Permalink
INTRODUCTION
The production of hair sheep in Colombia has traditionally been considered a secondary activity to cattle farming. To achieve an increase in the competitiveness of this sector, it is necessary to incorporate knowledge as a production factor and generate competitive advantages through knowledge management systems that adapt to the conditions of primary production in developing countries such as Colombia 1.
Currently, technology transfer processes are being generated from different places, which are unrelated to the production conditions of the Colombian tropics, so that at a certain moment, they may become obstacles to achieving the much sought-after competitiveness, by generating unplanned undesirable events, instead of real solutions to livestock production 2. The above suggests that it is necessary to deepen the different aspects associated with their production to allow improving productive indexes 1,3. On the other hand, sheep production has characteristics that make this exploitation system profitable in the short term, because sheep are a rustic species, with high fertility, prolificacy and longevity 3.
Based on the above, it is necessary to carry out studies in Colombia that provide a greater knowledge of sheep production. In this sense, the study of growth curves is essential to initiate a selection and genetic improvement program in sheep, destined to increase the precocity of this species 4. These measures have been used by some researchers to describe animal growth 4. Hence, the importance of this research in the evaluation of different non-linear growth models, managed under grazing conditions in the Department of Córdoba, to provide relevant information to producers, for the selection of animals with performance according to the objectives of production.
MATERIALS AND METHODS
Location. This study was conducted in two sheep production systems, located in the municipalities of Montería (Farm 1) and Sahagún (Farm 2). The municipality of Monteria is located at 08°45’ North latitude and 75°53’ West longitude, altitude of 18 meters above sea level, average annual temperature of 28°C, average annual rainfall of 1,225 mm and relative humidity of 80%. The municipality of Sahagún is located at 08°56 ‘North latitude and 75°26’ West longitude, height of 75 masl, average annual temperature 27°C, average annual rainfall of 1,395 mm and relative humidity of 80%.
Management, animals and nutrition. Fifty-five Creole sheep from single births, belonging to two different production systems born from single births between November 2013 and April 2014, were used. Weigh-ins were carried out every 15 days from birth to 6 months of age (since this is the age at which producers market animals for slaughter). Each production system had a JAZ-DINA L150 digital scale with a capacity of 150 kg, to carry out the weighing of the animals, with at least 10 weigh-ins for each animal and a maximum of 13. The animals were managed under grassland grazing conditions of Bothriochloa pertusa, with water and mineral salt availability at will; during the dry season the animals of farm 1 were supplemented with corn silage and grain and those of farm 2 with Pennisetum purpureum silage.
Growth curves. With the weighing data, a database for the study of the growth curves was elaborated by means of the following non-linear regression models:
 Gompertz 5
 Logística 6
 Von Bertalanffy 7
 Brody 8
Where: yt represents the weight of the animal at time t; β0 represents the asymptotic weight of the animal when «t» tends to infinity, it is generally interpreted as a percentage of maturity compared to adult weight; β1 is an adjustment parameter when y ≠ 0 or t ≠ 0; β2 is a maturity index or measure of precocity, expressed as a percentage proportion of the maximum growth compared to the adult weight of the animal, the higher it is, indicates a faster growth rate 9-11.
In addition, the percentage of maturity was calculated at four (M4) and six months (M6) of age and the average age to reach 75 (EM75) and 95% (EM95) maturity, for the Brody model, which was the one that best described the growth of the sheep in the populations studied, according to the following formulas:

Where:
%M= percentage of maturity estimated at 4 or 6 months;
t = time to reach a percentage of maturity (4 or 6 months).
EM= -log((1-%M)/ β1)/ - β2
Where:
EM = estimated age upon reaching 75 or 95% maturity;
%M = expected maturity percentage (75 or 95%).
Statistical analysis. The parameters of the growth curves were estimated using the SAS NLIN procedure 12. For the selection of the best model, the Akaike information criterion (AIC), the Bayesian information criterion (BIC), the coefficient of determination (R2) and the percentage of convergent curves (PCC) were considered. To determine if there was statistical difference between genders and farms for model parameters, percentage of maturity and age at maturity, a variance analysis of was performed using the GML procedure of the SAS. It should be noted that the assumptions of normality and independence of the errors were validated.
RESULTS
Table 1 shows the estimates of parameters β0, β1, β2, R2, AIC, BIC and PCC of the different models studied. All models evaluated had 100% PCC. However, the Brody model presented a lower AIC and BIC compared to the other models, although its R2 was smaller, but met three of the four criteria for model selection. This allows us to affirm that the Brody model fits satisfactorily to the growth of Creole sheep.
Table 1 Estimates of parameters (β0, β1 and β2), R2, AIC, BIC and PCC in the models studied for Creole sheep.
| Model | β 0 | β 1 | β 2 | R 2 | AIC | BIC | PCC |
|---|---|---|---|---|---|---|---|
| Gom-pertz | 25.575 | 2.086 | 0.0109 | 99.44 | 62.48 | 63.98 | 100 |
| Logístico | 23.176 | 5.910 | 0.0175 | 99.27 | 62.46 | 63.96 | 100 |
| Von Berta-lanffy | 27.714 | 0.515 | 0.0087 | 99.47 | 62.49 | 63.98 | 100 |
| Brody | 33.821 | 0.907 | 0.0046 | 98.60 | 57.30 | 58.95 | 100 |
Figure 1 shows the average growth behavior of Creole sheep as per the Brody model, which presented the best fit. The figure was done based on the estimated parameters presented in Table 1 (β0=33.821 ± 13.246, β1=0.907±0.065, β2=0.0046±0.0027).
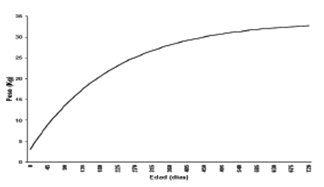
Table 2 shows the average values estimated for the parameters studied, considering gender and farm effects for the Brody model in Creole sheep. There was no significant effect (p>0.05) for gender and farm on parameters β0 and β1, while there was a significant effect (p≤0.05) for gender and farm on parameter β2. There was only a significant effect (p≤0.05) for gender on variables M4, M6, EM75 and EM95.
Table 2 Estimates for the parameters studied, according to the Brody model, as per gender and farm in Creole sheep.
| Effect | β 0 | β 1 | β 2 | M4 | M6 | EM75 | EM95 | |
|---|---|---|---|---|---|---|---|---|
| Sexo | Macho | 37.43 | 0.896 | 0.0059ª | 53.1ª | 64.7ª | 301.3ª | 675.6ª |
| Hembra | 32.35 | 0.926 | 0.0041b | 40.9b | 51.6b | 453.5b | 1001.9b | |
| Finca | 1 | 37.35 | 0.920 | 0.0058ª | 51.5 | 63.4 | 299.5 | 664.5 |
| 2 | 32.44 | 0.903 | 0.0042b | 42.5 | 52.9 | 455.3 | 1013.1 | |
| For a given effect, equal letters in the same column indicate that there was no significant difference (p>0.05) |
Figure 2 and 3 show the behavior of the growth curves, according to gender and farm, using the model proposed by Brody 8. Table 3 shows the percentage of maturity at four (M4) and six (M6) months of age and age at 75 (EM75) and 95% (EM95) maturity for the Brody model in Creole sheep. The percentage of maturity according to the Brody model was 44.9 ± 18.7% at 4 months of age and 55.7±20.6% at 6 months of age. According to this model, the animals reached an average of 75% maturity at 414.2±285.5 days and reached 95% maturity at 920.9±615.6 days.
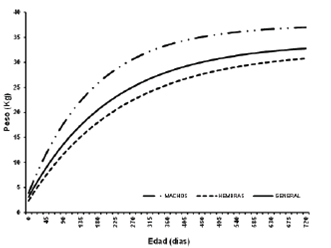
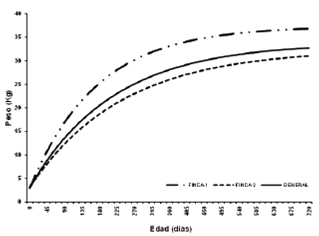
Table 3 Estimated for percentage of maturity and age at maturity in Creole sheep, according to the model proposed by Brody 8
| Variable | Average | Standard deviation |
|---|---|---|
| M4 (%) | 44.9 | 18.7 |
| M6 (%) | 55.7 | 20.6 |
| EM75 (Días) | 414.2 | 285.5 |
| EM95 (Días) | 920.9 | 615.6 |
| M4=% maturity at 4 months; M6=%maturity at 6 months; EM75=Age when reaching 75% maturity; EM95 = Age when reaching 95% maturity. |
DISCUSSION
The results of the growth curves in the present study were similar to those reported by Teixeira et al 13, Gbangboche et al 14 and Bahreini et al 15 in Santa Ines, West African and Baluchi sheep respectively, who studied the Brody, Von Bertalanffy, Richards and Gompertz models, and found that the Brody model was the one that best described growth. While, Lupi et al 16 using the Brody, Von Bertalanffy, Logístico and Gompertz models in sheep of Segureña race, found that the Von Bertalanffy model was the one that best described growth. Ullah et al 17 also reported that the Von Bertalanffy model was the one that best adjusted to the growth curve in sheep.
Oliveira et al 18 and Sarmento et al 11 using the Brody, Von Bertalanffy, Logistic, Gompertz and Richards models to describe growth in Santa Ines sheep, reported the Gompertz model as the best fit. Similarly, Malhado et al 19, when evaluating the same models in sheep (Dorper×Morada Nova, Dorper × Longtail and Dorper × Santa Inés), found that the Gompertz model was the one that best described growth. Keskin et al 20 found that the Quadratic and Gompertz models were the ones that best described the growth of the sheep when evaluating the Quadratic, Cubic, Gompertz and Logistic models in sheep of the Konya Merino breed.
On the other hand, Lambe et al 21, using the Logistic, Gompertz and Richards models to describe growth in the Texel and Scottish Blackface breeds, found that the Richards model presented the best fit. McManus et al 22, used the Brody, Logistic and Richards models in sheep of the Bergamácia race, to describe their growth, being the Logistic model the one they recommended; likewise Daskiran et al 23 when evaluating the Brody, Gompertz, Logistic, Bertalanffy and Negative Exponential models in Turkish Norduz sheep; and Silva et al 24 in San Inés sheep evaluating the Brody, Von Bertalanffy, Logistic, Gompertz and Richards models, found that the Logistic model was the one that best described growth. As is noticed, each specific population has a particular model to describe its growth, since according to the literature consulted, the growth of the same breed can be adjusted to different non-linear models, so that environmental conditions, feeding systems and handling are determinants in the generation of information for the adjustment of the models; without leaving aside the effect of the breed or breeds involved.
The estimated values of (β0=46.84; β1=0.952) in the present study, in Creole sheep, using the Brody model, were superior to those reported by Souza et al 25 (β0 = 28.96; β1=0.88), Sarmento et al 11 (β0 = 27.41; β1 = 0.88) and Hossein-Zadeh and Golshani 26 (β0=27.42; β1 = 0.89), in sheep of the Morada Nova, Santa Inés and Guilan breeds, respectively. The value of (β2=0.00465), in the present study was lower than that reported by Teixeira et al 13 (β1=0.006, Santa Inés), Malhado et al 27 (β1=0.006, Santa Inés × Texel) and Guedes et al 10 (β1 = 0.007, Bergamacia).
Values under those of this study for (β0 = 46.84; β1 = 0.952), using the Brody model in Santa Ines x Creole sheep, were found by Sarmento et al 11 (β0 = 24.8; β1 = 0.479) in Santa sheep Inés, Malhado et al 27 (β0 = 32.16; β1 = 0.489) in Texel × Santa Inés and Silveira et al 28 (β0=34.05; β1=0.477) in Dorper × Santa Inés. The estimated values for β2 by Hossein-Zadeh and Golshani 26 and Texeira et al 29 were higher than those estimated in this study (0.0122 and 0.0119, respectively). Similarly, Souza et al 25 reported lower values for β0 (28.07) and β1 (0.47) and higher for β2 (0.009) in the Morada Nova breed. Lobo et al 30 in Santa Inés females found higher values for β0 (49.98) and β2 (0.00425) and lower values for β1 (0.6) than in the present study.
As the Brody model was the one that best described the growth of Creole sheep. When considering the sex effect, males reached a greater weight and maturity rate during adulthood than females. These results agree with that reported by Sarmento et al 11 and Oliveira et al 18, who found that the sex effect of the animals significantly influenced parameters β0 and β2. The superiority of males compared to females may be related to sexual dimorphism, due to the anabolic effect of testosterone acting as a growth promoter, represented by a higher weight of males in adulthood 18,31. When considering the farm effect, the animals in farm 1 reached a greater weight and maturity rate at adult age than the animals in farm 2, perhaps due to the type of food used, since farm 1 in the dry season is supplemented with corn silage with grain, which is of higher nutritional content than the Pennisetum purpureum silage used in farm 2. In addition, farm 1 is part of the mid Sinu valley, where the soil has better nutritional quality than savannah soils, where farm 2 is located.
In the literature consulted, no information was found on the percentages and age of maturity. When comparing sex and farm effects, males had a higher percentage of maturity at 4 and 6 months of age and a lower age to reach 75 and 95% maturity than females, due to the sexual dimorphism in this species, and that the animals in farm 1 had a higher percentage of maturity at 4 and 6 months of age and a lower age to reach 75 and 95% maturity than the animals in farm 2 (Table 2).
The percentage of maturity at six months is of great importance, since it is the reference in the herds of the region as the appropriate age to slaughter lambs, and females for reproduction. According to the estimated parameters and the age values at maturity and percentage of maturity, the feeding of the animals in the studied production systems must be improved, in order for them to grow faster, that is to say, to achieve greater weight at a younger age. To obtain positive effects, it is necessary to guarantee a constant food supply in the proper amount and a nutritional value that meets the metabolic requirements of the animals 32. In addition, it is necessary to implement a selection program for growth characteristics in sheep meat production systems.
According to the results obtained, the animals from farm 1 have a greater weight at adult age and higher precocity than those from farm 2, because they have higher β0 representing adult weight, and higher β2 which indicates a higher growth rate. The possible explanation for this was mentioned in the previous paragraph.
Animals with higher values of β2, are faster in growth, compared with individuals of lower values of β2 and similar initial weight, so that variations between the values of β2 represent, with fair precision, the variations in the relative speed with which the animal grows 33. This is corroborated by the ages and percentages of maturity in the farms studied (Table 3). Texeitra et al 13, affirm that it is necessary to evaluate all the parameters together to decide which is the best growth curve model applied to a certain production model, so that there is a model of the growth curve that best fits for each production system.
It can be concluded that the Brody model was the one that best adjusted to the growth curve in the Creole sheep of the Colombian tropics. Male animals have a higher percentage of maturity at 4 and 6 months of age and a lower age to reach 75 and 95% maturity than females. In the production systems, the feeding of the animals must be improved in order to achieve a higher growth rate, in order to reach slaughter at a younger age.

