


 text in
  English (pdf)
 Article in xml format
 Article references
 Send this article by e-mail
 Cited by SciELO
  Cited by Google
  Similars in
SciELO
Similars in
SciELO  Similars in Google
 Permalink
INTRODUCTION
Turkeys are of North American origin presumably from Mexico, from which were taken to Europe [1]. Commercial turkey is the result of genetic selection and improved management, whereas turkeys (Meleagris gallopavo) of native or local origin have been maintained unselected and kept mainly under backyard management conditions. Local turkey is an important genetic resource, which needs to be evaluated to identify its advantages and disadvantages for conservation or commercial purposes. Productive performance of those birds as well as the knowledge of their growth curve are important aspects to take decisions on management practices that could improve their productive potential. Some nonlinear models have been used, to describe the change in weight of turkeys as a function of time and a number of parameters that can have a biological interpretation. The most frequent non-linear models used are Brody, von Bertalanffy, Gompertz, Logistic and Richards [2].
These curves start at some fixed point and increase their growth rate up to an inflection point, after which growth rate decreases to asymptotically a final value. In addition, based on the parameters of those growth models, other indicators could be derived, such as, age and weight at the point of inflection [3]. The growth curve of birds could be affected by breed, sex, feeding program and other factors [4,5], thus making important to determine the best model of growth under specific conditions. To the authors knowledge, only one paper have described the growth curve of local turkeys but using Richards non-linear model [6].
The objective of this study was to determine the non-linear model that best fits the growth curve of local turkey kept under confinement in Michoacan, Mexico.
MATERIALS AND METHODS
Animals and management. Sixty-seven local turkeys (24 females and 43 males) were obtained from the mating of 36 local hens and 12 local toms housed at the "Universidad Michoacana de San Nicolas de Hidalgo", in Morelia, Michoacan, Mexico. All birds were individually identified at birth, using numbered wing bands. They were raised on, a deep litter system from hatch to 29 weeks of age. From hatch to week 10, they received a commercial diet with 18% crude protein and 2800 kcal ME and from weeks 11 to 29, 16% crude protein and 2850 kcal ME. Turkeys were given feed and water ad libitium. Each bird was weighed every week from hatch to week 29.
Non-linear models. The non-linear models used to describe the turkeys' growth curves were:
Brody: y= A*(1-b*exp(-k*t))
Gompertz: y= A*exp(-b*exp(-k*t))
Logistic: y= A/(1+b*exp(-k*t)
von Bertalanffy: y= A*(1-b*exp(-k*t)3
Richards: y= A*(1-b*exp(-k*t))m
Where
y = predicted weight at time (t)
A= mature or asymptotic weight
b= integration constant related to hatch weight
k= maturity rate related to maximum growth rate to mature size
t= turkey age
m = shape parameter that determines the time and the weight at inflection point.
The age and weight at inflection point (TI and Wl) were estimated as: ln(b)/k and A/e; ln(b)/k and A/2; and ln(3b)/k and A*8/27 for the Gompertz, Logistic and von Bertalanffy functions, respectively [7]; where e is the base of natural logarithm (2.71828).
Criteria to choose the best model. The best fitting model, which described best the growth curve, was chosen based on three criteria: Multiple determination coefficient R2 = (1-(SSE/SST)), estimated based on the sum of squares of the error (SSE), and the corrected total sum of squares (SST). The Akaike information criterion (AIC), calculated as AIC=N* ln(SSE/N) + (2p+1) and estimated based on SSE, the number of observations (N) and the number of parameters (p) in the model. Finally based on visual analysis of the observed and estimated curves. The model with the lowest AIC value, and the highest R2 was considered the best-fit model.
Statistical procedures and converge criterion. The non-linear (NLIN) procedure with Marquardt iteration algorithm were used for parameter estimation [8]. The convergence criterion was 1.0E-08.
RESULTS
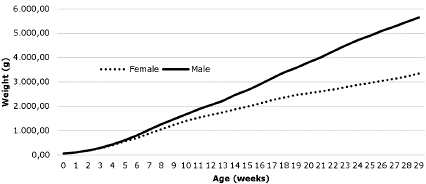
The results of the Brody and Richards' curves are not shown here, because those models fail to converge (no results were provided by SAS). The curves by sex of the observed data are shown in figure 1, where it is clear that males weighted more than females. The non-linear model growth curves and that of the observed body weights for females and males are shown in figures 2 and 3.
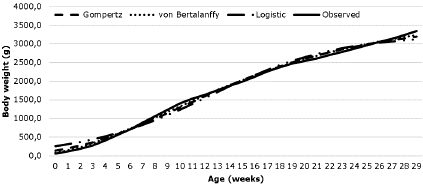
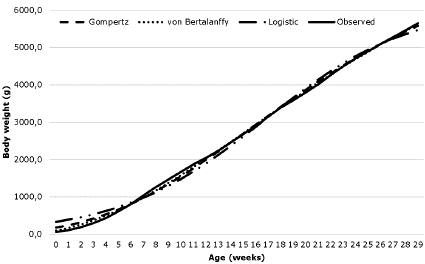
Best fit model. The von Bertalanffy model best fit the data of turkeys in both sexes, followed by the Gompertz and Logistic models (Figures 2 and 3). However, the three models overestimate the hatch weight, being the worse the Logistic model. Looking at the graphs and based on the R2 and AIC criteria, the best fitting chosen was the von Bertalanffy model.
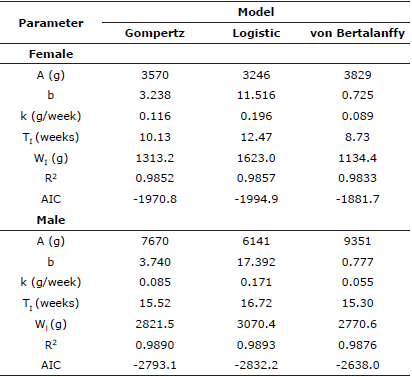
Parameter estimates. Parameter estimates of the growth curve models of male and female local turkeys are shown in table 1. The highest estimates of parameter A (mature weight) for both females and males were obtained with the von Bertalanffy model followed by the Gompertz and the Logistic models. However, the reverse was true for parameter b. The Logistic model estimated the highest k value for both females and males (0.196 and 0.171, respectively) and von Bertalanffy model (0.089 and 0.055) the lowest. The points of inflection of the curves were reached at an early age (Tl) and at a lower weight (Wl) in females than in males, as shown also in table 1.
DISCUSSION
Under the conditions of this study, the von Bertalanffy model was the best model, which indicates that it could be used to describe the growth curve of local turkey reared under confinement and fed commercial diets. These results agree with the findings for commercial turkeys in Mexico [2], using the same five models. However, other authors [3] have found that the Richards model described better the body weight data of Bronze turkeys, compared to the Gompertz, Logistic, and von Bertalanffy models. In turkey hens, it was found [9] that the Morgan model fitted better growth data, followed by the von Bertalanffy and the Gompertz models. Differences between models could be explained, partially, by the species of bird, breed of turkey, feeding program or length of the rearing period studied. For example, some authors studied Large White turkeys between 0 and 18 weeks of age [10]; local Mexican turkeys from 0 to 55 weeks of age [6]; Hybrid Large White turkey hens from 0 to 30 weeks of age [10]; and Bronze turkeys from 11 to 24 weeks of age [3].
The highest values of A in both sexes when the von Bertalanffy model was used, agree with the results reported previously in commercial turkey [2]. In addition, in turkeys, Segul and Kiraz [10] found a low A value with the Logistic model in comparison with the Gompertz model. These results indicate that different models predict different mature body weights in turkeys; thus, the importance of choosing the best model.
Sex differences between estimates of b parameter is probably due to its dependence on the ratio between the weight at hatch and the mature weight in each model, and therefore, it seems to be more influenced by the model used than by the difference between sexes.
The k parameter corresponds to the maturation rate, which is, the growth rate to achieve mature weight from hatch. The higher the k value, the faster the animal achieves its mature weight. Higher asymptotic weight (A) and low k estimates for males as compared to females, indicates that male turkeys matured more slowly and they took more time to reach mature body weight than hens (Table 1). Other authors [10], in Large White turkeys, also obtained the highest k values using the Logistic model (-0.27 and -0.26 for both females and males, respectively) compared with the Gompertz and the Richards models. In female and male bronze turkeys, k values of 0.39 and 0.24 kg/week were obtained, respectively, [4]; whereas, in white commercial turkeys, under tropical conditions values of 0.29 and 0.26 were reported [2].
Independently of the model used, the point of inflection, at which the growth rate was maximum, occurred at an early age (Tl) and at a lower weight (Wl) in females than in males (Table 1). In consequence, under the conditions of the present study, male turkeys reached mature weight at a late age and with heavier body weights than females. These results are similar to those in American Bronze turkeys [3], in local turkeys [6], and in commercial turkey [2]. However, in Large White turkeys, higher A values for females than for males were observed [10] using the Gompertz model, which does not make any biological sense for commercial turkeys. It is known that males are normally heavier than females at maturity. This also means that physiological age is different in males and females, which is a relevant aspect in breeding management. In addition, the knowledge of the growth curve is also of economic importance because, it could be used to determine the optimal age at slaughter and to identify changes in growth rate to adjust feeding diets.
In conclusion, based on R2 and AIC criteria and on the observation of the growth curves, the model that best fitted the data was von Bertalanffy. This information may support decisions relative to the breeding and management of local turkeys.

