


Servicios Personalizados
Revista
Articulo
 texto en
  Inglés (pdf)
 Articulo en XML
 Referencias del artículo
 Enviar articulo por email
Indicadores
-
 Citado por SciELO
 -
 Accesos
Links relacionados
-
 Citado por Google
 -
 Similares en
SciELO
Similares en
SciELO -
 Similares en Google
Compartir

 Permalink
Revista MVZ Córdoba
versión impresa ISSN 0122-0268versión On-line ISSN 1909-0544
Rev.MVZ Cordoba vol.24 no.2 Córdoba mayo/ago. 2019
https://doi.org/10.21897/rmvz.1293
Research article
Expected progeny difference for the weaning weight in crossbred heifers selection in Manabí
1Escuela Superior Politécnica Agropecuaria de Manabí "Manuel Félix López", Carrera de Medicina Veterinaria, Campus Politécnico El Limón, Km 2.7 vía Calceta-El Morro-El Limón, sector El Gramal. Calceta, Manabí, Ecuador.
2Agrícola El Naranjo, Hacienda Napo, San Vicente, Km 5 vía a Canoa, San Vicente, Manabí, Ecuador.
3Universidad Laica "Eloy Alfaro" de Manabí, Extensión Chone, Facultad de Ciencias Agropecuarias, Carrera de Ingeniería Agropecuaria, Av. Eloy Alfaro, Chone, Manabí, Ecuador
4Escuela Superior Politécnica de Chimborazo, Facultad de Ciencias, Escuela de Matemáticas y Estadística, Km 1.5 Panamericana Sur, Riobamba, Chimborazo, Ecuador.
Objective.
Determine the progeny difference expected (DEP) for the weaning weight adjusted to 205 days (PD) in crossbreed Brahman females born in 2016 as selection criteria for future breeders.
Materials and methods.
It is analyzed 3467 records generated between 1983 and 2016 in the Napo farm (San Vicente, Manabí, Ecuador). The statistical model included the random effect of the father and as fixed effects: breed composition, sex and year of birth. The variance analysis was performed using the GLM procedure of the SAS statistical package. The components of the variance between and within the father to calculate the heritability (h2) of the PD and the breeding values, the MTDFRELM software was used, applying the animal model, through the evaluation system of the Best Linear Unbiased Predictor (BLUP).
Results.
It was found that the PD average for the 349 females born in 2016 was 173.67±34.23 kg. A highly significant difference (p<0.01) was found for the random and fixed effects. The h2 for PD was 0.13±0.04. The DEP fluctuated between -6.13 and +5.58 kg with a range between the breeding values of 11.71 kg and an accuracy between 0.50 and 0.72.
Conclusion.
The low h2 found for PD shows the high influence of non-genetic factors; it is necessary to identify the best crossbreed that adapts to the livestock in order to obtain high performance products in the PD.
Keywords: Breeding value; cattle; crossing; heritability (Source: Agrovoc)
Objetivo.
Determinar la diferencia esperada de la progenie (DEP) para el peso al destete ajustado a 205 días (PD) en hembras Brahman mestizas nacidas en el año 2016 como criterio de selección de futuras reproductoras.
Materiales y métodos.
Se analizaron 3467 registros generados entre 1983 y 2016 en la hacienda Napo (San Vicente, Manabí, Ecuador). El modelo estadístico y animal incluyó el efecto aleatorio del padre y como efectos fijos: composición racial, sexo y año de nacimiento. El análisis de la varianza fue realizado mediante el procedimiento GLM del paquete estadístico SAS. Los componentes de la varianza entre y dentro de padre para calcular la heredabilidad (h2) del PD y los valores de cría, se utilizó el software MTDFRELM, a través del sistema de evaluación del Mejor Predictor Lineal Insesgado (BLUP).
Resultados.
Para las 349 hembras nacidas en 2016 se encontró un promedio para PD de 173.67±34.23 kg. Se halló diferencia altamente significativa (p<0.01) para los efectos aleatorios y fijos, h2 para PD de 0.13 ± 0.04 y las DEP variaron entre -6.13 y +5.58 kg con rango entre los valores de cría de 11.71 kg y una exactitud entre 0.50 y 0.72.
Conclusión.
La baja h2 encontrada para PD manifiesta la alta influencia de los factores no genéticos, sin embargo las hembras con mayor valor DEP pueden mejorar el desempeno en este parámetro; se hace necesario identificar el mejor cruce racial que se adapte a la explotación con el fin de obtener crías con alto rendimiento en el PD.
Palabras clave: Bovinos; cruzamiento; heredabilidad; valor genético (Fuente: Agrovoc)
INTRODUCTION
The National Institute of Statistics and Census 1, indicates that the cattle population in the Manabí province is 896,479 heads, which represent 21.39% of the national level, occupying the first place in this census. Experience of livestock producers, especially in the Coastal region, shows that the production of beef cattle as an activity has been losing terrain where their competitiveness and sustainability is under discussion; since 2010 the government has been realizing some oriented investments in the potentialization of the beef cattle sector 2.
The production of beef cattle in the majority of farms in the Ecuadorian tropic, is characterized by limited or little use of genealogical, productive and reproductive records, which conditions the estimation of genetic parameters, restricting the genetic progress of holdings; a visual distinction is usually made to the animals individually or in groups, selecting the specimens that will be part of the herd, providing very little guidance since the animal is selected by phenotype, not by genotype. With the indicated, it becomes necessary to use some mathematical models, which allow to separate the genetic effects of non-genetic to perform the valorisation, the same can also be estimated through the information of the same individual, family member and/or sons 3.
The expected difference of the progeny (DEP) is the genetic prediction that can be used for whatever animal traits, which in turn, it can be measured accurately, they are also considered as the deviation of a specific base value for each breed and with it is possible to predict the genetic value of each individual (genetic merit) 4, given that the differences in the DEP allows to incorporate into the herd of selected animals for their high genetic value and economical productive traits which they wish to improve in the function of decisions that every breeder considers according to the production objectives.
The objective was to predict the DEP for the weaning weight adjusted to 205 days (PD) for the born crossbreed females in 2016 and use this information as a criterion for selecting them.
MATERIALS Y METHODS
Location. The analyzed information was collected on the Napo farm, attached to the company "Agrícola El Naranjo", located in San Vicente county, (Manabí-Ecuador).
Experimental site. The agro-ecological character of the dry tropical premontane forest, with an average annual temperature of 27°C and rainfall intensity of 700 mm per year. The explotation has a size of 1019 hectares, of which 54% is dedicated to livestock, with compound pastures mainly of Panicum maximum, which rotate every 8 days; the topography of the productive area is distributed 22% in flat paddocks and 78% in soft hills with an inclination of 30% approximately.
Animals. We analyzed 3467 weaning weight records between 1983 and 2016, from the individual records of the animals that were admitted to the InterHerd software 5, implemented on the farm in 1999. Most of these records did not have the information of the father, considering this limitation, the 30 breeding males that were included in the analyzed records were analyzed, the same ones that transmitted their genetic potential through artificial insemination, the rest was the product of inseminations or direct riding with pure bulls and mestizos that they did not appear in the records.
We found 266 racial compositions with Brahman (BR) based crossed with Senepol (SE), Red Angus (AR), Nellore (NE), Red Swedish (RS), Brown Swiss (PS), Gyr (GY), Holstein Friesian (HO), Jersey (JE), Charolais (CH), piamontesa (PM), chianina (CI), limousin (LM) and Simmental (SI), all in different proportions between two and five distinct breeds per animal. The particularities that are included in a database have been created in Microsoft Excel 2016. The weights at the end were adjusted to 205 days, using the formula suggested by Silva et al 6 in Charolais.
Statistic Analysis. The analysis of the variance of fixed and random effects that intervene in the PD realized through the GLM process of the SAS statistic model v9.4 (2013). In this model the random effect of the bull and the fixed effects of the contemporary groups were included in which they considered the breed composition, sex, age and year of birth of each individual using the following model:
Yijklm=μ + Ai + Bj + Ck + Dl + eijklm
Yijklm=Adjusted weight of offspring at 205 days of age (kg);
μ = General average weight at weaning (kg);
Ai = Effect of the i-th bull (30 bulls), i = 1...30;
Bj = Effect of the j-th breed composition (266 breed proportions with brahman base), j=1.266;
Ck = Effect of the k-th sex of the calf (female, male), k=1, 2;
Dl = Effect of the l-th year of birth (from 1983 till 2016) l=1.34;
eijklm = Residual effect.
Estimate of the DEP. To estimate the heritability (h2) of the PD and the breeding value of the herd for the mentioned trait of the 349 females that were born in 2016, they ran the data in the MTDFRELM software applying the animal model, considering the contemporary groups in function of breed composition, sex and year of birth of each individual as a fixed effect and as a random effect the additive genetic effects through the evaluation system of the Best Linear Predictor (BLUP) 7. The model was the following:
Y=Xb+Za+e
Y = Vector of the adjusted weight records of the offspring at 205 days of age (kg).
b = Vector of fixed effects including contemporary groups defined by the combination of breed composition, sex and year of birth.
a = Vector of the direct additive genetic random effects.
X, Z = Incidence matrix that relate the observations in Y with the respective effects.
e = Vector of random residual.
Once the values of the DEP were found, the females born in 2016 with the highest value in the DEP are listed, which will serve to form the elite genetic group.
RESULTS
Performance. In the analysis of the variance for the PD and highly significant differences were found (p<0.01) in all sources of variation (father, breed, sex and year of birth), as can be seen in Table 1. The total average historical between 1983 and 2016 for the PD was 149.16±26.70 kg and for the 349 females born in the year 2016 was 173.67±34.23 kg, far exceeding the latter by 24.51 kg to the total average.
Table 1 Variance analysis for the adjusted weaning weight at 205 days.
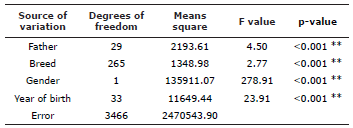
** Highly significant difference (p<0.01)
DEP per animal. The h2 for the mentioned traits in this investigation was 0.13±0.04. The absolute and relative frequencies of the DEP for the animals evaluated in 2016, 41.49% of the females born in that year, presented a breeding value between +0.38 and +5.58 kg varying between 0.52 and 0.72 of accuracy with an average of 0.70 and the remaining 58.51% presented genetic values between -6.13 and +0.38 kg varying between 0.50 and 0.72 with an average of 0.69 of accuracy in the DEP values (Table 2).
Table 2 Frequency of the expected differences of the progeny of the animals analyzed.
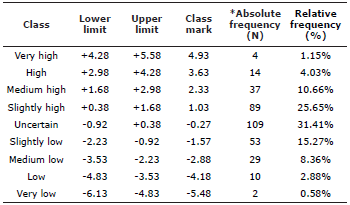
*Number of females born in the year 2016.
The highest frequency (31.41%) corresponds to animals with breeding values between -0.92 and +0.38 kg. When also considering the positive values of the uncertain class of DEP, the proportions were redistributed considering the values of breeding from zero, obtaining that 51.59% of the females have positive breeding values and 48.41% presented negative values, maintaining the same averages and maximum and minimum values without redistributing the uncertain class.
DEP per crossbreed. According to breeding values for the 12 most frequent crossbreed of the 349 females born in 2016, it was observed that the cross 50% BR x 50% AR, which represents 5.44% of the female population under study and presented the highest genetic value (+2.70 kg); while the crossbreed 50% BR x 25% SE x 25% AR, which is the most frequent (15.47%), had a genetic value of -2.11 kg, the latter being superior to that of the BR breed that showed a breeding value average of -3.45 and frequented in 9.74% of the females analyzed, as shown in table 3.
Table 3 Breeding value for the 12 most frequent breed compositions of the population analyzed.
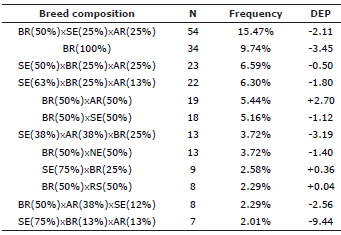
BR= Brahman; SE= Senepol; AR= Red Angus; NE= Nellore; RS= Red Swedish.
In this investigation they also found that the mix 25% BR x 25% SE x 25% AR x 25% HO, presented the highest breeding value (+17.35 kg) and crosbreed 81% SE x 13% AR x 6% BR reached the lowest merit (-34.76 kg). Each of these breeds proportions corresponded to 0.29% of the population of females born in 2016 and considered as the least frequent crosses.
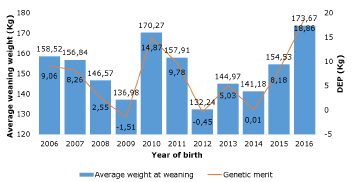
DEP per year of birth. We observed a positive trend in the course of the last 3 years for the increased of genetic merit reaching + 18.86 kg and the average for the PD reached 173.67 kg in 2016 (Figure 1).
DISCUSION
The PD found in this research is superior to those reported by Manzi et al 8 in Rwanda and inferior to those indicated by Vega et al 9 in Mexico and Regatieri et al 10 in Brazil; the average obtained in the PD was affected by a series of non-genetic factors, among which the management system implemented on the farm to feed the animals during periods of drought and genetic factors such as the selection of bulls stands out., cows and heifers, these last two depending on their maternal ability.
The calculation of the h2 is of great importance in the genetic value of the reproducers animals and in the prediction of the selection response 11; The heritability is a own genetic parameter of a population given in a determined time, which means that this varies from population to population and is fundamental for the definition of selection methods and also estimate the relation between the genotype and the phenotype 12. The estimated value of the h2 for PD of this studied herd is higher than the values reported by Espinoza et al 13 in Cebu and Ríos et al cattle 14 in Indubrasil cattle and lower than those analyzed by Montes et al 15, Estrada et al 16 and Crispim et al 17, in Brahman cattle and their crossbreeds.
The estimated value of the h2 (0.13±0.04), indicates that there is a greater environmental effect on this trait depending on the management system that is applied in livestock, by the feeding conditions, and the selection criteria of males and replacement females that were considered at the time as adaptation to the environment and performance in the PD, although the genetic progress will be long term due to the effect of the low value of h2. effect. They are also affected by the restrictions caused by the environmental factor of their own exploitation.14,18.
In the table 2 shows that the DEP for females born in 2016, ranged between -6.13 and +5.58 kg corresponding, respectively, to the females that lower and greater weight will print on their progeny, presenting a range of 11.76 kg, so it is important to record the data of the bulls to complete their productive and reproductive information, identifying and selecting the breeding males with highly positive DEP for the PD, that allows this same to increase for future generations.
In the breeding values for the 12 most frequent crossbreed indicated in table 3, the effect of heterosis is assumed on the whole analyzed, since the crossing between pure breeds or different breeds within this exploitation, elevates the heterosis by exalting the productive traits, animals crossed with European genetics tend to improve these parameters 19, as observed at the crossing 25% BR x 25% SE x 25% AR x 25% HO with a DEP of +17.35 kg.
Considering the results observed in figure 1, in spite of having a low h2 for the present trait, the effect of a good visual, genealogical selection of breeding males and the criteria of breed crossing in the last three years, were superiors in comparison to the previous seven years, so the genetic tendency should be considered, the same one that allows to evaluate the genetic progress in the selection process to redefine selection criteria and objectives, and increase the genetic change of the predicted breeding values 20.
The low h2 found in the PD, explains a very high influence of non-genetic factors, which infers in a slow genetic progress, however, we must consider the high percentage of females with positive breeding values to form the breeding group elite that allow the rethinking of breeding programs for the PD, which will reflect a positive increase in the performance of this trait within the exploitation, so it must be accompanied by a good selection of breeding males and identify the best crossbreed it is adapted to the livestock in order to obtain products with high performance in the PD.
Acknowledgement
To the "Agrícola El Naranjo" company, especially to the Napo farm, for facilitating the information to realize this research. The results of this present work does not reflect the opinion or point of view of the "Agrícola El Naranjo" company
REFERENCES
1. INEC. Instituto Nacional de Estadísticas y Censo. Encuesta de superficie y producción agropecuaria: Ecuador: 2017. [Consultado 16 feb, 2018]. URL Valida en: URL Valida en: http://www.ecuadorencifras.gob.ec/documentos/web-inec/Estadisticas agropecuarias/espac/espac 2017/Informe_Ejecutivo_ESPAC_2017.pdf [ Links ]
2. ESPOL. Estudios industriales, orientación estratégica para la toma de decisiones: Industria de la ganadería de carne. Escuela Superior Politécnica del Litoral: Ecuador: 2016. [Consultado 16 feb, 2018]. URL Valida en: http://www.espae.espol.edu.ec/wp-content/uploads/2016/12/industriaganaderia.pdf [ Links ]
3. Martínez CA, Manrique PC, Elzo MA. La evaluación genética de vacunos: Una percepción histórica. Rev Colomb Cienc Pecu. 2012; 25(2):293-311. http://aprendeenlinea.udea.edu.co/revistas/index.php/rccp/article/view/324760 [ Links ]
4. Madrigal M, Valverde A, Murillo O, Montero W, Munoz B. Asociación entre marcadores genéticos CAPN-1 CAST y características de crecimiento en ganado Brahman en Costa Rica. Rev Agronomía Costarricense. 2018; 42(2):29-42. https://doi.org/10.15517/rac.v42i2.33776 [ Links ]
5. Agricultural Information Management Systems Limited (INTERAGRI). InterHerd Software. Reading, UK: Departament of Agriculture; 1987. [ Links ]
6. Silva A, Martínez JC, Briones F, Castillo SP, Hernández J. Comportamiento productivo de un hato Charolais bajo condiciones de trópico seco en Tamaulipas, México. UDO Agríc. 2013; 13(1):140-145. http://www.bioline.org.br/pdf7cg13017 [ Links ]
7. Boldman, K.; Van Vleck, L. Derivative-Free Restricted Maximum Likelihood Estimation in Animal Model with a Sparse Matrix Solver. J Dairy Sci. 1991; 74(12):4337-4343. https://doi.org/10.3168/jds.s0022-0302(91)78629-3 [ Links ]
8. Manzi M, Junga, JO, Ebong C, Mosi, R0. Factors affecting pre and post-weaning growth of six cattle breed groups at Songa Research station in Rwanda. Livestock Res. Rural Develop. 2012; 24(4):Artículo 68. http://www.lrrd.org/lrrd24/4/manz24068.htm [ Links ]
9. Vega VE, Ríos A, Montano M, Martínez G. Multipe-Breed genetic evaluation of growth traits in Simmental and Simbrah cattle. Trop Subtrop Agroecosyst. 2012; 15(1):403-414. http://www.revista.ccba.uady.mx/ojs/index.php/TSA/article/view/1410 [ Links ]
10. Regatieri IC, Boligon AA, Baldi F, Albuquerque LG. Genetic correlations between mature cows weight and productive and reproductive traits in Nellore cattle. Genet Mol Res. 2012; 11(3):2979-2986. https://doi.org/10.4238/2012.may.10.4 [ Links ]
11. Montes D, Vergara O, Barragán W. Diferencia esperada de la progenie como herramienta de selección para peso al destete en ganado Brahman. Rev MVZ Córdoba. 2011; 16(1):2381-2390. https://doi.org/10.21897/rmvz.297 [ Links ]
12. Ossa G, Suarez M, Pérez J. Efectos del medio y la herencia sobre el peso al destete de terneros de la raza Romosinuano. Rev MVZ Córdoba. 2005; 10(2):673-683. https://doi.org/10.21897/rmvz.443 [ Links ]
13. Espinoza JL, Palacios A, Guerra D, González D, Ortega R, Rodríguez F. Comparación de dos modelos para la estimación de parámetros y valores genéticos del peso en ganado Cebú. Agrociencias. 2008; 42(1):29-36. http://www.colpos.mx/agrocien/Bimestral/2008/ene-feb/art-4.pdf [ Links ]
14. Ríos A, Hernández VD, Villagómez E, Zárate JP, Villagómez JA. Direct and maternal genetic effects for growth traits in Indubrazil cattle. Revista Científica FCV-LUZ. 2013; 23(5):440-447. http://www.saber.ula.ve/bitstream/handle/123456789/37537/articulo10.PDF?sequence=1&isAllowed=y [ Links ]
15. Montes D, Vergara O, Prieto E, Rodríguez A. Estimación de los parámetros genéticos para el peso al nacer y al destete en ganado bovino de la raza Brahman, Rev MVZ Córdoba. 2008; 13(1):1184-1191. https://doi.org/10.21897/rmvz.409 [ Links ]
16. Estrada RJ, Magana JG, Segura JC. Estimation of genetic parameters for preweaning growth traits of Brahman cattle in Southeastern Mexico. Trop Anim Health Prod. 2014; 46(5):771-776. https://doi.org/10.1007/s11250-014-0563-z [ Links ]
17. Crispim AC, Kelly MJ, Guimarães SEF, et al. Multi-Trait GWAS and New Candidate Genes Annotation for Growth Curve Parameters in Brahman Cattle. PLoS ONE. 2015; 10(10):e0139906. https://doi.org/10.1371/journal.pone.0139906 [ Links ]
18. Morales Y, Guerra D, Suárez MA, Rodríguez M, Gonzalez D, Ramos F. Parámetros y tendencia genética en rasgos de crecimiento post destete de machos de la raza Santa Gertrudis. Cuban Journal of Agricultural Science 2013; 47(1):7-12. https://www.redalyc.org/html/1930/193028545002/ [ Links ]
19. Vergara OD, Flórez JM, Hernández MJ, Yaguna CJ, Manco C, Barrios TE, Rico J. Efectos raciales, heterosis y parámetros genéticos para peso al nacer en una población multirracial de ganado de carne en Colombia. Livestock Res. Rural Develop. 2014; 26(3): Artículo 58. http://www.lrrd.org/lrrd26/3/verg26058.html [ Links ]
20. Domínguez J, Rodríguez FA, Núnez R, Ramírez R, Ruiz A. Parámetros genéticos y tendencias genéticas para características de comportamiento en ganaderías de lidia mexicanas. Rev Mex Cienc Pecu. 2014; 5(3):261-271. https://doi.org/10.22319/rmcp.v5i3.3970 [ Links ]
How to cite (Vancouver) Larrea-Izurieta C; Cedeho-Pozo J, Maingón-Navia R, Vera-Loor E, Zambrano-Pinargote L, Condo-Plaza L. Expected progeny difference for the weaning weight in crossbred heifers selection in Manabí. Rev MVZ Cordoba. 2019; 24(2):7193-7197. DOI: https://doi.org/10.21897/rmvz.1293
Creative Commons Attribution 4.0 International License This article is distributed under the terms of the (https://creativecommons.org/licenses/by-sa/4.0/), which permits unrestricted use, distribution, and reproduction in any medium, provided you give appropriate credit to the original author(s) and the source. /
Received: August 01, 2018; Accepted: November 01, 2018; Published: April 01, 2019
 Este es un artículo publicado en acceso abierto bajo una licencia Creative Commons
