


Services on Demand
Journal
Article
 text in
  English (pdf)
 Article in xml format
 Article references
 Send this article by e-mail
Indicators
-
 Cited by SciELO
 -
 Access statistics
Related links
-
 Cited by Google
 -
 Similars in
SciELO
Similars in
SciELO -
 Similars in Google
Share

 Permalink
Revista MVZ Córdoba
Print version ISSN 0122-0268On-line version ISSN 1909-0544
Rev.MVZ Cordoba vol.24 no.2 Córdoba May/Aug. 2019
https://doi.org/10.21897/rmvz.1704
Research article
Genomic Evaluation of Colombian Holstein Cattle Using Imputed Genotypes at Medium Density
1Institución Universitaria Colegio Mayor de Antioquia, Facultad de Ciencias de la Salud, Medellín, Colombia.
2Fundación Universitaria Navarra. Facultad de Ciencias de la Salud, Neiva, Colombia.
3Universidad Nacional de Colombia, Facultad de Ciencias Agrarias, Departamento de Producción Animal, Medellín, Colombia.
Objective.
The goal of this study was to determine the accuracy and bias of direct genomic values (DGV) using imputed genotypes at medium density in yield- and reproduction-related traits for Holstein cattle from Antioquia, Colombia.
Materials and Methods.
A total of 31 animals were genotyped with the Illumina BovineLD chip, 64 with Illumina BovineSNP50v2 and 48 with Illumina BovineHD. Two SNP panels (6K and 40K) were imputed to a density of 44K using the FINDHAP.f90 v4 program. The effects of the SNPs were estimated using the Bayes C method, using low-density (6K) genotypes as well as medium-density imputed genotypes (44_imputed). The accuracy and bias of the DGVs were determined by cross-validation. The evaluated traits were: milk yield (MY), percentage of protein (PP), percentage of fat (PF), somatic cell score (SCS), calving interval (CI) and open days (OD).
Results.
When using the 6K panel, the accuracy values for DGV (rpDGV.EBV) in all the studied traits ranged from 0.19 to 0.24, and the bias (bDGV.EBV) from 0.03 to 0.16. In contrast, using the 44K_imputed panel generated higher accuracy values ranging from 0.24 to 0.33 and a bias ranging from 0.03 to 0.26.
Conclusions.
The accuracy of prediction the DGV was higher with genotypes imputed to medium densities when compared to the accuracy of prediction obtained using low-density genotypes. Therefore, in this study it is concluded that the imputation of genotypes is very useful, because it improves the reliability of the genomic evaluation.
Keywords: Genotyping; genomic selection; single nucleotide polymorphism (Source: CAB; NAL)
Objetivo.
El objetivo de este estudio fue determinar la precisión y el sesgo de predicción de valores genómicos directos (VGD) usando genotipos imputados a densidad media, en características productivas y reproductivas en ganado Holstein de Antioquia, Colombia.
Materiales y métodos.
Fueron genotipificados 31 animales con el chip Illumina BovineLD, 64 con el chip Illumina BovineSNP50v2 y 48 con el chip Illumina BovineHD. La imputación se realizó usando dos paneles de SNPs (6K y 40K) a una densidad 44K, usando el programa FINDHAP.f90 v4. Los efectos de los SNPs fueron estimados mediante el método bayes C, usando genotipos de baja densidad (6K) y genotipos imputados a una densidad media (44_imputado). La precisión y el sesgo de los VGDs fueron determinados mediante validación cruzada. Las características evaluadas fueron: producción de leche (PL), porcentaje de proteína (PRO), porcentaje de grasa (GRA), puntaje de células somáticas (SCS), intervalo entre partos (IEP) y días abiertos (DA).
Resultados.
Las precisiones de VGD (rpVGD.EBV) en todas las características evaluadas oscilaron entre 0.19 y 0.24 y el sesgo (bVGD.EBV) entre 0.03 y 0.16 cuando se usó el panel 6K y usando el panel 44K_imputado las precisiones fueron mayores, oscilado entre 0.24 y 0.33 y sesgo entre 0.03 y 0.26.
Conclusiones.
La precisión de predicción de los VGDs fue mayor cuando se usaron genotipos imputados a densidad media, en comparación con la precisión de predicción obtenida empleando genotipos de baja densidad. Por lo cual, en este estudio se concluye que la imputación de genotipos es muy útil dado que aumenta la confiabilidad de la evaluación genómica.
Palabras clave: Genotipificación; polimorfismo de nucleótido simple; selección genómica (Fuente: CAB; NAL).
INTRODUCTION
Genomic selection (GS) is a methodology that includes thousands of molecular markers that cover the entire genome evenly so that each QTL associated with a particular trait is in linkage disequilibrium with at least one marker 1,2. This methodology combines the information from phenotypes (or pseudophenotypes: EBVs), pedigree and genotype of each animal in order to estimate genomic breeding values (GEBVs), which are the focus of the current genetic improvement schemes 3. This has created new opportunities for a more efficient selection even for traits that have low heritability or are difficult to measure 4,5.
However, the greatest obstacle for the implementation of GS is the cost of animal genotyping, mainly with moderate and high-density chips 4. To reduce genotyping costs, one strategy is to use low-density SNP chips, which can be optimized through imputation processes. Genotyping strategies for imputation generally involve featured animals, mainly males that have been genotyped with high density chips (Illumina SNP50, Illumina BovineHD 800K), young animals (candidates for selection) and cows, using low density chips (Illumina BovineLD) and in some cases non-genotyped individuals 6,7,8. Genotype imputation begins with the reconstruction of the haplotypes carried by the individuals that have been genotyped with high density chips. Low density genotypes were then used in conjunction with pedigree, family linkage and linkage disequilibrium information to determine the combination of haplotypes present in the individuals that had been genotyped with low density chips and thus deduce their genotype until reaching an SNPs density greater than the initial 8.
A number of imputation programs have been proposed: fastPHASE 9, BEAGLE 10, IMPUTE2 11, FINDHAP 12, FImpute 13, etc. All of them use different methods for reconstructing haplotypes, thus their computing times are different. FastPHASE, BEAGLE and IMPUTE2 are slow, as they use Bayesian methods that may be limiting in practice when large amounts of data are used. FINDHAP and FImpute use deterministic methods that are very fast computationally and their imputation accuracies are comparable to those produced by fastPHASE, BEAGLE e IMPUTE2 6,14. Genotype imputation in genetic selection has made it possible to calculate GEBVs in bulls and cows. This has reliability values similar to those obtained when the animals are genotyped with high density chips 6,14. This has favored the implementation of GS in genetic improvement programs, making this methodology more reliable, efficient and less costly 5,15,16.
Although in Colombia there is a high level of technification in specialized dairy cattle, genetic improvement has presented serious difficulties, due to the limited amount of productive records available 17. However, this has not been an impediment to start with the implementation of methodologies that include genomic information in both dairy cattle 18,19, in Creole breeds 20, as well as beef cattle 21. The goal of this research project was to determine the accuracy and bias of direct genomic values (DGV) using genotypes imputed to medium density for yield- and reproduction-related traits for Holstein cattle from Antioquia, Colombia.
MATERIALS AND METHODS
Population. This study was conducted based on the information obtained from 85 dairy Holstein herds located in 18 municipalities from the Department of Antioquia (Colombia) whose forest zones belong to the lower montane wet forest (lmwf) category and have a temperature ranging from 12 to 18°C and an average annual precipitation between 2000 and 4000 mm. They normally cover an altitudinal belt of 1800 to 2800 masl. The animal management, feeding and health conditions varied for every herd. This was also true for their topography and location.
The number of records used for the analyses varied depending on the trait being analyzed: there were 8772, 6624, 6595, 6426, 11562 and 11395 for milk yield (MY), percentage of protein (PP), percentage of fat (PF), somatic cell count (SCC), calving interval (CI) and open days (OD), respectively. The SCC was transformed into a somatic cell score (SCS) through the following equation: SCS=[log2 (RCS/100000)] + 3 in order to improve data normality, as described by Ali and Shook 22. For the conventional genetic evaluation, the number of animals in the pedigree was 9090 (721 fathers and 944 mothers). For the genomic evaluation, this number was 144 (36 bulls and 108 cows).
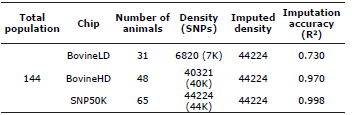
Animal Genotyping Using High Density Chips. A total of 144 animals were genotyped with three Illumina chips (Illumina Inc, San Diego, CA), namely: Bovine LD (31 animals), BovineSNP50 v2 (65 animals) and BovineHD (48 animals). After submitting the genotypes to a quality control process that included the following conditions: call rate >0.90, minor allele frequency (MAF) >0.02, Hardy Weinberg equilibrium p>0.001 and discarding of markers with Mendelian errors, a total of 6716 markers were obtained that were common to the three chips, their density was labeled 6K. Genotype editing was performed using SAS v9.2 (SAS Institute Inc., Cary, E.E.U.U.) and PLINK v1.07 (CHGR., Massachusetts, E.E.U.U.) programs.
Genotype Imputation. To obtain the database containing the imputed genotypes, 6820 SNPs (panel 7K) from the LD chip were selected together with 40321 SNPs (panel 40K) from the HD chip. These SNPs were common to the SNP50v2 chip. In addition, panels 7K and 40K were imputed to 44224 SNPs (panel 44K_imputed). The SNPs were defined as discrete genotypes (0, 1 and 2), thus they were recoded as: BB=0 (homozygous for the first allele), AB=1 (heterozygous), AA=2 (homozygous for the second allele), B_=3 (known paternal allele and unknown maternal allele), _A=4 (unknown paternal allele and known maternal allele) and 5 when both alleles are unknown. The SNPs were sorted by number of chromosomes and by location in the chromosome while taking into account the UMD3.1 assembly of the bovine genome. The pedigree of the 144 genotyped animals, which corresponded to 761 individuals, was included in the analysis in order to improve imputation accuracy.
The accuracy of the imputations was determined by comparing the imputed genotypes (IG) with the true genotypes (TG) (i.e. genotypes obtained with the SNP50v2 chip), using the Pearson correlation (rTG;IG). The imputation process was carried out using the FINDHAP. f90 version 4 program (USDA., Beltsville, E.E.U.U.).
Estimation of the Effects of the Markers and Direct Genomic Values. The effects of SNPs were estimated using the Bayes C method 23. The general statistical model was described as:
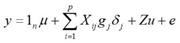
Where: y is the vector of phenotypic values corrected by fixed effects (which corresponds to the conventional EBVs obtained through the BLUP method) for the following traits: MY, SCS, PP, PF, OD and CI; μ is the general mean; 1 n is the vector of ones with a length of n; X ij is the column vector representing the covariable of the marker (SNP) in locus j for animal i. For each j th marker, there are three possible combinations with two alleles (A or B): homozygous with an allele (BB), heterozygous (AB) and homozygous with the other allele (AA). These combinations of alleles (genotypes) are quantitatively represented as 0, 1 and 2 respectively (i.e. X ij = 0, 1 or 2), g j is the random effect of allelic substitution for marker j, which is conditional on σ 2 g and is assumed to have a normal distribution N~(0, σ 2 g) when δ j=1, but gj=0 when δ j=0. δ j it is a 0/1 random variable indicating the absence (with a likelihood of ϖ) or presence (with a likelihood of 1- ϖ) of the j locus in the model; u is the vector of polygenic random effects with a length of n (Z being the associated design matrix) and was considered as the fit of the genes that were not taken into account by the effects of the j th SNPs in g; u is assumed to have a normal distribution, u ~ N(0, A σ 2 u ), where A is the relationship matrix derived from the pedigree of the genotyped animals, e is the residual, also assumed to have a normal distribution, e ~ N(0, I σ 2 e), where I is an nxn identity matrix.
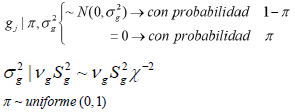
Thus, the Bayes C method assumes a mixture of two distributions for the effects of the SNPs. In the first distribution, (whose likelihood is π) it is established that many markers do not have any effect or variance; in the second, (whose likelihood is 1- ϖ) there are markers with effect and a variance that is common to all SNPs 24.
Thus, the effects of the SNPs (gj) follow an a priori normal distribution with a mean of zero and a variance of (σ 2 g), whereas the variance of the effects of the markers (σ 2 g) follow an a priori scaled inverse chi-squared distribution with parameters vg (degrees of freedom) and S2 g (scale parameter). On the other hand, n is treated as a uniform a priori distribution whose mean is zero and its variance 1 24, as described in the following paragraphs:
The DGV of the animals with a known genotype was determined as:
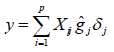
Where:

corresponds to the sum of all the effects of the estimated SNPs (ĝ j). The program used for estimating the effects of the SNPs and the DGVs was GS3 (INRA., Toulouse, Francia).
Cross-validation. The accuracy of the genomic selection was determined by cross-validation as described by Meuwissen et al. 25. The complete database, which corresponds to 144 animals with known phenotypes and genotypes was split randomly into S=12 equally sized groups (S1-S12). In the first stage, S1 was the validation group; animals in this group had genotype but no phenotype as it had been removed from the database (masked phenotype = 0). Groups S2 through S12 were used as a reference (i.e. they had both phenotype and genotype) to estimate the effects of the SNPs. For S1 the DGVs of the 12 animals in the group were estimated using the effects of the SNPs estimated for the 132 remaining animals (S2-S12). This was repeated for all groups. At the end, the DGVs were estimated for all animals.
Accuracy and Bias of the predicted DGV. The DGVs estimated using the Bayes C method were compared with the conventional (EBV) through Pearson correlation, which was in turn considered as the accuracy of the genomic selection 26. The equation appears as follows:


Where, rp = Pearson correlation coefficient, x=DGV for trait i, y = conventional EBV for trait i. Similarly, Spearman's rank correlation coefficient was also estimated. This coefficient was used to determine the degree of similarity between the rankings of the animals according to their genomic values (DGV or GEBV) and according to their conventional EBV.
The equation utilized was described as:
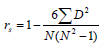
Where:
D = difference between the corresponding genetic values of order (x-y), x = DGV, y = conventional EBV, N=number of pairs (x,y) and rs = Spearman's correlation coefficient. A correlation value of 1 indicates that ranking the animals based on their genetic values (DGV or conventional EBV) produces similar results.
Finally, the linear regression coefficient of the conventional EBVs on the DGVs (bDGV.EBV) was determined. The bDGV.EBV was considered as a bias for the prediction of DGV. The linear regression was defined as:
Where yi = dependent variable corresponding to the conventional EBV for trait i; xi = DGV for trait i; b1 = regression coefficient of the conventional EBV on the DGV; b0 = intercept and e = residual.
RESULTS
Descriptive Analysis for Yield-and Reproduction-related traits. The averages for the following reproduction- and yield-related traits were determined: CI and OD (Table 1), MY, PP, PF and SCS. These are normal results for the Holstein breed under the conditions of the colombian high tropics. On the other hand, the heritability estimated by the conventional genetic evaluation for yield-related traits (PF, PP, MY and SCS) was moderate as its values were 0.33, 0.41, 0.30 and 0.27 respectively; in contrast, this value was low for the reproduction-related traits, CI and OD, as the value was 0.11 for both cases.
Table 1 Descriptive analysis for yield- and reproduction-related traits of Holstein cattle from Antioquia, Colombia.
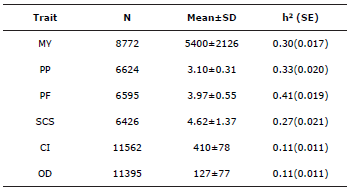
MY - milk yield (in Liters/lactation), PF - percentage of fat, PP - percentage of protein, SCS - somatic cell score, CI - calving interval, OD - open days, N - number of records, SD - standard deviation, h2 -heritability, SE -Standard error.
Imputation Accuracy. The 7K database, composed of 31 animals was imputed to 44K, obtaining an accuracy of 0.73. Similarly, the 40K database, composed of 48 animals, was imputed to 44K with an accuracy of 0.97 (Table 2).
Descriptive Analysis for Marker Effects. The effects of the SNPs were estimated for all the traits included in the analysis (e.g. MY, PP, PF, SCS, CI and OD) using low-density genotypes (6K) and imputed genotypes (44K_imputed). In addition, when comparing the effects of the SNPs obtained with the 6K database with those obtained with the 44K_imputed database, the researchers observed that the 6K database produced higher effects (Table 3).
Table 3 Descriptive statistical analysis of the effects of the SNPs for yield and reproduction traits in Holstein cattle from Antioquia, Colombia.
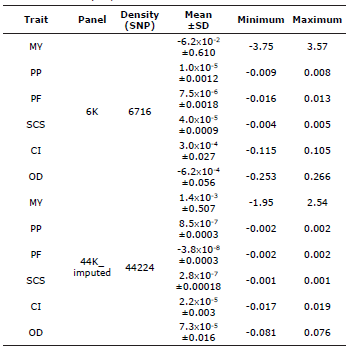
MY - milk yield (in Liters/lactation), PF - percentage of fat, PP - percentage of protein, SCS - somatic cell score, CI - calving interval, OD - open days, SD - standard deviation.
Accuracy of the Direct Genomic Values. The values for genomic accuracy (rpDGV;EBV) ranged from 0.19 to 0.29 when using the 6K genotype database. In contrast, when the 44K_imputed database was used, the values were higher and ranged from 0.24 to 0.33 for all the studied traits. While the correlations obtained were low-both using low- and high-density genotypes-, an increase in the values for accuracy can be observed when the SNPs used have a higher density. This becomes even more evident when the traits have a higher heritability (Table 4).
Table 4 Genomic accuracy of the direct genomic values and Spearman Correlation between DGV and EBV.
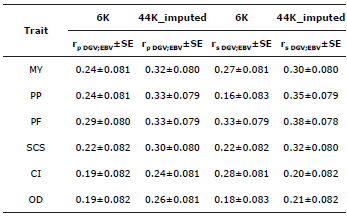
MY - milk yield, PF - percentage of fat, PP - percentage of protein, SCS -somatic cell score, CI - calving interval, OD - open days, rpDGV;EBV - Pearson correlation between DGV and EBV, SE - standard error, rdgvebv - Spearman correlation between DGV and EBV
Likewise, the Spearman correlations (rsDGV;EBV) ranged from 0.16 to 0.33 when using the 6K database. When using imputed data (44_imputed), in turn, these correlations were higher, and their values ranged from 0.30 to 0.35, except for CI, which had a value of 0.20 (Table 4).
The regression coefficients (bDGV.EBV) obtained for MY, PP, PF, SCS, CI and OD were low: 0.16, 0.03, 0.11 and 0.11 respectively when using the 6K, database. In addition, the only coefficients that were higher when using the 44K_imputed database were MY, PP, PF and SCS; their values were 0.26, 0.12, 0.20 and 0.16 respectively. For CI and OD, no significant changes were observed, the values being 0.03 and 0.04 respectively (Table 5).
Table 5 Prediction bias of the conventional EBVs for yield- and reproduction-related traits of Holstein cattle from Antioquia, Colombia.
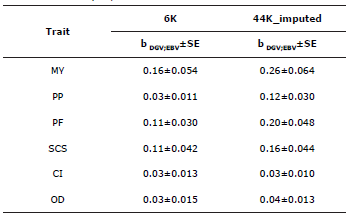
MY - milk yield, PF - percentage of fat, PP - percentage of protein, SCS -somatic cell score, CI - calving interval, OD - open days, bDGV;EBV - regression coefficient for the conventional EBV over the DGV (prediction bias).
DISCUSSION
In this study, genotype imputation accuracy was determined using the findhap.f90 program. The values obtained were 0.97 when imputing from 40K to 44K, and 0.73 when imputing genotypes of 6K to 44K. Khatkar et al (6), determined imputation accuracy using the IMPUTE2, Beagle and fastphase programs with values of 0.8983, 0.8595, and 0.7630 when imputing genotypes from 3K to 50K. Additionally, they obtained values of 0.9731, 0.9597 and 0.9626 when imputing genotypes from 35K to 50K respectively for each program. Their reference population was composed of 136 animals. Moreover, when the reference population was of 27 animals, the values for imputation accuracy were lower, namely: 0.8160, 0.6598 and 0.7409 when imputing from 3K to 50K, and 0.9229, 0.8543 and 0.9351 when imputing from 35K to 50K. In another study, Chen et al (26), determined the imputation accuracy values for the densities of SNPs, namely: 6K, 3K, 1536SNP, 768SNP and 384SNP, when imputed to 50K, using the FImpute2 program. The accuracy values were: 0.9723, 0.9367, 0.9120, 0.8285 and 0.7210 respectively for each density. In that study, the authors included 2046 animals in the reference population (50K genotypes). These results are consistent with ours and suggest that, in all cases, the number of animals in the reference population and the density of the markers are factors that significantly affect imputation accuracy.
Furthermore, using panels with high SNP density may increase the accuracy of the genomic selection to a much greater extent than using low density panels (6,27). However, genotyping animals with high density chips is a much more expensive strategy, thus it is necessary to use imputed data in order to improve the prediction of genomic values. In our study, low density genotypes (6K) were used together with imputed genotypes (44K_ imputed), on which accuracy and (rpDGV;EBV) prediction bias (bDGV;EBV), were determined for six traits of economic relevance (MY, PP, PF, SCS, CI and OD). The average prediction accuracy value for DGV was 0.23 when using the 6K panel and 0.30 when using the 44K_imputed panel.
Khatkar et al (6), also determined DGV accuracy in a validation population of 452 bulls using the effects of the SNPs from a reference population of 1753 animals. Accuracy was calculated using the following genotypes: LD, 50K_imputed and 800K_imputed. The accuracy values for MY (h2 =0.25) were: 0.481, 0.546 and 0.558. For fertility (h2=0.04), they were lower: 0.232, 0.246 and 0.256 respectively for each density. The results suggest that the accuracy values obtained using the 800K_imputed density were higher than those obtained for the 50K_imputed and LD panels. On the other hand, Chen et al (26), determined better accuracy values when using panels with higher SNP densities for MY and PP. For MY, the accuracy values were: 0.64 (50K), 0.61 (3K), 0.58 (L1536), 0.52 (L768) and 0.42 (L384). For PP, the accuracy values were: 0.76 (50K), 0.72 (3K), 0.59 (L1536), 0.51 (L768) and 0.34 (L384).
In our study, the accuracy values obtained were 0.24 and 0.32 for MY, 0.34 and 0.33 for PP, 0.19 and 0.24 for CI and 0.19 and 0.26 for OD when using the 6K and 44K panels respectively. In the study conducted by Chen et al (26), an average accuracy increases of 7 points when they moved from 1536 to 6177 SNPs. Likewise, the increase reached 7.8 points when going from 1536 to 35790 SNPs for four traits evaluated (MY, PP, PF and SCS). In our study, an average accuracy of 6.8 points was determined for the same traits (MY, PP, PF and SCS), when going from the 6K panel to the 44K_imputed panel, this indicates that marker density plays a key role in the accuracy of genomic prediction for traits with high and low heritability. This also shows the importance of using a moderate or high-density chip and/or performing genotype imputation. The explanation for this increase in the accuracy of DGV prediction lies in the fact that a panel with more SNPs makes it possible to cover a broader region of the genome and thus capture a higher number of QTLs involved in the expression of the quantitative traits.
In our research, the DGV prediction accuracy values for PP and PF were equal, and had a value of 0.33 for the two traits when using the 44K panel. Similarly, Chen et al (26), determined the DGV prediction accuracy using a 50K panel for PP and PF and obtained values of 0.75 and 0.76 respectively. In both studies PP and PF have a similar genetic architecture, that is, there are few QTLs with a great effect. This contrasts with SCS, where there are many QTLs with a small effect. Now, the difference between the accuracy values reported by the two studies is associated with the size of the reference population. A total of 132 animals were used in our study, whereas Chen et al (26) used 10309. Furthermore, the methodologies used were different: their study used Bayes B and ours used Bayes C. In the case of Bayes B, each SNP has a specific locus variance. In Bayes C, on the other hand, variance is common to all SNPs (23).
Habier et al (28), determined the GEBV prediction accuracy in 113 young Holstein bulls using the effects of 40764 SNPs estimated in a reference population of 4000 animals. The accuracy values obtained (rpGEBV;DEBV) for MY and SCS were 0.46 and 0.18 when using the Bayes A method, 0.41 and 0.12 when using the Bayes B method, and 0.43 and 0.15 with the Bayes Cpi. For traits with low heritability such as SCS, many QTL with small effects cannot be detected, since the linkage disequilibrium between the markers and the QTLs might be too low. For this reason, higher marker density is required. Additionally, it has not yet been possible to use a 50K panel to capture 100% of the genetic variance in all the traits evaluated for dairy cattle. The maximum value that has been captured ranges from 90% for MY, to 32% for fertility-related traits (28).
In another study, Hayes et al (29), determined the reliability (defined through the rGEBV.EBV/rEBV.TEBV ratio) of genomic values in young animals using the Bayes A method for PP and fertility with a reference population of 332 bulls, based on which the effects of 38259 SNPs were estimated. The reliability value was 0.36 for PP and 0.14 for fertility. On the other hand, Nicolazzi et al (30) determined the prediction accuracy of genomic values (rABV,DGV), using Bayes A and Bayes LASSO-gamma methods for protein yield (PY) and PF with a validation population of 386 bulls, using the effects of 39048 SNPs estimated in a reference population of 763 Holstein-Friesian bulls. The prediction accuracies obtained for PY were 0.52 and 0.48 respectively for each method, while for PF the values were 0.75 and 0.71 respectively. The authors suggest that la prediction accuracy is better for PF, since this trait is explained in more than 30% by mutations in the DGAT1 and GHR genes, indicating that PF is a trait more inheritable than PY. Colombani et al (31), also determined the accuracy and bias of genomic values in the Holstein (2976 bulls in the reference population) and Montbéliarde (950 bulls in the reference population) breeds using the Bayes Cpi. method The SNPs assessed were 38462 for Montbéliarde and 39738 for Holstein. The accuracy values for MY, PF and conception rate (CR) were: 0.57, 0.80 and 0.34 for the Holstein breed and 0.44, 0.62 and 0.43 respectively for the Montbéliarde breed. The regression coefficients (prediction bias) were: 0.73, 0.90 and 0.72 for Holstein and 0.74, 0.85 and 1.35 for the Montbéliarde breed.
In our study, the accuracy values obtained for PP and PF were higher (0.33 in both cases) when compared with those obtained for OD and CI, which were 0.24 and 0.26 respectively. Likewise, the regression coefficient was higher for PP and PF (0.12 and 0.20) when compared with CI and OD, which had values of 0.03 and 0.04 respectively. These coefficients were less than 1 (b<1) in all cases, which indicates that the DGVs were overestimated with respect to the conventional EBVs; this in turn suggests inflation of the genetic variance in all the studied traits. Hayes et al (29), state that the reliability of the GEBVs for fertility was low in comparison to the value for PP, considering the strong difference in heritability among the studied traits. They then suggest that a higher amount of records for reproduction-related traits is required in the initial experiments in order to obtain more reliable GEBVs and thus achieve a more efficient genomic selection.
Finally, it must be considered than in this study, we estimated the effects of the markers on a small reference population, therefore the accuracy values and the regression coefficients were low when compared with the results of the research conducted by the previously mentioned authors. Therefore, it is important to clarify that this study shows the initial results of genomic evaluations for economically relevant traits with high and low heritability in the Colombian high tropic. Nevertheless, it is necessary to increase the number of genotyped animals and SNPs to consolidate a reference population from which genomic evaluations can be made more accurately.
Acknowledgements
Sincere thanks to the National University from Colombia - Host Medellin, COLANTA LTDA Cooperative and the Ministry of Agriculture and Rural Development of the government of Colombia for financing of this research.
REFERENCES
1. Goddard ME, Hayes BJ. Genomic Selection. J Anim Breed Genet. 2007; 124(6):323-330. https://doi.org/10.1111/j.1439-0388.2007.00702.x [ Links ]
2. Wang L, Zhu G, Johnson W, Kher M. Three new approaches to genomic selection. Plant Breeding. 2018;137(5):673-681. https://doi.org/10.1111/pbr.12640 [ Links ]
3. Meuwissen TH, Hayes BJ, Goddard ME: Prediction of total genetic value using genome-wide dense marker maps. Genetics. 2001; 157(4):1819-1829. https://www.ncbi.nlm.nih.gov/pubmed/11290733 [ Links ]
4. Boichard D, Chung H, Dassonneville R, David X, Eggen A, Fritz S. et al. Design of a bovine low-density SNP array optimized for imputation. PLoS ONE. 2012; 7(3):e34130. https://doi.org/10.1371/journal.pone.0034130 [ Links ]
5. Weng Z, Zhang Z, Ding X, Fu W, Ma P, Wang C, Zhang Q. Application of imputation methods to genomic selection in Chinese Holstein cattle. J Anim Sci Biotechnol. 2012, 3(1):6. https://doi.org/10.1186/2049-1891-3-6 [ Links ]
6. Khatkar MS, Moser G, Hayes BJ, Raadsma HW. Strategies and utility of imputed SNP genotypes for genomic analysis in dairy cattle. BMC Genomics. 2012; 13(1):538. https://doi.org/10.1186/1471-2164-13-538 [ Links ]
7. Schefers J, Weigel KA. Genomic selection in dairy cattle: Integration of DNA testing into breeding programs. Anim Front. 2012; 12(1):4-9. https://doi.org/10.2527/af.2011-0032 [ Links ]
8. Huang YJ, Hickey JM, Cleveland MA, Maltecca C. Assessment of alternative genotyping strategies to maximize imputation accuracy at minimal cost. Genet Sel Evol. 2012; 44(1):25. https://doi.org/10.1186/1297-9686-44-25 [ Links ]
9. Scheet P, Stephens M. A fast and flexible statistical model for large-scale population genotype data: Applications to inferring missing genotypes and haplotypic phase. Am J Hum Genet. 2006; 78(4):629-644. https://doi.org/10.1086/502802 [ Links ]
10. Browning BL, Browning SR. A unified approach to genotype imputation and haplotype phase inference for large data sets of trios and unrelated individuals. Am J Hum Genet. 2009; 84(2):210-223. https://doi.org/10.1016/j.ajhg.2009.01.005 [ Links ]
11. Howie BN, Donnelly P, Marchini J. A flexible and accurate genotype imputation method for the next generation of genome-wide association studies. PLoS Genet. 2009; 5(6):e1000529. https://doi.org/10.1371/journal.pgen.1000529 [ Links ]
12. VanRaden PM, Null DJ, Sargolzaei M, Wiggans GR, Tooker ME, Cole JB, et al. Genomic imputation and evaluation using high-density Holstein genotypes. J Dairy Sci. 2013; 96(1):668-678. https://doi.org/10.3168/jds.2012-5702 [ Links ]
13. Sargolzaei M, Chesnais JP, Schenkel FS. A new approach for efficient genotype imputation using information from relatives. BMC Genomics. 2014; 15: 478. https://doi.org/10.1186/1471-2164-15-478 [ Links ]
14. Weigel KA, Van Tassell CP, O'Connell JR, VanRaden PM, Wiggans GR. Prediction of unobserved single nucleotide polymorphism genotypes of Jersey cattle using reference panels and population-based imputation algorithms. J Dairy Sci. 2010; 93(5):2229-2238. https://doi.org/10.3168/jds.2009-2849 [ Links ]
15. Zhang Z, Druet T. Marker imputation with low-density marker panels in Dutch Holstein cattle. J Dairy Sci. 2010; 93(11):5487-5494. https://doi.org/10.3168/jds.2010-3501 [ Links ]
16. Wiggans GR, Cole JB, Hubbard SM, Sonstegard TS. Genomic Selection in Dairy Cattle: The USDA Experience. Ann Rev Anim Biosci. 2017; 5(1):309-327. https://doi.org/10.1146/annurev-animal-021815-111422 [ Links ]
17. Rincón JC, Zambrano JC, Echeverri JJ. Estimation of genetic and phenotypic parameters for production traits in Holstein and Jersey from Colombia. Rev MVZ Córdoba. 2015; 20(Supl):4962-4973. https://doi.org/10.21897/rmvz.11 [ Links ]
18. Echeverri J, Zambrano JC, López-Herrera A. Genomic evaluation of Holstein Cattle in Antioquia (Colombia): a case study. Rev Colomb Cienc Pecu. 2014; 27(4):306-314. http://www.scielo.org.co/scielo.php?script=sci arttext&pid =S0120-06902014000400009 [ Links ]
19. Zambrano JC, Rincón JC, López A, Echeverri JJ. Estimation and comparison of conventional and genomic breeding values in Holstein cattle of Antioquia, Colombia. Rev MVZ Córdoba. 2015; 20(3):4739-4753. https://doi.org/10.21897/rmvz.44 [ Links ]
20. Martínez R, Gómez Y, Rocha JFM. Genome-wide association study on growth traits in Colombian creole breeds and crossbreeds with Zebu cattle. Genet Mol Res. 2014; 13(3):6420-6432. https://doi.org/10.4238/2014.august.25.5 [ Links ]
21. Martínez R, Mar JF, Bejarano D, Burgos W. Genomic predictions and accuracy of weight traits in a breeding program for Colombian Zebu Brahman [On line]. Proceedings of the World Congress on Genetics Applied to Livestock Production. 2018. http://www.wcgalp.org/system/files/proceedings/2018/genomic-predictions-and-accuracy-weight-traits-breeding-program-colombian-zebu-brahman.pdf [ Links ]
22. Ali AK, Shook GE. An Optimun transformation for somatic cell concentration in milk. J Dairy Sci. 1980; 63(3):487-490. https://doi.org/10.3168/jds.s0022-0302(80)82959-6 [ Links ]
23. Kizilkaya k, Fernando RL, Garrick DJ. Genomic Prediction of simulated multibreed and purebred performance using observed fifty thousand single nucleotide polymorphism genotypes. J Anim Sci. 2010; 88(2):544-551. https://doi.org/10.2527/jas.2009-2064 [ Links ]
24. Verbyla KL, Bowman PJ, Hayes BJ, Raadsma H, Goddard ME. Sensitivity of genomic selection to using different prior distributions. BMC Proc 2010; 4(1):S5. https://doi.org/10.1186/1753-6561-4-s1-s5 [ Links ]
25. Meuwissen T, Hayes B, Goddard M. Accelerating Improvement of livestock with Genomic Selection. Annu Rev Anim Biosci. 2013; 1(1):221-237. https://doi.org/10.1146/annurev-animal-031412-103705 [ Links ]
26. Chen L, Li C, Zargolzaei M, Schenkel F. Impact of genotypes imputation on the performance of GBLUP and bayesian methods for genomic prediction. PLoS ONE. 2014; 9(7):e101544. https://doi.org/10.1371/journal.pone.0101544 [ Links ]
27. Vâzquez AI, Rosa GJ, Weigel KA, de los Campos G, Gianola D, Allison DB. Predictive ability of subsets of single nucleotide polymorphisms with and without parent average in US Holsteins. J Dairy Sci. 2010; 93(12):5942-5949. https://doi.org/10.3168/jds.2010-3335 [ Links ]
28. Habier D, Rohan LF, Kizilkaya K, Garrick DJ. Extension of the bayesian alphabet for genomic Selection. BMC Bioinformatics. 2011; 12(1):186. https://doi.org/10.1186/1471-2105-12-186 [ Links ]
29. Hayes BJ, Bowman PJ, Chamberlain AJ, Goddard ME. Invited review: Genomic selection in dairy cattle: Progress and challenges. J Dairy Sci 2009; 92(2):433-443. https://doi.org/10.3168/jds.2008-1646 https://doi.org/pdf/10.4081/ijas.2013.e91 [ Links ]
30. Nicolazzi EL, Negrini R, Chamberlain AJ, Goddard ME, Marsan PA, Hayes BJ. Effect of Prior Distributions on Accuracy of Genomic Breeding Values for Two Dairy Traits. Ital J Anim Sci 2013; 12(e91):555-561. https://www.tandfonline.com/doi/pdf/10.4081/ijas.2013.e91 [ Links ]
31. Colombani C, Legarra A, Fritz S, Guillaume F, Croiseau P, Ducrocq V, et al. Application of Bayesian least absolute shrinkage and selection operator (LASSO) and BayesCn methods for genomic selection in French Holstein and Montbéliarde breeds. J Dairy Sci. 2013; 96(1):575-591. https://doi.org/10.3168/jds.2011-5225 [ Links ]
How to cite (Vancouver) Zambrano JC, Echeverri J, López HA.Genomic Evaluation of Colombian Holstein Cattle Using Imputed Genotypes at Medium Density. Rev MVZ Cordoba. 2019; 24(2):7248-7255. DOI: https://doi.org/10.21897/rmvz.1704
Creative Commons Attribution 4.0 International License This article is distributed under the terms of the (https://creativecommons.org/licenses/by-sa/4.0/), which permits unrestricted use, distribution, and reproduction in any medium, provided you give appropriate credit to the original author(s) and the source. 
Received: January 01, 2018; Accepted: March 19, 2019; Published: June 01, 2019
 Este es un artículo publicado en acceso abierto bajo una licencia Creative Commons
