


Services on Demand
Journal
Article
 text in
  English (pdf)
 Article in xml format
 Article references
 Send this article by e-mail
Indicators
-
 Cited by SciELO
 -
 Access statistics
Related links
-
 Cited by Google
 -
 Similars in
SciELO
Similars in
SciELO -
 Similars in Google
Share

 Permalink
Revista MVZ Córdoba
Print version ISSN 0122-0268On-line version ISSN 1909-0544
Rev.MVZ Cordoba vol.24 no.3 Córdoba Sep./Dec. 2019 Epub June 04, 2020
https://doi.org/10.21897/rmvz.1461
Research article
Estimation of the balance of metabolizable lysine and methionine for grazing dairy cows
1 University of Antioquia, College of Veterinary Medicine, Biogénesis Research Group. Carrera 75 # 65-87 Medellin, Colombia.
2 University of Antioquia, College of Agricultural Sciences. Agro Sciences Research Group-GRICA. Carrera 75 # 65-87 Medellin, Colombia
Objective.
The aim of this study was to determine in grazing cows, the reproducibility and accuracy of the balance between predicted values, when compared with the observed values for the most limiting amino acids in milk protein synthesis, the methionine (Met) and Lysine (Lys).
Materials and methods.
Twelve lactating cows were used for a 20-day experimental period. Control: animals grazing and supplemented with balanced food; Met-Lys: same as control and supplemented with adjusted rumen protected Met and Lys. For Met and Lys supply predicted values, it was taking in account the average of the dry matter intake (DMI) of the herd, based in offer and foraging control and values of microbial protein data. Observed values were determined based in the individual DMI intake, using external and internal markers and the individual microbial protein production. A t-paired-sample test was performed and the efficiency of the model’s prediction was determined using the mean square prediction error (MSPE) and the concordance coefficient (CCC).
Results.
Significant differences were found between the predicted and observed values for DMI forage, digestible microbial protein and microbial protein production, supply and the balance of Lys and Met. The CCC for Lys and Met balance were low (0.10), the MSPE was high except for the total DMI with a moderate concordance (0.63) and low MSPE (4.42).
Conclusions.
These results indicate a lack of precision of the tools, which underestimates the supply and balance of amino acids in individual grazing cows.
Keywords: Estimation; essential amino acids; grazing; microbial protein; validation (Fuentes: CAB Thesaurus; Tesauro SPINES)
Objetivos.
El objetivo de este trabajo fue estimar en vacas en pastoreo, tanto la reproducibilidad como la precisión del balance de metionina (Met) y lisina (Lis), aminoácidos más limitantes en la producción de leche, cuando se comparan los valores predichos versus los valores observados.
Materiales y métodos.
Se usaron 12 vacas durante un periodo de 20 días. Control: animales pastoreando y suplementados con alimento balanceado; Met-Lis: igual al control y el suplemento se ajustó con Lis y Met protegida. Para los valores predichos para la suplementación de Met y Lis, se tuvo en cuenta el promedio del consumo de materia seca (CMS) del hato, basado en la oferta y el consumo de pasto y los valores de proteína microbiana. Los valores observados se determinaron con base en el CMS individual usando marcadores externos e internos, además, la producción individual de proteína microbiana. Se realizó una prueba de t pareada y un modelo de predicción para determinar la eficiencia fue determinado usando el error cuadrático medio de predicción (ECMP) y el coeficiente de concordancia (CCC).
Resultados.
Se encontraron diferencias significativas entre la suplementación y el balance de Met y Lis, entre los valores predichos y los valores observados para el CMS del forraje, la digestibilidad de la proteína microbiana, la producción de proteína microbiana, el suministro y el balance de Lis y Met. El CCC del balance de Lis y Met fue bajo (0.10), el ECMP fue alto, excepto para el CMS, que tuvo una concordancia moderada (0.63) y un bajo ECMP(4.42).
Conclusiones.
Estos resultados demuestran la falta de precisión de las herramientas que se usan para balancear las raciones individuales de vacas en pastoreo, ya que subestiman la suplementación y el balance de los aminoácidos.
Palabras clave: Estimación; aminoácidos esenciales; pastoreo; proteína microbiana; validación. (Fuente: CAB Thesaurus; Tesauro SPINES)
INTRODUCTION
Milk protein production is the focus for producers and nutritionists, since price benefits this amount. Ruminants derive their intestinal protein and amino acid supply from rumen a) non-degradable protein (RUP), b) microbial protein synthesized in the rumen and c) protein that is secreted endogenously. Dairy cattle food systems such as the National Research Council (NRC) 1 and the Cornell Net Carbohydrate and Protein System (CNCPS) 2 use mathematical models to predict animal’s requirements, metabolizable protein (MP) and amino acid (AA) contributions.
Lysine (Lys) and methionine (Met) are considered the most limiting AAs for milk protein synthesis 3-6. The Amino Cow (AC) program (version 3.5.2), an easy and free access tool to determine the Met and Lys balance for bovine feeding 7, allows to predict the amount (grams) of Met and Lys that flows towards the small intestine (SI) and to determine its balance. This software uses predicted values from different inputs obtained from mixed ration diets. However, these data used are for confined animals, there are not calculated for grazing systems as it’s the model in Colombia, due to lacking data such as individual intake of grass dry matter and its microbial protein (MicrobP) production.
The aim of this study was to determine the reproducibility and accuracy of the predicted values performed with the Amino Cow software, when compared with the observed values in the field, evaluated in the animals for the methionine and lysine balance in grassing cows that for us are the reference values.
MATERIAL AND METHODS
Location. The experimental work was performed in a farm located in Colombia with coordinates 6º40’57, 9”N 75º28’23, 8”W at 2550 altitude, with an average temperature of 14ºC, 79% relative humidity and an average annual precipitation of 2500 mm.
Management and feeding. Dairy cows were managed in a rotational grazing system with Kikuyu grass (Pennisetum clandestimun) strips. Water and mineral salt were available ad libitum.
Animals. Twelve multiparous dairy cows in mid lactation were maintained and fed with kikuyu grazing for a 20-day experimental period. The average milk production was of 24.0±4.76 L/day (mean ± standard deviation, SD), mature live weight of the cows was 580±31.8 kg, the average days in milk (DIM) was 126±14.37 days. Dairy cows were randomly assigned to one of the following treatment groups: Control: animals grazing Kikuyu grass in strips form with electric fence, and supplemented with balanced food concentrate; Met-Lys: animals grazing Kikuyu grass, supplemented with a balanced food concentrate and the supply of rumen protected AAs (Met and Lys). The chemical composition of feeds evaluated are showed in table 1. The software AminoCow 7 was used for estimate to AA requirements. The software showed that the diet supplies generate to deficiency 29.7% y 20.5% of methionine and lysine respectively. For experimental group was added rumen protected methionine (Mepron®, Evonik, Degussa AG, Alemania) and rumen protected lysine (AjiProTM-L Ajinomoto, Tokyo, Japan) in the cow’s diet, for that they were released to small intestine 7.03+2.93 g of methionine and 23.9+3.82 g of lysine. The experimental diet to cows was offered from 0 to 20 days of experimentation.
Table 1 Chemical composition of feeds evaluated.
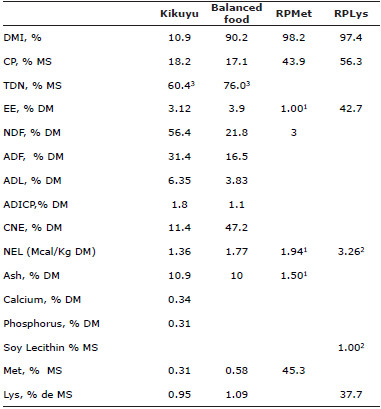
1,2 Reference values reported by the Trading Company, 3 Estimates values using the summative model established by Weiss et al (1992) (8), RPMet: Rumen protected methionine (Mepron), RPLys: Rumen protected Lysine (AjiPro-L), DMI: Dry matter Intake, CP: Crude Protein, TDN: Total Digestible Nutrients, EE: Ether Extract, NDF: Neutral Detergent Fiber, ADF: Acid Detergent Fiber, ADL: Acid detergent lignin, ADICP: Acid Detergent Insoluble Crude Protein, NSC: Non-structural carbohydrates = 100 - (%NDF + % CP + % EE + % Ash), 5 NEL: Net Energy Lactation (mcal/kg) = 0.0245 *TDN (%) - 0.12, Met: Methionine, Lys: Lysine
Predicted and observed Met and Lys balances. For the balancing Met and Lys follows the equation: Balance of Met or Lys = AA supply - AA requirements. For the predicted and observed Met and Lys balances the requirements are the same (Table 2) but the supply is different.
Table 2 Calculating methionine (Met) and lysine (Lys) requirements for lactating cows in the experiment.
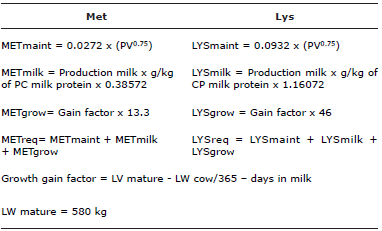
METmaint: Methionine requirements for maintenance, METmilk: Methionine requirements for milk production, METgrow: Methionine requirements for growth, METreq: Total methionine requirements, LYSmaint: Lysine requirements for maintenance, LYSmilk: Lysine requirements for milk production, LYSgrow: Lysine requirements for growth, LYSreq: Total lysine requirements, CP: Crude protein.
Estimation of the Met and Lys supply. For the predicted supply the average of grass intake and MicrobP was calculated by NRC 1, and for the observed supply, were calculated through purines derivate content and creatinine.
Estimation of the Met and Lys requirements. Individual estimation requirements for maintenance, milk production and body growth (Table 1) were calculated based on live weight (LW), days in milk, age, milk production and protein percentage (%). Measurements introduced into the AC software 7.
Predicted amino acid contribution reaching SI. The amount was estimated from a) the rumen non-degradable protein (RUP), b) the endogenous-secreted protein (EP) and c) the microbial protein synthesized in the rumen (PMicrob).
Predicted and observed values of Met and Lys from RUP contribution in vivo. Met and Lys supply from RUP to SI and their AAs intestinal digestibility percentage were estimated before the onset of the experiment. Profiles from protein and AA in Kikuyu grass as well as in the commercial balanced feed were determined, before and after ruminal incubation 27.4 h according to Duque et al 9 (solid material passage rate 0.0365 h-1), and finally in feces after the intestinal digestibility.
Final contribution was obtained as shown in the following formula:
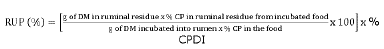
RUP from sources = (RUP from kikuyu x DMI from kikuyu) + (RUP from concentrated food * DMI from concentrated food)
RUP: Rumen non-degradable protein (%), DM: Dry matter (g), CP: Crude protein (%), CPDI: Crude protein digestible intestinally (%), DMI: Dry matter intake (g)
Met and Lys from the predicted and observed EP contribution. Predicted values of forage intake was estimated by the volume of grass in the assigned strip after and before grazing, and for the amount (Kg) of balanced food served. It was taking in account dietary DM offered minus dietary DM refused; as internal marker used was Acid detergent lignin (ADL) and as external marker chromium oxide 10.
Observed values were calculated:
EP = 11.87 g/kg x DMI (kg) of food
EP Met = 0.11 g/kg x DMI (kg) of food
EP Lys = 0.40 g/k x DMI (kg) of food
EP: Endogenous protein (g), EP Met: Endogenous protein produced by methionine (g), EP Lys: Endogenous protein produced by lysine. Value assumed for endogenous AA digestibility was 80% because the software AminoCow by default assume this.
Met and Lys from the predicted PMicrob contribution. Contribution was based on the dry mater intake forage (DMIf) and PMicrob estimated as follows:
The amount offered was 2.3 kg of green forage/ m2, and the waste left after grazing was over 40%; so the intake forage estimation was 13 kg DM/cow/day.
The PMicrob synthesized was calculated using the NRC 1 formula as shown in following Equation:
PMicrob (g/d) = (0.13* TDN consumed (kg) *1000)
TDN consumed (kg) = kg DM consumed * % TDN
TDN: Total digestible nutrients, DM: Dry matter. The TDN values for the supplement and the forage were 76 and 60.4%, respectively. The forage’s TDN was estimated using the model described by Alvarenga et al 11.
Met and Lys from the observed PMicrob contribution. Estimation of DMIf in grazing system. The experimental period was 20 days; the first 14 days were for diet adaptation; days 18, 19 and 20 were for sample collections of forage, urine and feces. AA flow to the SI was performed quantifying the forage consumption through chromium oxide (Cr2O3) as an external marker and ADL 12 as internal marker. Chromium oxide was delivered orally in 5 g doses twice a day (morning and afternoon milking). The procedure was performed for 9 days, which corresponds to day 12 after the onset of the experimental period: in the first 6 days, the equilibrium of intake and excretion of the marker was obtained and from day 7, feces collections were performed twice a day at the morning and afternoon milking. Samples were taken manually directly from the rectum (250 g per sample) and were frozen until needed, finally mixed, resulting in a single sample for each cow. These samples were dried at 60°C for 72 hours and preserved until the DM, ADL 13 and chromium contents were determined using an atomic absorption spectrophotometer, according to the methodology described by Souza et al (2013) 14. The DMI of the concentrated food was quantified by weighing the food each time the animal arrived at the milking station.
Fecal production and DM consumption of the forage were estimated using the formula 11.
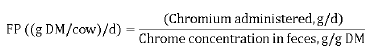
Where FP = Fecal production, g of DM/day
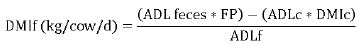
DMIf = Dry matter intake of the forage, kg/cow/day, FP = Total fecal production, kg DM/day, ADL feces = Acid detergent lignin found in the animal’s feces, %, ADLc = Acid detergent lignin of the concentrated food, %, DMIc = Dry matter intake of the concentrated food, kg/cow/day, ADLf = Acid detergent lignin of the forage. A fecal chromium recovery rate of 80% was assumed 12. The DMI of the total was determined as the total DMI (DMIt) plus the DMI of the supplement.
Estimation of PMicrob. Urine samples were collected during days 18, 19 and 20 according to Fagundes et al 15. Purine derivatives were estimated according to Faleiro et al 16 and Castro-Montoya et al 17. Briefly each urine sample was filtered and 5 mL were immediately diluted in 45 ml of 0.036 N sulfuric acid, aliquot in 50 ml samples and stored at -20ºC. Creatinine and uric acid analysis were performed using the colorimetric method described by Escobar et al 18 and allantoin was measured by high-performance liquid chromatography (HPLC) as described by Vlassa et al 19 at the Instrumental Analysis Laboratory of the Universidad Nacional of Colombia.
The concentration of purine derivatives (PD) in urine samples (mmol/L) was obtained adding both allantoin (mmol/L) and uric acid (mmol/L).
PD (mmol/L) = Allantoin (mmol/L) + Uric acid (mmol/L)
The quantification of the daily excretion of purine derivatives (PDE) was obtained using the following formula:
PDE= ((PD x (LW x Kct))/113.12)/CT
PDE: daily excretion of purine derivatives (mmol/d), PD: concentration of purine derivatives in urine samples (mmol/L), LW: live weight (kg), CT: creatinine concentration in urine samples (mmol/L) and Kct: coefficient of daily creatinine excretion (mg/d) = 113 x PV-0.25, value proposed by Chen et al 20.
The estimation of the daily absorption of purines (PA) from the microbial nucleic acids was calculated according to Chen et al (1992) 20:
PA (mmol/d) = ((PDE- (0.385 x PV0.75))/0.85
Where PA: purine absorbed per day (mmol/d), PDE: daily excretion of purine derivatives (mmol/d), 0.385 x PV0.75: endogenous contribution of purine (mmol/kg of metabolic LW) and 0.85: recovery of absorbed purines as purine derivatives 21.
The intestinal flow of the microbial nitrogen compounds (NM, N g/day) was calculated based on the microbial purines absorbed (PA, mmol/d) using the following equation:
NM = (PA x 70) / (0.83 x 0.116 x 1000)
NM: microbial N (g/d), PA: purines absorbed (mmol/d), 70: N content in microbial purines (N mg/mmol), 0.83: purine digestibility factor, 0.116: is a N in purines:total N in ruminal microorganisms ratio, expressed by the 11.6/100), and 1000: correction factor from mg to grams 20. The total PMicrob produced (g/d) was calculated:
PMicrob = NM x 6.25
Where NM: microbial nitrogen (g/d), and 6.25: standard coefficient of the N content of proteins (100/16).
Variables estimated using AC software. The following variables were estimated from formulas in the AC software to obtain the Met and Lys balances: Met requirement (MET Req, g/d), Lys requirement (LYS Req, g/d), Met supply (g/d), Lys supply (g/d), and predicted and observed Met and Lys balances (g/d). The total PMicrob production (PMicrob, g/d) and PMicrob absorbed in the SI (digestible PMicrob, g/d) were estimated using the NRC 1.
Statistical analysis. A t test for paired samples was performed to determine whether the differences of the measurements between paired observations of each variable (observed vs predicted) were significant. A critical level of 5% was used for type I errors. To complement the information, a descriptive statistical analysis was performed to obtain the means and standard deviations between the observed and predicted values. The information was processed using SAS statistical software.
The comparative evaluation of the prediction efficiency was performed using the (MSPE), as described by Gomes et al 22, according to the following equation:
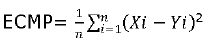
Where X = observed values, Y = predicted values. For all variance calculations, the total of observations (n) was used as divisor. The concordance correlation coefficients (CCCs), known as the reproducibility indices, which simultaneously consider accuracy and precision, were calculated according to Pralle et al 23 and Pereira et al 24 for the variables DMIf, DMIt, digestible PMicrob, Lys and Met supply and balance.
RESULTS
Predicted values exhibited neither reproducibility nor accuracy compared to the observed values (Table 3).
Table 3 Predicted and observed values for the different variables evaluated.
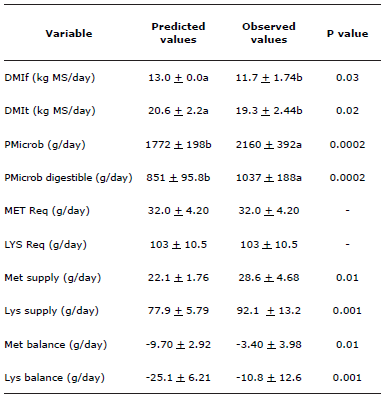
DMIf: DM intake of the forage, DMIt: total DM intake = DMIf + DMIc, PMicrob: Microbial protein production, PMicrob digestible: Production of microbial protein absorbed in the small intestine, MET Req: Met requirement, LYS Req: Lys requirement, Met Balance: Total metabolizable Met supply - Met Req, Lys balance: Total metabolizable Lys supply - Lys Req.
Table 4 shows the comparisons between the estimates obtained from the predicted and observed values.
Table 4 Correlations, mean square prediction errors and concordance correlation coefficients for the variables studied.
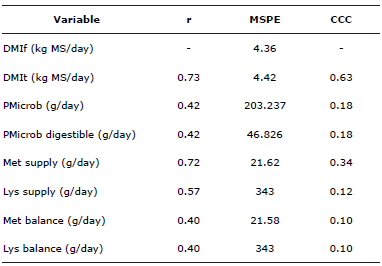
r: Spearman correlation coefficient, MSPE: Mean square prediction error, CCC: concordance correlation coefficient, DMIf: DM intake of the forage, DMIt: total DM intake = DMIf + DMIc, PMicrob: Microbial protein production, PMicrob digestible: Production of microbial protein absorbed in the small intestine, Met Balance: Total metabolizable methionine supply - MET Req, Lys balance: Total metabolizable lysine supply - LYS Req.
DISCUSSION
The most important variables for the Met and Lys balance calculations are DMIf and PMicrob. The DMIf values observed by Correa et al 12 were similar to our data being for Kikuyu grass of 11.0±2.98 and 13.6±3.74 estimated using the indigestible acid detergent fiber (ADFi) in vitro and in situ, respectively. In opposition, the data obtained for PMicrob production measured in the same feeding system were different. These authors found that the flow of PMicrob towards the duodenum was 482.9±509.7 g/cow/d, with a high variation coefficient (105.5%). However, in our study, we observed that PMicrob production was 2160.4±392.0, with a variation coefficient of 18.1%, a much lower value.
Paired t test analysis revealed that mean differences between paired observations are significantly different for DMIf, DMIt, PMicrob, digestible PMicrob and Met and Lys supply (p<0.05); due to this, predicted and observed DMIf variable values are different hence the Met and Lys supply estimations are also different. This result, corroborates the fact that predicted values are not comparable with observed values when evaluations are in grazing systems. Regarding the AA balance, it was verified that the Met deficiency estimated by the AC software was 64.9% higher than the observed deficiency (-9.70 vs -3.40 g/d). For Lys, the estimated deficiency was 57.0% higher than the observed deficiency (-25.1 vs -10.8 g/d). These findings demonstrate that the AA contributions were underestimates of the diet and PMicrob that were calculated initially.
As can be seen (table 4), Spearman correlation coefficients are high for DMI total and Met and Lys supply (0.73, 0.72, 0.57 and 0.67, respectively) but for the rest of the estimations coefficients were lower. For all variables, the CCC values were low (between 0.02 and 0.34) and their MSPEs were high, demonstrating that predicted results were different from observed values, except for the DMIt, which had slight concordance strength and a low MSPE of 4.42 (Table 3). The results confirm that predicted values exhibited neither precision nor accuracy compared to the observed values. Under grazing system conditions, predicted and observed dry matter intake forage and dry matter intake total were different; hence the observed endogenous and microbial protein values are far from the predicted values.
The differences predicted and observed for DMIf and DMIt is very important because the deviations between predicted and estimated intake values will influence the AA contributions into the SI taking in account that calculations to determine the AA balances are based on an additive system. All of the contributions made by the RUP, the PMicrob and the EP include the dry matter intake variable in their equations. If this variable varies considerably compared to the initially determined average value, there will be large differences between the predicted and observed values in the final determinations of the Met and Lys balance because these balances reflect the differences detected in the rest of the determinations.
Regarding the DMIf, the differences identified between the predicted and field values occur because in the first case, the bromatological characteristics of the diet, the environment, the nutritional and energetic demand and the selectivity of each animal are not taken into account to calculate the DMIf. One important conclusion is that to balance diets for limiting AAs, the DMIf must be previously determined for each individual because the AA balances are also calculated individually, and this variable is included in the determinations of the rest of the variables.
Patton 25,26 suggested that in order to achieve an appropriate AA balance, the real DMI of the group of animals has to be known. If this is not possible, the AA balance calculation cannot be performed. At the same time, the author states that the models used to estimate the DMI are based on many published studies, so that models constitute more than a guess. Differences between models can be up to 1.5 kg in the intake planned for a given animal; this difference in the intake changes the AA flow towards the SI. Although in our study, the DMIf was an approximation, it is more realistic in the type of system managed in Colombia-grazing cows that in the NRC equations (1).
The differences detected in predicted and observed PMicrob values can be due to the fact that the estimation formula for the predicted value is based on the TDN, and the use of this variable includes the energy supplied by fat, which is not an energetic substrate used by ruminal microorganisms for their growth 27. Additionally, the formula assumes a constant efficiency, and it can underestimate PMicrob production in diets with high concentrated food levels because bacteria do not grow with the same efficiency when fermenting fiber as they do with soluble carbohydrates.
The efficiencies can vary between 13 and 33% 28; therefore, it is wrong to assume a constant value. A more adequate estimation for PMicrob synthesis would have involved including the fermentable organic matter because diets that are more fermentable provide more energy, they favor microbial growth and can be reflected with a better estimation for this variable. Therefore, it can be said that the metabolizable (digested) PMicrob values that are estimated with the NRC 1 formula are underestimated in grazing systems.
Concluding under grazing conditions, in this study the Amino Cow program underestimates the contribution of Met and Lys in the small intestine. In pasture-based production systems, the determination of the contribution of Lys and Met as well as the amount of these AAs to be supplemented is necessary to gather individual data for the dry matter intake forage, microbial protein production and total grass intake.
Under grazing system conditions, predicted and observed dry matter intake forage and dry matter intake total were different; hence the observed endogenous and microbial protein values are far from the predicted values.
Acknowledgments
Colciencias by the Dr. Sci. Anim. Scholarship awarded to the first author of this document. The University of Antioquia and the research group Biogénesis are gratefully acknowledged.
REFERENCES
1. National Research Council. Nutrient Requirements of Dairy Cattle: Seventh Revised Edition. Washington, DC: The National Academies Press; 2001. https://doi.org/10.17226/9825 [ Links ]
2. Van Amburgh ME, Collao-Saenz EA, Higgs RJ, Ross DA, Recktenwald EB, Raffrenato E, Chase LE, Overton TR, Mills JK, Foskolos A. The Cornell Net Carbohydrate and Protein System: Updates to the model and evaluation of version 6.5. J Dairy Sci. 2015; 98(2):6361-6380. https://doi.org/10.3168/jds.2015-9378 [ Links ]
3. Třináctý J, Křížová L, Richter M, Černý V, Říha J. Effect of rumen-protected methionine, lysine or both on milk production and plasma amino acids of high-yielding dairy cows. Czech J Anim Sci. 2009; 54(6):239-248. https://doi.org/10.17221/1730-CJAS [ Links ]
4. Robinson P. Impacts of manipulating ration metabolizable lysine and methionine levels on the performance of lactating dairy cows: A systematic review of the literature. Livest Sci. 2010; 127(2-3):115-126. https://doi.org/10.1016/j.livsci.2009.10.003 [ Links ]
5. Patton R. Effect of rumen-protected methionine on feed intake, milk production, true milk protein concentration, and true milk protein yield, and the factors that influence these effects: A meta-analysis. J Dairy Sci . 2010; 93(5):2105-2118. https://doi.org/10.3168/jds.2009-2693 [ Links ]
6. Robinson P, Swanepoel N, Shinzato I, Juchem S. Productive responses of lactating dairy cattle to supplementing high levels of ruminally protected lysine using a rumen protection technology. Anim Feed Sci Technol. 2011; 168(1-2):30-41. https://doi.org/10.1016/j.anifeedsci.2011.03.019 [ Links ]
7. AminoCow. The Mepron Dairy Ration Evaluator. Hanau, Germany: Degussa Corp; 2010. http://www.makemilknotmanure.com/aminocow.php [ Links ]
8. Batista C, Detmann E, Valadares S, Queiroz A, Pereira T, Rodrigues R, Augusto de Souza M, Carli V. Evaluation of models for prediction of the energy value of diets for growing cattle from the chemical composition of feeds. R Bras Zootec. 2012. 41(9):2110-2123. https://www.rbz.org.br/article/evaluation-of-models-for-prediction-of-the-energy-value-of-diets-for-growing-cattle-from-the-chemical-composition-of-feeds/ [ Links ]
9. Duque-Quintero M, Rosero-Noguera R, Olivera-Angel M. Digestion of dry matter, crude protein and amino acids of the diet dairy cows. Agron Mesoam. 2017; 28(2):341-356. https://doi.org/10.15517/ma.v28i2.25643 [ Links ]
10. Moreira Filho MA, Alves AA, Garcez BS, Moreira AL, Azevêdo DMMR, Parente HN. Digestibility markers of sheep diets containing hydrolyzed sugarcane-top hay. Rev Bras Saúde Prod Anim. 2017; 18(1):38-49. http://dx.doi.org/10.1590/s1519-99402017000100005 [ Links ]
11. Santos SA, Valadares Filho SdC, Detmann E, Valadares RFD, Ruas JRM, Prados LF, et al. Intake, digestibility and nitrogen use efficiency in crossbred F1 Holstein× Zebu grazing cows. R Bras Zootec . 2012; 41(4):1025-1034. http://dx.doi.org/10.1590/S1516-35982012000400027 [ Links ]
12. Correa H, Pabón M, Carulla J. Estimación del consumo de materia seca en vacas Holstein bajo pastoreo en el trópico alto de Antioquia. Livestock Res Rural Dev. 2009; 21(4): http://www.lrrd.org/lrrd21/4/corr21059.htm [ Links ]
13. Fukushimaa R, Kerleya M, Ramos M, Porter J, Kallenbach R. Comparison of acetyl bromide lignin with acid detergent lignin and Klason lignin and correlation with in vitro forage degradability. Anim Feed Sci Technol . 2015; 201:25-37. https://doi.org/10.1016/j.anifeedsci.2014.12.007 [ Links ]
14. Souza N, Detmann E, Pina D, Valadares Filho S, Sampaio C, Queiroz A, et al. Evaluation of chromium concentration in cattle feces using different acid digestion and spectrophotometric quantification techniques. Arq Bras Med Vet Zootec. 2013; 65(5):1472-1482. http://dx.doi.org/10.1590/S0102-09352013000500028 [ Links ]
15. Fagundes M, Yang s, Eun J, Hall J, Moon J, Park JS. Influence of supplementing a methionine derivative, N-acetyl-l-methionine, in dairy diets on production and ruminal fermentation by lactating cows during early to mid lactation. J Dairy Sci . 2018; 101 (8):1-13. https://doi.org/10.3168/jds.2017-14130 [ Links ]
16. Faleiro J, Moreira E, Braga Reis R, Machado I, Mattana H, Castro dos Reis T, Reed J. Produção de proteína microbiana e derivados de purinas em vacas. PUBVET. 2016; 10(1):91-99. DOI: https://doi.org/10.22256/pubvet.v10n1.91-99 [ Links ]
17. Castro-Montoya J, Henke A, Molkentinc J, Knappsteinc K, Susenbethb A, Dickhoefer U. Relationship between milk odd and branched-chain fatty acids and urinary purine derivatives in dairy cows supplemented with quebracho tannins-A study to test milk fatty acids as predictors of rumen microbial protein synthesis.Anim Feed Sci Tech. 2016; 214:22-33. http://dx.doi.org/10.1016/j.anifeedsci.2016.01.016 [ Links ]
18. Escobar Puerta L, Bolívar Vergara DM, Espinoza García D. Uso de la Excreción de Creatinina como Método Alternativo a la Colecta Total de Orina en Vacas Holstein. Rev Fac Nac Agron Medellín. 2010; 63(2):5567-5576. https://revistas.unal.edu.co/index.php/refame/article/view/25045 [ Links ]
19. Vlassa M, Filip M, Pascalau V, Coman V, Dragomir C. Determination of purine derivatives in bovine urine using rapid chromatographic techniques. Arch Zootec. 2009; 12(4):59-70. https://www.ibna.ro/arhiva/AZ%2012-4/AZ%2012-4_05%20Vlassa.pdf [ Links ]
20. Kozloski GV, Stefanello CM, Oliveira L, Ribeiro H, Klopfenstein T. Technical note: Evaluation of urinary purine derivatives in comparison with duodenal purines for estimating rumen microbial protein supply in sheep. J Anim Sci. 2017; 95(2):884-891. https://doi.org/10.2527/jas.2016.0840 [ Links ]
21. Figueiras JF, Detmann E, Paulino MF, Valente TNP, Valadares Filho SdC, Lazzarini I. Intake and digestibility in cattle under grazing supplemented with nitrogenous compounds during dry season. R Bras Zootec . 2010; 39(6):1303-1312. http://dx.doi.org/10.1590/S1516-35982010000600020 [ Links ]
22. Gomes JA, Valadares Filho SdC, Detmann E, Pina DdS, Paulino MF, Valadares RFD, et al. In situ and in vitro degradation kinetics and prediction of the digestible neutral detergent fiber of agricultural and agro-industrial byproducts. R Bras Zootec . 2012; 41(8):1890-1898. https://www.rbz.org.br/article/in-situ-and-in-vitro-degradation-kinetics-and-prediction-of-the-digestible-neutral-detergent-fiber-of-agricultural-and-agro-industrial-byproducts/ [ Links ]
23. Pralle RS, Weigel K, White H. Predicting blood β-hydroxybutyrate using milk Fourier transform infrared spectrum, milk composition, and producer-reported variables with multiple linear regression, partial least squares regression, and artificial neural network. J Dairy Sci . 2018; 101(5):4378-4387. https://doi.org/10.3168/jds.2017-14076 [ Links ]
24. Pereira G, Heins B, Endres M. Technical note: Validation of an ear-tag accelerometer sensor to determine rumination, eating, and activity behaviors of grazing dairy cattle. J Dairy Sci . 2018; 101(3):1-4. https://doi.org/10.3168/jds.2016-12534 [ Links ]
25. Patton RA. The strategic use of ruminally protected amino acids in dairy nutrition. [En linea]. Proceedings of Florida Ruminant Nutrition Symposium, 2009. Citeseer. Available in: http://dairy.ifas.ufl.edu/rns/2009/Patton.pdf [ Links ]
26. Patton RA. Effect of rumen-protected methionine on feed intake, milk production, true milk protein concentration, and true milk protein yield, and the factors that influence these effects: A meta-analysis. J Dairy Sci . 2010; 93:2105-2118. https://www.journalofdairyscience.org/article/S0022-0302(10)00201-8/fulltext [ Links ]
27. Galyean M, Tedeschi L. Predicting microbial protein synthesis in beef cattle: Relationship to intakes of total digestible nutrients and crude protein. J Anim Sci . 2014; 92(11):5099-5111. https://doi.org/10.2527/jas.2014-8098 [ Links ]
28. Ramaiyulis, Rusmana WSN, Mardiati Z, Lili W. Optimization of Rumen Microbial Protein Synthesis by Addition of Gambier Leaf Residue to Cattle Feed Supplement. Pak J Nutr. 2019; 18(1):12-19. http://dx.doi.org/10.3923/pjn.2019.12.19 [ Links ]
How to cite (Vancouver) Duque-Quintero M, Rosero-Noguera R, Olivera-Angel M. Estimation of the balance of metabolizable lysine and methionine for grazing dairy cows. Rev MVZ Cordoba. 2019; 24(3):7346-7354. DOI: https://doi.org/10.21897/rmvz.1461
Received: December 2018; Accepted: March 2019; Published: September 2019
 Este es un artículo publicado en acceso abierto bajo una licencia Creative Commons
