


 texto em
  Inglês (pdf)
 Artigo em XML
 Referências do artigo
 Enviar este artigo por email
 Citado por SciELO
  Citado por Google
  Similares em
SciELO
Similares em
SciELO  Similares em Google
 Permalink
INTRODUCTION
Climate change effect is a reality and gases, such as methane (CH4) and carbon dioxide (CO2) are the main responsible of the greenhouse effect 1. Gases produced by enteric fermentation of feed into ruminants’ digestive system play a very important role in methane and CO2 emissions to atmosphere. These emissions contribute with approximately 18% of total anthropogenic greenhouse gases (GHG) emissions, causing global warming and climate change effects. Additionally, there is an increasing demand for food sources which are commonly used for animal nutrition by the increasing population in developing countries under hunger situation 2. These circumstances have shown repercussions on prices and accessibility of ingredients of animals’ feed, hence the necessity of evaluating the use of alternative ingredients as animal feed which are not suitable for human consumption 3,4. Moreover, feed additives and some alternative ingredients for cattle’s diets can modify the characteristics of rumen fermentation by enhancing feed efficiency and energy utilisation while decreasing methane production 5,6,7. In this way, there is a growing interest in studying secondary metabolites obtained from plants as natural modifiers of ruminal fermentation to reduce methane emissions (e.g. condensed tannins and saponins). However, the extraction process may be too expensive. Therefore, researchers worldwide are considering the inclusion of plants containing these metabolites. In addition, most of these plants will not compete with human feeding and may represent a low-cost way for feeding beef cattle which will contribute to reduce GHG emissions as methanogens inhibitors and methanogenesis suppressors 8,9,10.
Cucurbits or squashes have been increasingly incorporated into the food industry in the late decades of the twentieth century 11,12,13. Moreover, buffalo gourd (BG, Cucurbita foetidissima) was catalogued as the most promising squash for domestication and utilisation since the plant is considered indigenous and does not need special growing conditions 14. However, the presence of anti-nutritional factors and certain metabolites, like condensed tannins (CT), excludes its use in human feeding 11. Additionally, few studies have been directed on its usage as ruminants’ feedstuff. Nonetheless, previous analyses of chemical composition of BG indicate that it is a good source of starch, essential oils and protein 14,15. Consequently, it is hypothesised that the inclusion of BG may reduce methane production from ruminants without affecting rumen fermentation characteristics. Therefore, the aim of this study was to evaluate the inclusion of leaves of BG as partial or total substitute of alfalfa hay (AH) as a forage source in beef cattle diets on in vitro methane production and ruminal fermentation parameters.
MATERIALS AND METHODS
Ingredients and experimental treatments. Buffalo gourd was grown wild and collected from rural roads in Durango, Mexico. Plants were identified by staff of the Ecology Institute of Durango’s State Juarez University. The roots and fruits were removed and leaves were washed and dried in a forced convection air oven set at 50°C for 48 h. Alfalfa hay, ground corn, cottonseed meal and minerals premix were purchased from a local store. The experimental treatments were formulated to meet beef cattle nutritional requirements according to NRC 16 with 50% forage and 50% concentrate in a total mixed ration. The inclusion of five levels of BG were evaluated as AH substitute at 0, 25, 50, 75 and 100%, identified as CON, BG25, BG50, BG75 and BG100, respectively.
Chemical analysis. Samples of mixed rations were subjected to chemical analyses in triplicate according to the procedures of the AOAC 17. Dry matter was determined after constant weight was recorded in the sample at 95°C. Crude protein was analysed with the micro-Kjendhal method whereas ether extract was calculated with a soxhlet extraction of the crude fat. Likewise, neutral detergent fibre (NDF) and acid detergent fibre (ADF) were evaluated as proposed by Van Soest et al 18 using an Ankom digester (ANKOM Technology, USA). In vitro dry matter digestibility (IVDMD) was determined using the DAISYII digester (ANKOM Technology, USA) according to procedures suggested by Ankom 19. Analyses of CT and total phenolic compounds (TPC) were evaluated according to Agostini-Costa et al 20.
In vitro fermentations. In vitro gas production was performed according to Cornou et al 21: approximately 1 g of ground samples of each treatment were placed into glass modules equipped with electronic pressure transducers (ANKOM Technology, USA). Buffered mineral solutions were mixed in a 2:1 ratio with ruminal liquor obtained from a fistulated crossbreed steer fed with an alfalfa hay basis diet. About 120 ml of solution were set into each module flushing with CO2 to remove oxygen from head-space and modules were placed in a stirred incubator at 39°C in triplicate. Cumulative gas pressure was recorded every hour from 0 to 96 h of incubation time for each treatment. Additionally, two samples of each treatment were incubated for 24 h and collected from the glass modules and centrifuged at 1400 RFC for 5 minutes. Centrifuged samples were then placed in borosilicate vials previously prepared with sulphuric acid and methaphosphoric acid to evaluate ammonia-N (N-NH3) and short-chain fatty acids (SCFA), according to procedures proposed by Galyean 22.
Before opening the modules to retrieve samples for N-NH3 and SCFA quantification, 1 ml of gas sample was collected from the head-space vessels to determine concentrations of methane and CO2 of fermentations using a GOW MAC 580 GC (GOW-MAC Instrument Co, USA) using a Hayesep Q column (8 x 1/8 in SS packed 80/100 mesh; Valco Instruments Co. Inc., USA). Column, detector and injector temperature were set to 40, 64 and 67°C, respectively, using nitrogen as carrier gas.
Calculations and statistical analyses. Gas production kinetics was calculated using the obtained cumulative volumes at different fermentation times. Obtained data were fitted into Gompertz model 10, using NLIN procedure of SAS (SAS, NY, USA)
GP = A*exp[-L*(exp(-b*t))]
Where GP is the cumulative total gas production (ml) at a time t; A represents the maximum gas production (ml/g); b is the specific gas production rate (ml/h); and L represents the latency period (lag phase) before gas production starts (h). Metabolisable energy (ME) was calculated using the equation used by Boga et al 23:
ME (MJ/kg DM) = 2.2 + 0.136GP24 + 0.0057CP + 0.000292EE2,
Where GP24 is the 24 h net gas production (ml/g DM); CP and EE are crude protein and ether extract (g/kg), respectively.
Microbial protein production (MPP) was estimated according to Blümmel et al 24:
MPP (mg/g DM) = IVDMD - (GP48*2.2),
where GP48 is the 48 h net gas production (ml/g DM).
All data was analysed following a completely randomised design using GLM procedure (SAS, NY, USA). The used model was: Y = µ + Ti + e, where µ is overall mean, Ti is the treatment effect and e is the error term. Differences between means were identified and considered significant at p<0.05 using Tukey’s means comparison test. Additionally, orthogonal polynomial contrast test was used to define linear and quadratic effects of BG inclusion into experimental treatments.
RESULTS
Chemical composition and in vitro digestibility. Chemical composition of AH and BG are presented in Table 1. Contents of organic matter (OM) and neutral detergent fibre (NDF) were higher in BG than AH (p<0.05). Likewise, concentrations of CT and TPC were higher in BG than AH (p<0.05). Otherwise, IVDMD was higher in AH than BG (p<0.05). Crude protein and EE contents were similar among forages (p>0.05).
Table 1 Chemical composition and in vitro digestibility of alfalfa hay and buffalo gourd.
| Nutrients, % DM | Alfalfa hay | Buffalo gourd | SEM |
|---|---|---|---|
| Organic matter | 89.2±0.60 a | 80.9±0.59 b | 0.83 |
| Ether Extract | 2.1±0.14 | 2.0±0.07 | 0.16 |
| Crudeprotein | 15.5±1.02 | 18.3±0.88 | 1.35 |
| Neutro detergent fiber | 44.9±0.05a | 47.8±0.34b | 0.33 |
| Lignin | 12.8±0.92 a | 6.4±0.07 b | 1.92 |
| IVDMD | 74.3±0.27 a | 62.5±2.04 b | 2.05 |
| TPC, µg/mg | 44.3±3.56a | 74.4±0.91 b | 3.68 |
| CT, µg/mg | 15.9±0.58a | 21.8±0.58b | 0.83 |
| abMeans with different letters within the same row are statistically different (P<0.05); IVDMD=In vitro dry matter digestibility; CT=Condensed tannins; TPC=Total phenolic compounds; SEM=Standard error of difference between means. | |||
Table 2 shows ingredients, chemical composition, in vitro digestibility, phenolic compounds and metabolisable energy of experimental treatments. No changes were observed in EE, CP, IVDMD and ME because of the inclusion of BG into the experimental treatments (p>0.05). Concentration of NDF, CT and TPC increased (p<0.05) as BG content increased in the treatments, whereas OM decreased (p<0.05). Otherwise, lignin decreased as BG content increased in the experimental treatments, presenting reductions over 50% with the highest inclusion of BG (p<0.05). However, lignin concentration in CON (16% DM) is 138% higher than BG100 (6.7% DM; p<0.05). Concentrations of CT and TPC ranged from 11.8 to 20.8 (µg/mg DM) and 35.2 to 50.7 (µg/mg DM), respectively.
Table 2 Ingredients, chemical composition, in vitro digestibility and metabolizable energy of experimental treatments.
| Treatments | ||||||
|---|---|---|---|---|---|---|
| Ingredients, % DM | CON | BG25 | BG50 | BG75 | BG100 | |
| Alfalfa hay | 50 | 37.5 | 25 | 12.5 | 100 | |
| Buffalo gourd | 0 | 12.5 | 25 | 37.5 | 50 | |
| Ground corn | 30 | 30 | 30 | 30 | 30 | |
| Cotton seed meal | 19 | 19 | 19 | 19 | 19 | |
| Mineral Premix* | 1 | 1 | 1 | 1 | 1 | |
| Chemical composition (%, DM) | ||||||
| CON | BG25 | BG50 | BG75 | BG100 | SEM | |
| Organic matter | 91.9 ±0.4a | 91.0 ±0.1a | 89.4 ±0.2b | 89.1 ±0.1b | 88.5 ±0.1b | 0.55 |
| Etereo extract | 2.5 ±0.26 | 2.2 ±0.14 | 2.3 ±0.15 | 1.9 ±0.0 | 2.2 ±0.10 | 0.35 |
| Crude protein | 19.9 ±0.7 | 19.9 ±0.17 | 20.5 ±0.08 | 21.2 ±0.61 | 22.2 ±0.52 | 1.08 |
| Neutro detergent fiber | 44.7 ±0.5c | 44.7 ±0.51b | 44.9 ±0.40b | 46.8 ±0.09a | 47.9 ±0.24a | 1.01 |
| Lignin | 16.0 ±0.86a | 14.3 ±0.61a | 9.4 ±0.49b | 7.6 ±0.14b | 6.7 ±0.07b | 1.17 |
| CT, µg/mg DM | 11.8 ±0.06d | 15.6 ±0.33c | 17.8 ±0.14b | 19.0 ±0.16b | 20.8 ±0.57a | 0.71 |
| TPC, µg/mg DM | 35.2 ±0.64d | 38.9 ±0.18c | 44.0 ±1.09b | 45.8 ±0.13a | 50.7 ±3.01a | 3.28 |
| IVDMD, % DM | 75.7 ±1.2 | 69.7 ±1.9 | 71.4 ±0.5 | 71.9 ±2.22 | 71.9 ±1.7 | 3.62 |
| ME, MJ/kg DM | 36.6 ±0.6 | 33.5 ±1.8 | 30.2 ±1.4 | 29.9 ±0.56 | 29.4 ±2.8 | 3.80 |
| abcdMeans with different letters within the same row are statistically different (P<0.05); CT=Condensed tannins; TPC=Total phenolic compounds; IVDMD= In vitro dry matter digestibility; ME=Metabolizable energy; *Minerals premix containing: P (12%), Ca (12%), Na (9%), Mg (1.7%), Zn (0.5%); SEM=Standard error of difference between means | ||||||
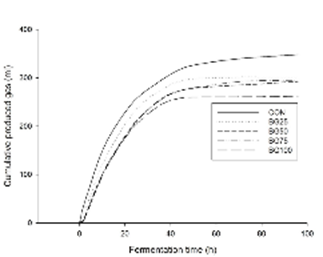
In vitro gas kinetics. In vitro gas kinetics of experimental treatments is presented in Table 3. The highest levels of BG in the experimental treatments reduced gas production (p<0.05) which ranged from 334.6 to 259.5 ml/g DM with the total replacement of AH in BG100. However, net specific gas production rate and latency period were not affected by BG inclusion (p>0.05). Likewise, MPP was not affected by inclusion of BG in the experimental treatments (p>0.05). Otherwise, N-NH3 increased near 30% (p<0.05) with the highest levels of BG inclusion in the experimental treatments. Additionally, cumulative gas production chart of experimental treatments is presented in Figure 1.
Table 3 In vitro gas kinetics, microbial protein production and N-NH3 of experimental treatments
| Experimental treatments | ||||||
|---|---|---|---|---|---|---|
| Parameters | CON | BG25 | BG50 | BG75 | BG100 | SEM |
| A, ml/g DM | 334.6 ±17.30a | 297.6 ±9.90a,b | 284.9 ±2.80a,b | 288.5 ±9.20a,b | 259.5 ±5.00b | 22.68 |
| b, ml/h | 2.6 ±0.14 | 3.2 ±0.20 | 3.4 ±0.02 | 3.6 ±0.19 | 3.8 ±0.34 | 0.46 |
| L, h | 0.10 ±0.016 | 0.11 ±0.003 | 0.10 ±0.006 | 0.10 ±0.003 | 0.12 ±0.014 | 0.02 |
| MPP, mg | 195.4 ±43.24 | 177.3 ±23.92 | 137.1 ±16.26 | 128.4 ±36.39 | 154.8 ±51.52 | 81.77 |
| N-NH3, mM | 19.7 ±0.10c | 22.2 ±0.10b | 25.2 ±0.69 a | 26.4 ±0.16 a | 27.0 ±0.02 a | 0.32 |
| abcMeans with different letters within same row are statistically different (9<0.05); A=maximum gas production; DM=dry matter; b=specific gas production rate; L=latency period; MPP=microbial protein production; SED=Standard error of difference between means. | ||||||
Gases and volatile fatty acids production. Gas production at 24 h of fermentation time was not affected by inclusion of BG (p>0.05; Table 4). However, total short-chain fatty acids (TSCFA) and propionate concentrations were different among treatments (p<0.05). Propionate increased linearly about 42% with the highest inclusion of BG as compared to CON (p<0.05). Moreover, TSCFA increased linearly with inclusion of BG, showing augmentations of about 32% in BG75 (p<0.05). Acetate and butyrate presented similar values among experimental treatments (p>0.05). On the other hand, GP24 showed similar values among experimental treatments. However, CH4 production reduced linearly with the inclusion of graded levels of BG (p<0.05). In this way, observed reductions in BG100 compared to CON were about 39%. Additionally, CH4:CO2 ratio reduced linearly due to the inclusion of BG (p<0.05). Otherwise, production of CO2 presented similar values among experimental treatments (p>0.05).
Table 4 In vitro gas, short chain fatty acids, methane and CO2 production of experimental treatments.
| CON | BG25 | BG50 | BG75 | BG100 | SEM | Lin | Quad | |
|---|---|---|---|---|---|---|---|---|
| GP24 | 252.1±4.9 | 229.5±13.7 | 205.4±10.3 | 203.1±4.2 | 199.3±21.0 | 27.9 | 0.020 | 0.260 |
| Ac, mM | 39.9±3.71 | 52.1±2.40 | 40.7±0.01 | 53.2±2.01 | 49.4±2.50 | 2.44 | 0.049 | 0.412 |
| P, mM | 12.8±0.18b | 13.3±0.55b | 11.2±0.36 c | 19.4±1.70a | 18.2±1.20 a | 0.98 | 0.003 | 0.125 |
| B, mM | 3.9±0.18 | 2.7±0.04 | 1.9±0.47 | 3.4±0.79 | 3.25±0.60 | 0.50 | 0.672 | 0.062 |
| TSCFA, mM | 72.4±2.00b | 82.3±3.99a | 65.2±0.66c | 96.2±3.44 a | 90.3±3.37a | 2.95 | 0.003 | 0.195 |
| Ac:P | 3.1±0.33a,b | 3.8±0.01 a | 3.6±0.11 a | 2.7±0.13 b | 2.7±0.04 b | 0.17 | 0.016 | 0.017 |
| CH4, ml/g | 49.2±0.97a | 42.8±2.56a | 37.3±1.88a | 34.2±0.70b | 30.5±3.23c | 2.09 | 0.001 | 0.357 |
| CO2, ml/g | 202.8±3.62 | 186.7±10.6 | 167.9±6.60 | 168.9±5.02 | 169.0±20.5 | 11.09 | 0.059 | 0.264 |
| CH4:CO2 | 0.24±0.00 a | 0.22±0.00b | 0.2±0.002b | 0.2±0.001c | 0.1±0.002d | 0.00 | 0.001 | 0.011 |
| abcMeans with different letters within same row are statistically different (p<0.05); GP24=Gas production volume at 24 h (ml/g DM); Ac=Acetate; P=Propionate; B=Butyrate; TSCFA: total short-chain fatty acids; Ac:P ratio=acetate:propionate ratio; SED=Standard error of difference between means. | ||||||||
DISCUSSION
Differences in the chemical composition between BG and AH affected some nutritional characteristics of the experimental treatments (Table 2). OM in the experimental treatments decreased due to a higher ashes content in BG. Nevertheless, lignin fraction decreased as effect of the inclusion of BG, which may have affected lignin-cellulose complexes. Moreira et al 25 observed that lignin-cellulose complexes limit surface availability for microbial degradation by avoiding their attachment to cell walls. Thus, if lignin fraction is reduced, microbes could be free to attach to carbohydrates contained in the cell wall increasing degradability of OM and DM consequently. In fact, no changes in IVDMD among treatments could be attributable to the reductions of the lignin fraction. Similar results were observed by Tufarelli et al 26. Moreover, increases in TPC and CT among treatments due to BG inclusion did not affect IVDMD since concentrations of CT are too low to show effects on digestibility, as previously stated by Jones et al 27. Likewise, Costa et al 28 reported that if low concentrations of CT are present, proteolytic bacteria can (after a short period of adaptation) respond by modifying their metabolism. Additionally, observed values of ME among treatments (7.3±0.86 Mcal/kg, as ME average between experimental treatments) are suitable to cover net energy for maintenance and gain requirements of growing steers averaging 600 pounds of live weight (recommended by NRC 16 in 6.57 Mcal/kg).
Aderao et al 29 observed a negative effect of high contents of NDF on gas production due a reduction in the microbial activity. Hence, reductions in the maximum gas production (“A” parameter) among experimental treatments may be a consequence of cellulose and hemicellulose degradation, which is a time-consuming reaction (Table 2). Murillo et al 30 observed that increasing fibre in diets, increased adaptation time (L) and decreased net specific gas production rate (b). However, this effect is not observed in the current study since similar values of “L” and “b” among experimental treatments were detected. Furthermore, no observed changes in MPP among treatments suggest that BG inclusion did not affect microorganisms. Nonetheless, a shift in microorganisms’ populations due the presence of CT in BG may not be neglected. In spite of CT are more likely to bind with proteins forming complexes which are more stable than those formed by CT and microorganisms, there is evidence of CT-protozoa complexes formation in ruminal fermentations.
In this way, Goel and Makkar 31 stated that there are two possible causes for increasing bacterial nitrogen yield: a) improved urea utilisation via bacterial uptake of urea-N recycled to the rumen in response to lower ruminal ammonia concentration, and, b) a “bacteria-sparing” effect arising from reduced protozoa numbers resulting in a reduction in the predation of bacteria. Therefore, since N-NH3 increased, the first asseveration may be neglected and the second might be considered (Table 2). In addition, if CT-protozoa complexes are formed, proteolytic bacteria would be free to attach and degrade protein which may explain ruminal N-NH3 increases. Hartanto et al 32 observed a similar behaviour when supplemented monensin and essential oils to goats’ diets, suggesting a reduction in protozoa growth. Likewise, Díaz-Carrasco et al 33 observed similar results with increased yields of bacterial nitrogen with diets containing CT than those with no CT. Figure 1 shows that asymptotic behaviours for gas production among treatments are reached after 40 h. However, clear reductions in cumulative produced gas are shown, thus affecting net production.
Despite that GP24 was not affected by BG inclusion among treatments (Table 4), maximum gas production (A) showed changes (P<0.05; Table 3). Nevertheless, these results suggest that BG inclusion effects seem to be representative after 48 h of fermentation time. Otherwise, substantial changes in SCFA were observed at 24 h of fermentation time (Table 4). Hassanat and Benchaar 34 observed a similar behaviour as CT obtained from Acacia mearnsii increased in vitro molar proportions of propionate. By increasing ruminal propionate production, one of the most important pathways for energy supply in ruminants should be enhanced. Propionate absorption through rumen walls contributes to the glucose synthesis as a result of the gluconeogenesis pathway which takes place in the liver 35,36. Williams and Coleman 37 reported that acetate and propionate were major fermentation products. However, in this research, acetate was not affected by BG inclusion. On the other hand, increases in TSCFA suggest an improvement of fermentation which may be explained through an increase of ruminal degradability of the protein due the formation of CT-protozoa complexes (Table 4). Additionally, reduced values in A:P ratio among experimental treatments indicate that production of acetic acid was lower than propionic acid (Table 4). In addition, Williams and Coleman 37 affirmed that reductions in A:P ratio are consistent with a reduction in the Gram-positive bacteria which are acetate-producers; A.P ratio is positively correlated with a proliferation of Gram-negative bacteria, which are propionate-producers. Regarding to the latter, there is an increase in N-NH3 which indirectly suggests an increase in the microbial protein; nevertheless, the MPP values obtained in this study were similar among treatments, therefore the theory cannot be supported. Otherwise, a switch among the proliferation of Gram positives and negatives is likely to occur.
Murillo-Ortiz et al 10 observed reductions in methane production with Eichhornia crassipes as substitute of AH, which also affected CO2 production. These authors attributed these changes to the presence of CT in Eichhornia crassipes, reporting CT concentrations ranging from 28 to 400 µg/mg. Despite of the lower concentrations of CT presented in this study, no changes in CO2 production were observed. Nevertheless, based on observations made by Gomaa et al 8, these reductions in methane production might be attributable to CT contained in BG. These authors proposed two mechanisms for reducing methane production by CT in ruminants: a) by reducing fibre digestion, decreases methane by CO2 synthesis pathway affecting methanogenesis, or b) by direct inhibition of methanogens and/or their expression. CO2 production is not affected by inclusion of BG in the experimental treatments, but methane is. By measuring CH4:CO2 production ratio, some pathways may be elucidated. A reduction in methane and an increase in CO2 were observed, thus affecting CO2 reduction pathway. However, there is a constant CO2 production and a reduction in methane generation. These changes led to a reduction in CH4:CO2 ratio, indicating CO2 consumption. Murillo-Ortiz et al 10 observed a similar behaviour and suggested two possible methane reduction pathways: a) methane production was being affected through the acetate pathway, and b) the presence of CT offers an inhibitory action in growth and/or expression of methanogens. Therefore, increases in acetate are observed and based on the mentioned mechanisms of reduced methane production, the acetate pathway is not likely to occur. Additionally, acetate and propionate increased proportionally as observed in A:P ratio. Moreover, methanogens capable of producing methane from acetate oxidation are not that abundant in the rumen and the required time for the reaction to occur is limited 37.
The results presented in this study agree with those reported by Saminathan et al 38 who observed similar MPP among treatments and detected that most methanogens were reduced with the presence of CT but some other archaeas increased. Likewise, Jafari et al 39 observed a reduction in methanogens but an increase in total bacteria with AH substituted by leaves of Carica papaya. Similarly, Hartanto et al 32 observed a negative correlation among protozoa and methane production on in vitro fermentations, indicating that an augmentation in CO2 production would be expected by decreasing methanogens populations since there would not be more microorganisms consuming it. Nevertheless, these changes are not observed, suggesting that an inhibition of the endogenous methanogenesis is more likely to occur.
As conclusions, obtained results suggest an endogenous methane synthesis reduction. Dietary inclusion of 75% of BG reduced 31% in vitro ruminal methane production without affecting CO2 production and fermentative parameters like acetate, butyrate and gas production kinetics. Therefore, BG inclusion into a mixed ration as a partial replacement of conventional forage sources (e.g., AH and oat straws) emerges as an environmentally friendly way to use non-conventional forages into beef cattle diets which require minimal production conditioning and do not compete with human feeding.

