


 English (pdf)
 Article in xml format
 Article references
 Send this article by e-mail
 Cited by SciELO
  Cited by Google
  Similars in
SciELO
Similars in
SciELO  Similars in Google
 Permalink
Introduction
Coronavirus-induced disease 2019 (COVID-19) was classified by the World Health Organization as a pandemic due to its alarming levels of spread and severity in almost all countries 1)(2. Its serious impact forced the creation of therapeutic and preventive tools as well as public health policies capable of being adjusted in real time to the rapidly changing demands caused by its rapid expansion. Given that the appearance of COVID-19 in humans occurred very recently and its expansion has been very rapid, there is not yet a complete and systematic understanding of its transmission patterns, clinical characteristics, and risk factors for infection, which hinder the decision-making processes that minimize the impact of the disease 3. Therefore, it is essential to develop new methods that allow evaluating and predicting the dynamics of the pandemic over time.
Mortality is estimated to be around 3-4% of cases 4 , with the highest risk groups being older adults with chronic diseases such as advanced diabetes, hypertension, heart disease, respiratory diseases, or cancer. 5 . Three of the most affected countries by the pandemic are China, Belgium, and South Korea, which have reported 81,708, 20,814 and 10,284 cases respectively, as well as 3.331, 1.632 and 186 deaths as of April 6, 2020, according to Worldometer.info6).
To solve the problems involved in epidemiological analysis and causal mathematical models, Rodríguez et al., have designed various mathematical and physical methodologies from an acausal perspective. This is conducted without considering the causal variables that can influence the variation of dynamics and focusing on its mathematical characteristics by making use of physical and mathematical theories such as probability, the random walk probabilistic model, second-order differential equations, the K-ratio, and recurring probability 7)(8)(9)(10. Probability is defined as a dimensionless mathematical measure of the possibility of the occurrence of an event in the future and constitutes the foundation of most of the mentioned methodologies 11 .
Among these methodologies, it is worth highlighting predictions achieved in ranges of weeks in municipalities, such as a weekly prediction method of malaria outbreaks in the municipalities of Colombia based on the probability and the K-ratio, which achieved a percentage of success of 99.86%. This constitutes a system that overcomes the problems of models based on endemic corridors, as well as the drawbacks of considering chance as the predominant factor in the dynamics 9) . A method based on recurrent temporal probabilistic prediction was also developed, which allowed to obtain the number of malaria outbreaks and their duration in epidemiological weeks in different prototypical municipalities of Colombia. This permitted the dynamics of the epidemic to be evaluated in real time and to quantify when the onset of an outbreak is more probable with differences in order of magnitude between 10 and 103 (10). These methodologies are useful to develop surveillance and early warning systems for malaria outbreaks in Colombia.
The purpose of this study is to develop a predictive methodology based on the theory of probability of the dynamics of the number of COVID-19 cases applied in China, Belgium, and South Korea to evaluate the dynamics in time intervals of 8 days and make comparisons of their behaviors.
Materials and methods
Daily reports of the number of COVID-19 cases from China, Belgium, and South Korea were analyzed, which were reported by the Worldometer.info portal 6 between February 15 and April 4, 2020. These countries belonged to the group of countries that reported the highest number of COVID-19 cases worldwide. The reason why this data was chosen was to confirm the applicability of the method for a given time frame and not to provide simulations that could not be confirmed in the future.
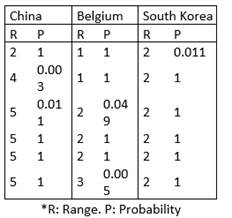
For the probability analysis of the dynamics, the following ranges of the number of daily COVID-19 cases were defined in the table 1.
Table 1 Defined ranges for classifying the number of daily COVID-19 cases in China, Belgium, and South Korea.
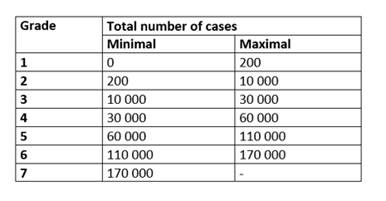
Consequently, the range to which each of the daily values reported for each country corresponded was determined. From these data, the frequency of appearance of each range in the evaluated days and the probability value associated with these were determined ranges for each country. The probability value associated with the range corresponding to each day was established below using equation 1.
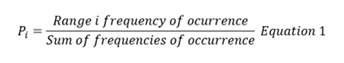
Equation 2 was applied to determine a probability value for the entire individual dynamic of each country by multiplying each of the probabilities associated with each day.
Subsequently, this procedure was repeated but taking time intervals of 8 days in such a way that days 1 to 8 correspond to the first dynamic, days 9 to 16 to the second dynamic, and so on. In this way, it was possible to establish a probability value associated with each of these time intervals for each country. These values were used to evaluate the characteristics of the pandemic expansion in the three evaluated countries and to compare their behavior.
Results
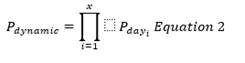
Without considering the frequencies and probabilities of 0, the values of the frequency of appearance of the ranges evaluated between 6 and 52 were presented for China, 7 and 23 for Belgium, and 2 and 42 for South Korea, as well as probability values between 0.081 and 0.703; 0.14 and 0.46; and 0.04 and 0.84 for these three countries respectively. The results show that the daily dynamics of the number of COVID-19 cases are not equiprobable, but that there are ranges that tend to be repeated. Based on this, it is possible to establish differences in the dynamics from the study of the distribution of frequencies and probabilities of the ranges evaluated. Thus, when observing the highest probability values for each country, it is observed that range 5 presents a probability of 0.703 for China while in Belgium the most probable range is 1, with a probability of 0.46. On the other hand, in South Korea the highest probability is 0.84, corresponding to rank 2 (Table 2).
Table 2 Frequency and probability of the established ranges for China, Belgium, and South Korea of the number of daily COVID-19 cases.
When establishing the total probability of the dynamics by multiplying the probabilities found throughout the dynamics of each country with equation 2, it was found that China presented a probability of 1.21E-30 while Belgium and South Korea had probabilities of 2.03E-22 and 3.15E-12 respectively. These results show clear differences between the evaluated dynamics of the number of COVID-19 cases over time, with notable differences of 8 and 18 orders of magnitude between China, Belgium, and South Korea accordingly, and 10 orders of magnitude between South Korea and Belgium.
Finally, 6 probability subspaces of 8 days were presented, the evaluations of the probability subspaces of the 8-days intervals are presented in Table 3. The results showed that from the three evaluated countries, China was the one with the strongest and fastest expansion of the number of COVID-19 cases. This is evident from the beginning of the timeline since the values of this variable were located in range 2 to later jump to range 4 and then remain stable for 3 intervals in range 5. In contrast, Belgium lasted two 8-day intervals in range 1, 3 intervals in range 2, and an interval in range 3, showing a much less drastic rise. Finally, South Korea maintained a stable behavior in range 2 during the 6 intervals evaluated, showing the most stable behavior of the three countries and therefore, a much more optimal management of the pandemic.
Discussion
This is the first work in which space-temporal predictions of the dynamics of the number of COVID-19 cases in China, South Korea, and Belgium are established using an innovative methodology. This methodology is based on probability theory and the establishment of ranges of specific interest in analogy to the energy levels at which electrons are found in the context of quantum physics. It allows the predictions of the number of COVID-19 cases from probabilities of intervals of 8 consecutive days, which also allows the quantification of the differences between the dynamics of the different countries.
This methodology is applicable and functional for epidemiological follow-up processes and constitutes a support tool for decision-making at the level of public health policies considering that it can be easily applied by the entities that carry out these follow-ups and that try to predict COVID 19 dynamics in real time. In view of the urgency of systematizing predictions over time, this methodology can be applied anywhere, anytime, and in any country in the world. Another advantage of its application is its independence from causal factors in the same way as the theories of modern physics, which eases the achievement of practical predictions in a simpler way than with multi-causal models. It is applicable to the evaluation of the global impact of the specific containment measures established by each country such as preventive isolations, quarantines, use of face masks and so forth.
Aiming at predicting the dynamics of the pandemic in each country, several models that seek to clarify this phenomenon have already been made 12) (13) (14) (15) (16) (17). As an example, thanks to statistical models, it has been possible to predict that the demand for medical supplies will exceed the capacity of available resources in the coming weeks in the United States 13 . A model that evaluates the behavior of the epidemic in China using artificial intelligence was also developed, it predicted a decline in late April and a possible outbreak if the quarantine was lifted 14 . These and other mathematical processes pretend to establish relationships between some associated factors - such as comorbidities, age, sex, among others - and the dynamics of the number of cases of various diseases 16) (17).
This approach, which seeks causal relationships, presents difficulties in establishing and quantifying the relationship between these factors and changes in disease dynamics. Unlike these models, the methodology proposed here is based on physical and mathematical laws that address this problem and establish predictive quantitative values from an acausal perspective. In the same way that in current theoretical physics, the causes that determine the behavior of phenomena are not conceived, but the mathematical orders that allow the understanding of their nature are established. The approach that prevailed in this study was that the phenomena work in a "charged" probabilistic way in analogy with the energy levels of the electrons, which solves the problem of random fluctuations 18) .
This acausal perspective previously allowed the development of innovative methodologies for the prediction of malaria outbreaks in Colombian municipalities 9 as well as the quantification of their quantity and duration 10 based on physical and mathematical theories. Similarly, this approach has led to the development of diagnoses and predictions in other areas of medicine, such as predictions of mortality 19) , peptide binding 20 , diagnoses of cell morphometry of preneoplastic and neoplastic cells of the cervix 21 , neonatal and adult cardiac dynamics 22) (23), and temporal predictions of the number of CD4+ T lymphocytes in patients with HIV/AIDS 24 . These works demonstrate the utility of studying medical phenomena from physical and mathematical theories, revealing underlying mathematical orders to these phenomena

