


Services on Demand
Journal
Article
 English (pdf)
 Article in xml format
 Article references
 Send this article by e-mail
Indicators
-
 Cited by SciELO
 -
 Access statistics
Related links
-
 Cited by Google
 -
 Similars in
SciELO
Similars in
SciELO -
 Similars in Google
Share

 Permalink
Ingeniería y Desarrollo
Print version ISSN 0122-3461On-line version ISSN 2145-9371
Ing. Desarro. no.24 Barranquilla July/Dec. 2008
Applicability of computational fluid dynamics to simulate ozonation processes
Edgar Quiñones Bolaños *, Javier Trujillo Ocampo**, Luis Cortés Rodríguez***
* Doctor en Ingeniería Ambiental, University of Guelph, Canadá. Docente de la Facultad de Ingeniería, Universidad de Cartagena.
Correspondencia: Avenida del Consulado, Universidad de Cartagena, Facultad de Ingeniería, Cartagena de Indias (Colombia). equinonesb@unicartagena.edu.co
** Doctor en Física, Universidad del Valle. Docente de Facultad de Ciencias Exactas y Naturales, Departamento de Físicas, Universidad de Cartagena. jatrujil@hotmail.com
*** Magíster en Física, Universidad del Valle. Docente de la Facultad de Ciencias Exactas y Naturales, Departamento de Físicas, Universidad de Cartagena. lcortes60@hotmail.com.
Correspondencia: Avenida del Consulado, Universidad de Cartagena, Facultad de Ingeniería, Cartagena de Indias (Colombia).
Fecha de recepción: 11 de abril de 2008
Fecha de aceptación: 29 de agosto de 2008
Resumen
Este artículo presenta un novedoso modelo matemático que integra los principios de la dinámica de fluidos computacional, la cinética del ozono y las teorías de inactivación microbiana del ozono para pronosticar la desinfección del agua en columnas de burbujas. El modelo se describe mediante las ecuaciones de Navier- Stokes que caracterizan la hidrodinámica de la mezcla agua-aire y dos ecuaciones de transporte usadas para rastrear los micro-organismos y el ozono dentro de la columna de burbujas. La aplicabilidad del modelo fue demostrada comparando resultados numéricos obtenidos con el modelo contra datos experimentales obtenidos de ensayos realizados en una planta de ozono construida a escala piloto. Se obtuvo una excelente correlación en términos del ozono disuelto y el grado de inactivación de microorganismos sin la necesidad de asumir predeterminados patrones de recirculación del agua o de dispersión del ozono. También se pudo confirmar que en algunos casos, la presencia de zonas muertas o de recirculación podría afectar el tiempo de contacto efectivo para que la desinfección ocurra. Esto sugiere que existe una gran oportunidad, en la práctica, para mejorar la eficiencia de los reactores de desinfección del agua con ozono. La etapa siguiente de esta investigación es confirmar los pronósticos numéricos del modelo con contornos reales del proceso de inactivación.
Palabras claves: Dinámica de fluidos computacional, desinfección, transferencia de masa, ozonización.
Abstract
This paper presents an integrated mathematical model based on the principle of computational fluid dynamics along with the kinetics of ozone decay and microbial inactivation to predict the performance of ozone disinfection in fine bubble column contactors. The model can be represented using a mixture two-phase flow model to simulate the hydrodynamics of the water flow and using two transport equations to track the concentration profiles of ozone and microorganisms along the height of the column, respectively. The applicability of this model was then demonstrated by comparing the simulated ozone concentrations with experimental measurements obtained from a pilot scale fine bubble column. Excellent agreement was obtained in terms of the dissolved ozone and the degree of microorganism inactivation without any pre-assumption about flow backmixing or dispersion level. It was also confirmed that in some cases, the presence of dead space or short-circulation could greatly affect the effective contact time for the disinfection to occur. This suggests that the great opportunity may exist to improve the efficiency of ozonation contactors in practice. The future work of this investigation is to confirm the numerical prediction of inactivation contour diagrams.
Key words: Computational fluid dynamics, disinfection, mass transfer, ozonation.
INTRODUCTION
Ozonation, along with chlorination, is one of the most effective processes for disinfection of microorganisms from water. The existence of more than 700 full-scale ozonation plants in France, 100 in Germany, 250 in United States and more than 35 in Canada, each of them serving more than 10,000 people, demonstrates the reliability of the process [1], [2], [3], [4], [5]. Since then, many models have been proposed to simulate the performance of ozonation contactors [6], [7], [8], [9], [10]. For example, [6] developed a two-dispersion-equations model based on diffusion laws, two-film mass transfer theory, and first-order rate equations to simulate ozone transfer and the apparent kinetics of ozone decomposition in water. [8] proposed the use of either the axial dispersion model (ADM) [11], or the back-flow cell model (BFCM) [12], to integrate the non-lineal mixing, mass transfer and ozone decay process as a whole. [10] proposed the use of computational fluid dynamics (CFD) techniques to simulate ozonation contactors by predicting mass transfer profiles and residence time distribution from mass, momentum and energy equations. Recently, [13] proposed CFD simulations to study water disinfection with low Reynolds number to account for relatively low turbulence levels similar to those occurring in chlorine contacts tanks. In this way, the simulation of ozonation process has stepped into the world of computational analysis.
The goodness of this approach is that they remove the hydrodynamic assumptions made for the gas-liquid flow of plug flow, perfect mixing, tanks-in-series, uniform concentration or uniform dispersion in modelling the performance of disinfection contactors. Other advantage of applying CFD techniques is that different inactivation contour diagrams can be analyzed for the entire contactor without carrying out expensive and tedious tracer studies [14], [15].
The literature reviewed has revealed that the application of CFD methods to simulate ozonation process is relatively new, less than ten years. It means that the development of computational ozonation models is at its starting stage and that there is not yet an accepted universal model. It also means that the existing ozonation models need further development and research to test and improve them for a variety of contactor configurations and raw water conditions prior to their universal acceptance.
As mentioned before, an accurate model is needed to optimize not only the performance of existing plants but also the design of future ozonation contactors. Currently, designers rely on simplified models that neglect many of the physical and chemical aspects of ozonation processes, which make environmental protection agencies around the world issue strict CT values for inactivation of viruses by ozone, therefore, leading to high cost designs. This has been one of the major reasons that have limited wider applications of ozonation systems for water and wastewater treatment. The development of an appropriate model will consequently bring cost of ozonation contactors down and the technology will be then affordable for small and large communities to improve the quality of their drinking water system.
Based on the urgent need to optimize process performance and design, the main objective of this research was to develop a computational ozonation model that can be used to simulate, therefore, to effectively control and design ozonation contactors for disinfection of microorganisms in water treatment.
2. FUNDAMENTALS
To model ozone disinfection in bubble columns, it is necessary to quantify the rates of various physical transport and chemical oxidation processes. Ozone mass transfer from gas into a liquid phase can be described by the well-known two-film model as:
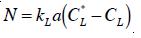
where kL = local liquid mass transfer coefficient; a = specific interfacial area; and CL and CL; the saturation and local dissolved ozone in the liquid phase, respectively. After dissolved in water, ozone decays through both autodecomposition and oxidation of impurities due to its extremely oxidative properties [16]. A pseudo-first-order expression with respect to the dissolved ozone is used to quantify the overall decomposition of ozone in water [1].
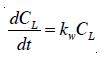
where kw is the specific ozone-utilization rate.
When ozone is used as a primary disinfectant, the third process component of ozonation is the rate of microbial inactivation. A first order decay process [17] with respect to surviving microorganisms is used to describe the rate of inactivation expressed as:
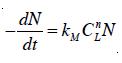
where N = the concentration of surviving microorganisms; kM = rate constant of the Chick-Watson model; and n = the empirical coefficient of dilution. The empirical coefficient, n, is an indication of which factor, the contact time or disinfectant concentration is more predominant during the inactivation process. If n is greater than one, the disinfectant concentration is the dominant factor in determining the inactivation rate, while if n is less than one, the contact time is more important than the disinfectant concentration [1]. In most cases, USEPA concluded that n is close to 1 for chemical disinfectants such as ozone and chlorine [18].
Finally, the effectiveness of disinfection in bubble columns depends on two more parameters: the residence time of ozone in the contactor and the mixing intensity of the gas and liquid flow. The principal modelling alternative is to find the ozone residence time distribution and the mixing characteristic of the column from computational fluid dynamics [19]. Therefore, an integrated model could achieve the true predictive potential by coupling a proper CFD model with a system model to describe the ozone mass transfer and ozone disinfection in bubble columns.
3. METHODOLOGY
To achieve the planned objective there are three preliminary steps to consider and discuss. They are: a) the type of contactor to be analyzed, b) the compartments of the contactor to be discussed, b) the flow regimes to be modeled and c) model development. A good definition of these topics determines the acceptance, use and applicability of the model to be developed and, even more, they are critical factors to successfully implement ozonation processes in water treatment plants.
3.1. Types of Ozonation Contactors
One of the major steps in modelling a phenomenon is to define it in space and time, i.e., to define the domain in which the phenomenon takes place. In our case of ozonation phenomenon, the physical and chemical processes are usually looked up at steady state therefore they are independent of time. However, the space is defined by the configuration of the contactor in which ozonation takes place. Therefore, taking this step into our research, a fine bubble diffuser was analyzed during this investigation.
Bubble diffuser contactor (Figure 1) is the most frequently used type of contactor throughout the world [1]. This type of contactor offers the advantages of no additional energy requirements, high ozone transfer rates, process flexibility, operational simplicity, and no moving parts [4]. It has been shown that bubble diffuser contactors work well at low to medium ozone concentrations (1 to 4 % by weight, in the gas phase). However, at higher ozone concentrations and low gas flow rate, gas channelling and inadequate gas-liquid mixing may occur which would reduce drastically the efficiency of the contactor in transferring ozone into the water [7]. A summary of the advantages and disadvantages of bubble diffuser contactors is given inTable 1.
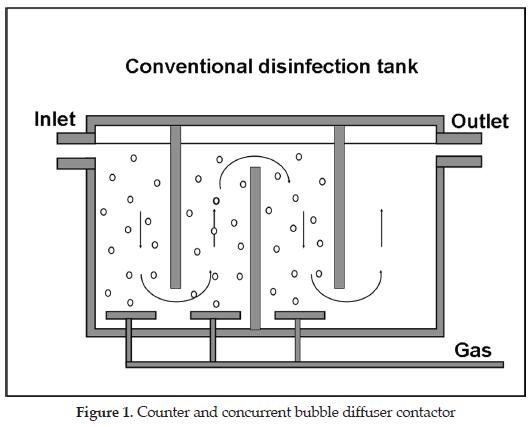
Figure 1 shows a typical four-stage ozone bubble diffuser contactor. This illustration shows an alternating concurrent/countercurrent arrangement. Usually, the number of stages can vary from two to six for ozone disinfection, with the majority of plants using two to six for ozone disinfection [1].

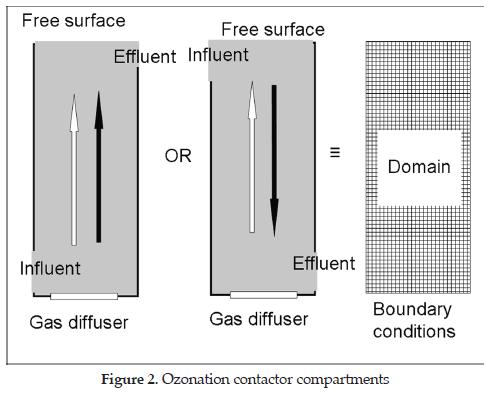
3.2. Ozonation Contactor Compartments
A second step in modelling ozonation contactors is to isolate the individual compartments or sections of the contactor having similar performance characteristics. This helps to organize and simplify the process of modeling. In bubble diffuser contactors, there are sections in either a single phase (liquid) or two-phase (gas/liquid) flow prevails. It means that these sections can be analyzed separately, in view of the modeling process, as single compartments from the contactor to define the computational domain objective of this research. Figure 2 illustrates these compartments. It shows that the different conditions of two phase flow can be modeled using a single computational domain in which the boundary conditions may change from compartment to compartment of the contactor under study.
3.3. Flow Regimes in Ozonation Contactors
The literature reviewed reveals that three flow regimes have been identified in ozonation contactors: homogeneous (bubbly flow), heterogeneous (churnturbulent flow) and slug flow. The homogeneous and the heterogeneous regimes are usually the flow fields found in industrial applications [20], [21]. However, the homogeneous is the optimum condition for gas-liquid contactors since mass transfer processes and the dispersion of ozone in both the gas and the liquid phase are easier to model and control. Therefore, the homogeneous flow regime will be the flow field to be modelled and analyzed during this investigation. This selection is supported by many other investigations that have been undertaken in the past to model the hydrodynamics of gas-liquid contactors under the homogeneous regime [10], [22], [23], [24], [25], [26], [27].
3.4. Model Development
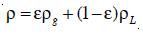
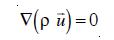
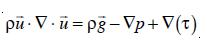
A Computational Fluid Dynamics model utilizes the Navier-Stoke equation to simulate the flow distribution within an ozonation contactor. The set of Navier Stoke equations can be applied to two-phase flows if the dispersed phase elements are small, the overall fluid density is constant and if the momentum of the particles or bubble can be neglected [23]. However, the density p must be chosen as the effective density of the dispersion, and similarly, the usual viscosity must be replaced by some effective viscosity, µ. Taking local averages, the effective density is defined as
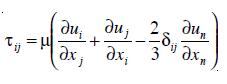
The effective viscosity has been characterized by different formulations. In this work µ is defined as

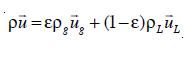
where E is the volume fraction or the local holdup of the gas phase, µL is the viscosity of the liquid phase, pg the density of the disperse gas phase and pL the density of the liquid phase. At this stage, it is also necessary to introduce the relationship between the velocities of both phases and the gas-liquid mixture.
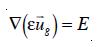
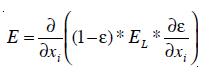
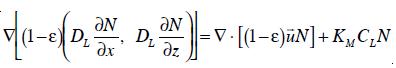
Finally, to simulate mass transfer from a numerical point of view, it is necessary to model the transport of ozone in both the liquid and the gas phase. In the liquid phase, the transport of ozone is represented by a transport equation that includes both ozone decay kinetics and ozone mass transfer terms [10]. Thus, the general transport equation of dissolved ozone in the liquid phase can be expressed:
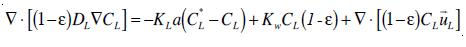
where DL is the eddy diffusivity of ozone in the liquid phase. On the other hand, the transport of ozone in the gas phase is only affected by the mass of ozone transferred from the gas phase to the liquid phase. Neglected dispersion of ozone in the gas phase, it can be written:
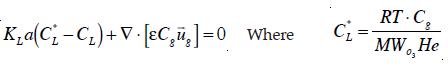
Cg is the concentration of ozone in the gas phase. He the Henry's law constant, R the universal gas constant = 8.315 kJmol-1K-1, T the absolute temperature and MWo3 the molecular weight of ozone = 48 gr. Thus, the equations to be solved are 7, 8 and 12. Additional assumptions that must be made to predict the performance of inactivation include:
a) isothermal and steady state conditions;
b) mass transfer resistance is confined to liquid side alone;
c) the rate of ozone decay is pseudo first order in the liquid phase, and it is negligible in the gas phase; the inactivation of microorganisms conforms to the Chick-Watson law with the empirical coefficient of dilution = 1;
d) gas and liquid densities constant along the height of the column;
e) Henry's law applies for ozone gas and bubble coalescence and redispersion can be neglected
Application
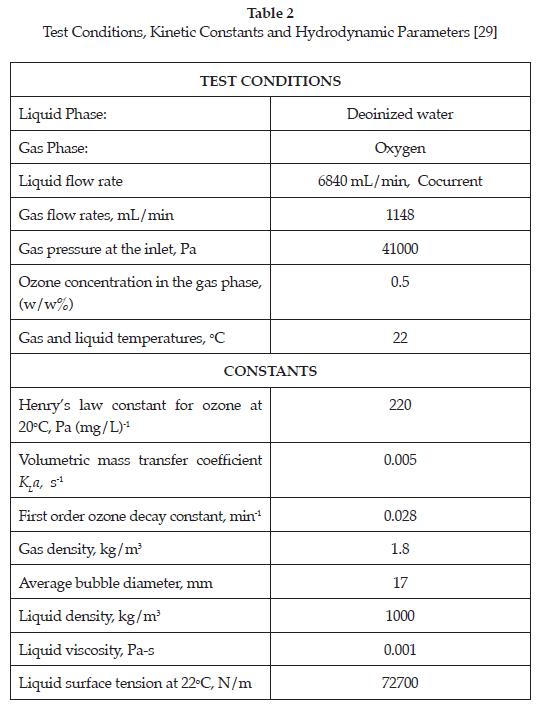
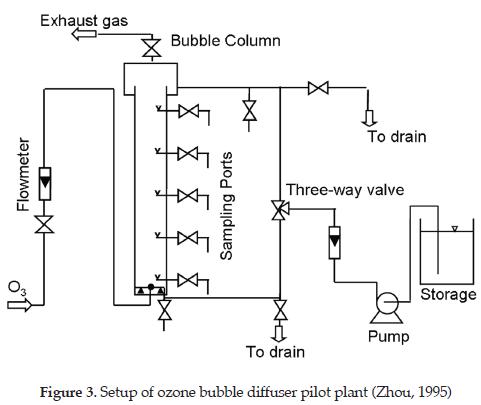
To demonstrate the application of this model, the numerical results were compared to existing experimental dissolved ozone profiles gathered from a pilot scale bubble column designed for ozonation of deionised water. Figure 3 shows a schematic of the actual ozonation apparatus. The ozone contactor is a cylindrical column with an inside diameter of 100 mm and height of 1750 mm. The gas diffuser is a 25 mm sphere located 5 mm above the bottom of the contactor and the liquid distributor a 10 mm ring perforated pipe facing downward at 15 mm from the bottom to provide a well-mixed bubbly flow in the column. The experimental conditions and the kinetic constants are summarized in Table 2. For a complete description of the column and the experimental conditions, see [29].
3.4.1. Computer Implementation
To solve the set of governing equations of the system (Equations 7, 8 and 12), they were implemented in a FEMLAB® platform, a computer software that solves PDEs using the finite element approach. The optimum conditions for numerical calculations were obtained using triangular mesh with an average element area of 1.0x10⁻⁵ m2, which leads to 17408 triangular elements with 9006 nodes for the flow domain. The maximum quality of the elements was 0.999988 and the minimum 0.71. This chosen resolution deemed adequate to accurately describe the column geometry while maintaining acceptable execution time (about 1 hour for 1,000 interactions).
The governing equations were solved using, first an invariant form of the damped Newton method to find an initial guess for the prime variables of the problem and then, the Lagrange constraint handling method to close the solution. It is an iterative process that ends when a suitably accurate solution is obtained. For a detail description of this solution technique refer to [30], defining flow boundary conditions and solving the model. The column bottom, walls and internals were considered to be non-friction surfaces with a prescribed slip wall condition. The outlet is considered to be at constant pressure.
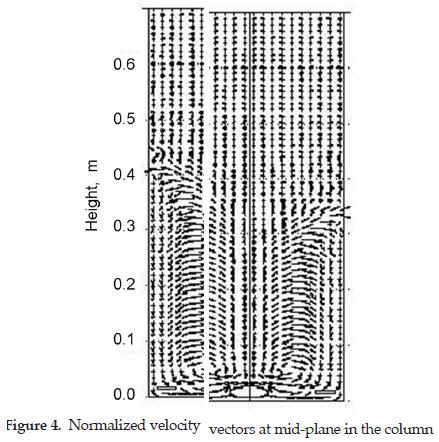
4. RESULTS AND DISCUSSIONSTo analyze the applicability of using computational fluid dynamics to simulate ozonation processes, the numerical results of the combined hydrodynamics of the gas-water flow, the ozone concentration profiles and the inactivation contour diagrams were discussed. Figure 4 shows that there is a recirculation pattern in the first 40 cm of the column. Each arrow, in Figure 4, represents the normalized computed velocity vector at the mid-plane of the bubble column. On the other hand, Figure 4 also shows that the flow above 40 cm assembles a perfect plug flow where the flow is fully developed and there is slight variation of the fluid velocity across the reactor. This flow pattern agrees with experimental observations reported in the literature over bubble columns [31], [32], [20].
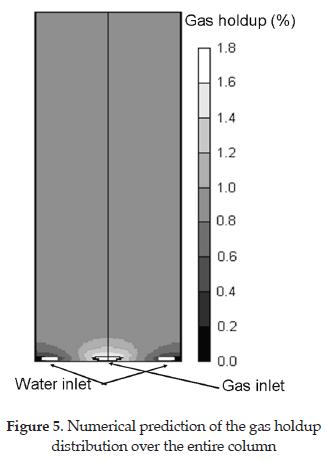
Consecutively, Figure 5 shows the gas distribution throughout the column for a combination of gas and liquid flow rate of 1148.0 and 6850.0 mL/ min, respectively. It reveals that the maximum gas holdup is near the air diffuser, and then rapidly approaches to a constant value. It also reveals the existence of a "dead zone" in each of the lower corners of the column where there is little flow recirculation of the gas phase. The gas-holdup in the bulk region of the column was compared to those experimental data reported by [27]. In this simulation, the predicted gas holdup was 0.9 % at the bulk of the column, which is comparable to 0.75 % observed by (Zhou and Smith, 2000), and is considered to be acceptable. An interesting point to note is that this gas holdup of 0.9 % was found assuming a slip velocity of 3.3 m/s which using the stoke law for the terminal of a single rising gas bubble leads to an average bubble diameter of 1 mm compared to 0.8 mm reported by [27] using 2D laser particle dynamics analyzer. This leads to the conclusion that the model can accurately predict the hydrodynamics of two-phase flow in bubble columns.
4.1. Ozone Concentration Profiles
Figure 6 shows the numerical simulation of the dissolved ozone in the liquid phase. This simulation is in great agreement with experimental observations reported previously. It clearly shows that the dissolved ozone is uniformly distributed along the height of the contactor with a maximum occurring somewhat in the middle of the column [33]. One interesting point to discuss is the effects of the lateral and vertical mixing on the dissolved ozone profiles. Figure 6 shows that at the lower corners of the column the ozone transfer is almost zero. This may be due to the low recirculation of the water and gas in this zone of the reactor. In general, the computational model can reasonably predict the dissolved ozone in bubble columns. In the bulk zone of the column the simulation indicates that the variation of dissolved ozone both in the lateral and vertical direction is insignificant.
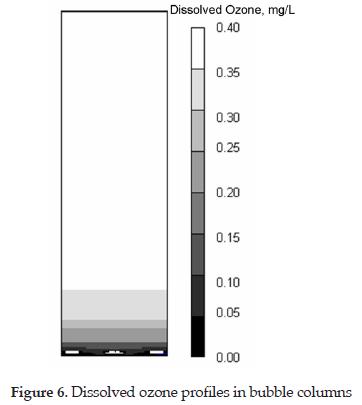
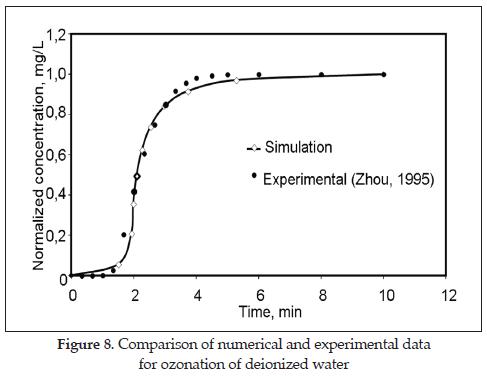
Figure 8 shows the normalized predicted dissolved ozone profiles obtained by fitting the computational model to the experimental data. The good agreement between predictions and observation was confirmed by the correlation coefficient of 0.94. The controlling parameter was the eddy diffusivity (DL) which, under the tested condition, is 1.8x10⁻⁷ m2/s, two order of magnitude greater that the normal diffusivity of ozone in water. This is expected because the turbulence created by the liquid and gas flow increases the dispersion of ozone in the liquid phase [34].
4.2. Prediction of Inactivation Efficiency
To predict the efficiency of inactivation in a bubble column, one more transport equation was added to describe the rate of inactivation along the height of the column. After accounting for transport of surviving microrganisms (N) in the liquid phase, it becomes
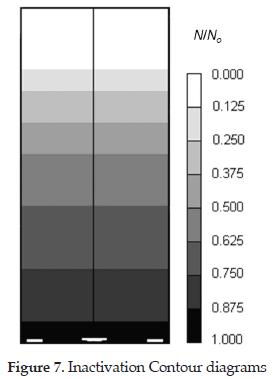
Equation (14) was solved independently after the gas-liquid mixture velocity and dissolved ozone profiles are determined. Figure 7 shows the predicted profile for microorganism inactivation. It reveals that in the first 10 cm of the column, the initial concentration of microorganisms (No) is not affected by the ozone concentration in the liquid phase because of the short contact time. However, as the liquid rises through the column the inactivation of microorganisms is taking place finding that at the top of the column, there are not surviving microorganisms. The future work of this investigation is to confirm the numerical prediction of inactivation contour diagrams.
CONCLUSIONS
The results of this study revealed that using the Navier Stokes equations for a combined fluid flow of gas and water mixture is a good approach to simulate the hydrodynamics of bubble columns operated under a homogeneous regime, without any pre-assumption about flow backmixing or dispersion level. Dissolved ozone and the degree of inactivation can well be predicted using CFD coupled with transport models for disinfectant and pathogenic microorganisms. The results also confirmed that in some cases, only a portion of the reactor is actually available to provide the effective contact time for the disinfectant to inactivate microorganisms. This differentiation of the zones of low and high inactivation levels would allow engineers to improve the efficiency of ozonation contactors. In general, this new integrated approach can be effectively used to study mixing flow characteristics and inactivation processes to improve process performance in existing water treatment plants and provide an economical and efficient tool in designing new ones.
Acknowledgements
The authors acknowledge the collaboration of all school of engineering personnel of the University of Guelph in supporting to this project.
REFERENCIAS
[1]LANGLAIS, B., RECKHOW, D. A. and BRINK, D. R. Ozone in Water Treatment. Application and Engineering. Lewis Publishers, Michigan-USA, 1991. [ Links ]
[2]COTRUVO, J.A., CRAUN, G.F. and HEARNE, N. Providing Safe Drinking Water in Small Systems. Technology, Operations, and Economics. Lewis Publisher, NSF International, World Health Organization and Pan American Health Organization, New York, 1999. [ Links ]
[3]OZONIA (1999). Ozone data and applications (last updated: 05/17/1999). Ozonia Ltd. Duebendorf, Switzerland. URL: http://www.ozonia.ch/,Accessed:May212001. [ Links ]
[4]USEPA. Guidance Manual Alternative Disinfectants and Oxidants. United States Environmental Protection Agency - EPA 815-R-99-014. URL: http://www.epa.gov/ogwdw000/mdbp/pdf/alter/.OfficeofDrinkingWater, USEPA Washington U.S.A, 1999. [ Links ]
[5]GOTTSCHALK, C., LIBRA, J.A. and SAUPE, A. Ozonation of Water and Waste Water. A Practical Guide to Understanding Ozone and its Application. WILEY-VCH, Toronto, 2000. [ Links ]
[6]MARIÑAS, B. J., LIANG, S. AND AIETA, M. (1993). Modeling Hydrodynamics and Ozone Residual Distribution in a Pilot-Scale Ozone Bubble-Diffuser Contactor. Journal AWWA, March, pp. 90-99, 1993. [ Links ]
[7]SCHULZ, C. R., SCHAFRAN, G. C., GARETT, L. B. and HAWKINS, R. A. Evaluating a High-Efficiency Ozone Injection Contactor. Journal AWWA, August, pp.85- 99, 1995. [ Links ]
[8]SMITH, D. W. and ZHOU, H. Theoretical Analysis of Ozone Disinfection Performance in a Bubble Column. Ozone Science & Engineering, Vol. 16 pp. 429-441, 1994. [ Links ]
[9]MUROYAMA, K., NORIEDA, T., MORIOKa, A. and TSUJI, T. Hydrodynamics and Computer Simulation of an Ozone Oxidation Reactor for Drinking Water. Chemical Engineering Science, Vol. 54 pp. 5285-5292, 1999. [ Links ]
[10]COCKX, A., DO-QUANG, Z., LINÉ, A. and ROUSTAN, M. Use of Computational Fluid Dynamics for Simulating Hydrodynamics and Mass Transfer in Industrial Ozonation Towers. Chemical Engineering Science, 54 pp. 5085-5090, 1999. [ Links ]
[11]DECKWER, W. D., BURCKHART, R. and ZOLL, G. Mixing and Mass Transfer in Tall Bubbles Columns. Chemical Engineering Science, Vol. 29 pp. 2177-2188, 1974. [ Links ]
[12]NGUYEN-TIEN, K., PATWARI, A.N., SCHUMPE, A. and Deckwer, W.-D. Gas-Liquid Mass Transfer in Fluidized Particle Beds. AICHE Journal, Vol. 31 n.° 2, pp. 194-201, 1985. [ Links ]
[13]RAUEN, W. B., LIN, B., FALCONER, R. A. and TEIXEIRA, E. C. CFD and Experimental Model Studies for Water Disinfection Tanks with Low Reynolds Number Flows. Chemical Engineering Journal vol 137 (1), 550-560, 2008. [ Links ]
[14]HANNOUN, I.A., BOULOS, P.F. and LIST, E.J. Using Hydraulic Modeling to Optimize Contact Time. Journal AWWA , Vol. 90 No. 8, pp. 77-87, 1998. [ Links ]
[15]CIRSEE. Optimizing Conventional Treatment Processes. Lyonnaise des Eaux- CIRSEE, Le Pecq, France. URL: http://www.cirsee-lyonnaise-des-eaux.com/, 2001. [ Links ]
[16]STAEHELIN, J. and HOIGNÉ, J. Decomposition of Ozone in Water in the Presence of Organic Solutes Acting as Promoters and Inhibitors of Radical Chain Reactions. Environmental Science and Technology, Vol. 19, No. 12, pp. 1206- 1213, 1982. [ Links ]
[17]FIELD, B. S., SHOTTS, E. B., FREELY, J. C., GORMAN, G. W. and MARTIN, W. T. Proliferation of Legionella as an Intracellular Parasite of Ciliated Protozoan, Tetrahymena pyriformis. Applied Environmental Microbiology, Vol. 47 (1), 467, 1984. [ Links ]
[18]USEPA. Guidance Manual for Compliance with the Filtration and Disinfection Requirements for Public Water Systems Using Surface Water Sources. Science and Technology Branch Criteria and Standard Division Office of Water. U.S. Environmental Protection Agency, Washington D.C. 1989. [ Links ]
[19] HANNOUN, I. A. and BOULOS, P. F. Optimizing Distribution Storage Water Quality: A Hydrodynamic Approach. Applied Mathematics & Modelling, Vol. 21 (August), pp. 495-502, 1997. [ Links ]
[20]DECKWER, W. D. BUBBLE COLUMN REACTORS. JOHN WILEY and SONS. Toronto, 1992. [ Links ]
[21]Lin, T.-J., Reese, J., Hong, T. and Fan, L.S. Quantitative Analysis and Computation of Two-Dimensional Bubble Columns. AICHE Journal, Vol. 42 n.° 2, 301-318, 1996. [ Links ]
[22]BECKER, S., SOKOLICHIN and EINGENBERGER, G. Gas-Liquid Flow in Bubble Columns and Loop Reactors: Part II. Comparison of Detailed Experiments and Flow Simulations. Chemical Engineering Science, Vol. 49. No 24B, pp. 5747-5762, 1994. [ Links ]
[23]SOKOLICHIN, A. and EIGENBERGER, G. Applicability of the Standard k-E Turbulence Model to the Dynamic Simulation of Bubble Columns: Part I. Detailed Numerical Simulations. Chemical Engineering Science, 5 4. pp. 2273-2284, 1999. [ Links ]
[24]COCKX, A., DO-QUANG, Z., AUDIC, J.M., LINÉ, A. and ROUSTAN, M. Global and Local Mass Transfer Coefficients in Waste Water Treatment Process by Computational Fluid Dynamics. Chemical Engineering and Processing, Vol. 40 pp. 187-194, 2001. [ Links ]
[25]DELNOIJ, E., KUIPERS, J.A.M. and VAN SWWAAIJ, W.P.M. A Three-Dimensional CFD Model for Gas-Liquid Bubble Columns. Chemical Engineering Science, 54 pp. 2217-2226, 1999. [ Links ]
[26]MUDDE, R.F. and SIMONIN, O. Two- and Three-Dimensional Simulations of a Bubble Plume Using a Two-Fluid Model. Chemical Engineering Science Vol. 54 pp. 5061-5069, 1999. [ Links ]
[27]ZHOU, H. and SMITH, D. W. Ozone Mass Transfer in Water and Wastewater Treatment: Experimental Observations Using a 2D Laser Particle Dynamics Analyzer. Water Research, Vol. 34 n.° 3, pp. 909-921, 2000. [ Links ]
[28]WETIND, R. Two-Phase Flow. Femlab Developer Zone. URL: https://access. femlab.com/devzone, 2001. [ Links ]
[29]ZHOU, H. Investigation of Ozone Disinfection Kinetics and Contactor Performance Modeling. Doctoral Thesis: University of Alberta. Alberta, Canada, 1995. [ Links ]
[30]COMSOL, Inc. Femlab Reference Manual, Version 2.2. COMSOL AB, Burlington USA, 2001. [ Links ]
[31]GONG, X., TAKAGI, S., HUANG, H. and MATSUMOTO, Y. A Numerical Study of Mass Transfer of Ozone Dissolution in Bubble Plumes with an Euler-Lagrange Method. Chemical Engineering Science Vol 62 (1), 1081-1093, 2007. [ Links ]
[32]BURNS, L. F. and RICE, R. G. Circulation in Bubble Columns. AICHE Journal, Vol. 43 No 6, 1390-1402, 1997. [ Links ]
[33]ZHOU, H., SMITH, D. W. and STANLEY, S. J. Modeling of Dissolved Ozone Concentration Profiles in Bubbles Columns. Journal of Environmental Engineering, Vol. 120 n.° 4, pp. 821-840, 1994. [ Links ]
[34]WALLIS, G. B. One Dimensional Two-Phase Flow. McGraw-Hill Book Company, New York-USA. 1969. [ Links ]

