


Services on Demand
Journal
Article
 English (pdf)
 Article in xml format
 Article references
 Send this article by e-mail
Indicators
-
 Cited by SciELO
 -
 Access statistics
Related links
-
 Cited by Google
 -
 Similars in
SciELO
Similars in
SciELO -
 Similars in Google
Share

 Permalink
Ingeniería y Desarrollo
Print version ISSN 0122-3461On-line version ISSN 2145-9371
Ing. Desarro. no.24 Barranquilla July/Dec. 2008
Analysis of the factors affecting the severity of two-vehicle crashes
Alejandro Angel*, Mark Hickman**
* Magister and PhD Candidate in Transportation Engineering, Department of Civil Engineering and Engineering Mechanics, University of Arizona.aangel@u.arizona.edu
Correspondencia: Psomas 800 E Wetmore Rd, Tucson, AZ, 85743, United States.
** Ph.D. in Transportation Systems (Massachusetts Institute of Technology) Department of Civil Engineering and Engineering Mechanics, University of Arizona. mhickman@email.arizona.edu
Correspondencia: P.O. Box 210072, CE Bldg, Room 206, Tucson, AZ, 85721, United States.
Fecha de recepción: 9 de mayo de 2008
Fecha de aceptación: 29 de agosto de 2008
Resumen
Este estudio analiza cómo diferentes características demográficas, de los vehículos involucrados, y del lugar y tipo del accidente, afectan la seriedad de las heridas en los accidentes entre dos automóviles. Las limitaciones de estudios previos han sido superadas usando una base de datos con 10 años de registros de accidentes, definiendo las variables independientes de manera correcta, usando el modelo estadístico apropiado, y considerando los efectos de factores frecuentemente ignorados como el tipo de accidente, la intoxicación con alcohol, la velocidad de impacto, y las incompatibilidades estructurales de los dos vehículos. El uso de un modelo logit multinomial provee la flexibilidad necesaria para evaluar variables que tienen efectos distintos a diferentes niveles de severidad (como la disponibilidad de bolsas de aire). El artículo también presenta modelo lineal del costo de las heridas a cada ocupante, que puede ser usado para determinar directamente el costo atribuible a cada variable. Esta simplificación facilita la discusión de políticas de seguridad vial con funcionarios de transporte y gobernantes. Las conclusiones de ambos modelos son consistentes y sugieren que el tipo de accidente (frontal, lateral, etc.) afecta significativamente la severidad. Edad es el factor demográfico más importante; niños y jóvenes tienen una menor probabilidad de ser heridos en un accidente, mientras que ocupantes mayores de 65 años son los más vulnerables. El comportamiento del ocupante es crítico, ya que el uso de cinturones de seguridad y el conducir embriagado pueden reducir o incrementar, respectivamente, la seriedad del accidente sustancialmente. Vehículos más pesados son más seguros para sus ocupantes, pero vuelven más vulnerables a los ocupantes del otro vehículo. El tipo de vehículo no parece ser tan importante como el peso, con la excepción de pick-ups que protegen mejor a sus ocupantes, pero también incrementan el riesgo de heridas a los ocupantes del otro vehículo.
Palabras claves: Severidad de accidentes, seguridad vial, características de vehículos.
Abstract
This study performs a comprehensive analysis of the effect of different environmental, demographic and vehicle variables on the severity of two-vehicle crashes. The limitations associated with previous studies have been addressed by using a large crash database, properly defining the independent variables, using an appropriate statistical model, and by considering the effect of factors normally unaccounted for such as crash type, DUI involvement, impact speed and height incompatibilities between the two vehicles. The use of a multinomial logit model provides the flexibility to evaluate variables that have opposing effects at different injury levels (such as airbag availability). An innovative linear crash cost model is also used to estimate the effect of the independent variables in terms of dollars. This simplification is particularly useful when discussing potential policy treatments for improving road safety with transportation officials, politicians and other decision makers. The findings from the two models are consistent and suggest that the type of crash has a great impact on severity. Age is the most significant demographic variable, with children being least likely to be injured, and older occupants being most likely to be injured. Occupant behavior also seems to be critical, as the use of seatbelts, and alcohol involvement, greatly decrease or increase, respectively, the severity of the crash. Heavier vehicles increase the safety of its occupants but decrease the safety of occupants of the other vehicle. Vehicle types are not found to be as significant as weight, with the notable exception of pickups, which are at the same time more crashworthy and more aggressive than passenger cars.
Key words: Crash severity, traffic safety, vehicle characteristics.
INTRODUCTION
According to the World Health Organization [1], Latin America and the Caribbean have the highest per capita road traffic fatality rate of any region in the world, with 122,000 fatalities per year that cost an estimated $18.9 billion USD annually. In the United States fatality rates are lower, but motor vehicle crashes are still the leading cause of death for the age group 4-34 [2].
This makes traffic safety not only an engineering problem, but also a political, economic and public health issue of major significance. In order to find appropriate solutions to this problem, it is necessary to understand the causes of crashes and the factors that affect crash severity. Although others have studied this issue in the past, the existing literature suffers from significant limitations either on the data source, the model specification or the treatment given to the independent variables. This research project developed several models to identify the variables that influence the severity of two-vehicle crashes, and to quantify their effects. Those variables are illustrated in Figure 1, and can be classified into three major groups: variables associated with the driving environment and the crash characteristics, demographic or behavioral variables, and variables related to the vehicle attributes.
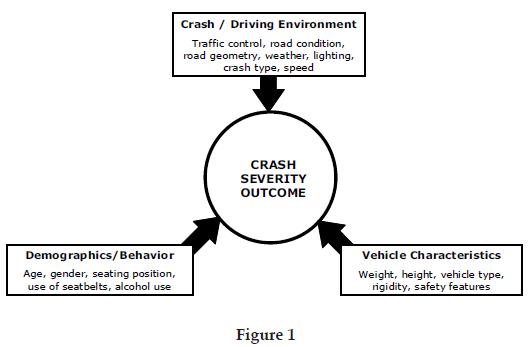
Understanding the effect of road environment variables such as road condition can help agencies and governments evaluate the cost-benefit ratio of investing in roads, while behavioral attributes such as the use of seatbelts and driving under the influence of alcohol are also of interest because they can be modified by educational or enforcement campaigns. Furthermore, the effect of vehicle characteristics such as weight and vehicle type can be used to make policy decisions on vehicle fleets.
PREVIOUS RESEARCH
Research on crash severity has been ongoing for decades. Early studies such as the one by [3] used data from the Fatal Accident Reporting System (FARS), and from the States of North Carolina and New York to evaluate the risk of serious injury or death. However, the applicability of its findings, as well as those of other early studies is limited, because most of the models used Ordinary Least Squares (OLS) regression on the likelihood of fatality and focused only on the risk to drivers.
More recent studies have used several types of logit models to evaluate the likelihood of occupant injury in vehicle crashes. Kahane [4] used various logistic regressions to estimate the probability of a fatality for an individual vehicle occupant. Although the report was limited to the analysis of fatalities (using FARS data), Kahane recognized that a crash analysis model should consider the effect of the crashes on both the individual and society as a whole. Kahane found that changing 1% of the vehicle fleet from mid-size or larger SUVs to cars or minivans would reduce fatalities, and that replacing 1% of the fleet from very small cars to small cars would also reduce fatalities. This is a result of the mass, geometric (height) and rigidity incompatibilities between Light Trucks and Vans (LTVs) and passenger cars.
Toy and Hammit [5] conducted another study to address policy and consumer concerns about the relative safety of SUVs, vans, pickup trucks and cars. Their paper compared vehicle types in relation to their crashworthiness (self-protection), and aggressiveness (risk to others). The study used 6,481 driver observations from the National Accident Sampling System's Crashworthiness Data System (NASS/CDS), which allowed the authors to evaluate the effect of crashes not only on fatalities, but also on injuries. The methodology was based on several binary logit formulations similar to those used in other studies, including independent variables such as body type (van, pickup, SUV) of own vehicle and the other vehicle; driver age, gender, seatbelt use, airbag, and side of impact. However, the authors also used two new variables: a mass ratio of the two vehicles, and delta-v, which measured the change in velocity during the time between the initial contact and the time at which the vehicles achieve a common velocity. Their study found that pickups appear to be more crashworthy than cars, but they also concluded that SUVs, pickups and vans are more aggressive than cars across several severity thresholds. The main limitation of this study is that the small sample size resulted in wide confidence intervals, and that it focused only on drivers instead of considering all vehicle occupants.
Wang and Kockelman [6] produced one of the few studies that focus on all vehicle occupants instead of just the driver. The study used 18,609 occupant observations from the NASS/CDS to analyze two-vehicle crashes with a Heteroscedastic Ordered Logit (HOL) Model, which the authors argue allows the distribution of unobserved factors to differ, providing more flexibility than an Ordered Logit (OL) model. The Wang and Kockelman [6] study found that after controlling for weight, LTVs are less crashworthy (increased injury risk to its occupants) than passenger cars, suggesting that the key vehicle characteristic in terms of injury probability is weight and not vehicle type. They also found that increasing vehicle weight reduces the probability of injury to occupants of the vehicle, but raises the probability of injury to occupants of the collision partner. In relation to environmental variables, they showed that higher speed limits are related to a higher proportion of fatal crashes and that adverse weather decreases the probability of injury or death (attributed to a more cautious driving behavior). As far as occupants, females are more likely to be injured or killed than males, the second row of seats is safer than the front row, and a 10-year increase in age results in a 2% increase in injury probability and a 6% increase in fatality probability. Although this study is very comprehensive, it does not address the impact of key variables such as crash type (head-on, angle, rear-end, etc.) or airbag availability, and defines variables such as age incorrectly, because it does not recognize that age has a different effect on children, adults and seniors.
In sum, several researchers have attempted to evaluate the effect of various elements on the severity of two-vehicle crashes, but most studies have had important limitations related to the data sources and the analysis methodology. The most common include focusing only on fatalities and ignoring the different levels of injury outcomes, narrowing the models to drivers, incorrect treatment of explanatory variables, or the derivation of conclusions from small sample sizes.
2. DATA DESCRIPTION
The data used for this study consists of 10 years of crash records from the State of Utah (1995 to 2004) [7] ranging in injury severity from property damage only (injury level 1) to fatality (injury level 5). The level designations are compatible with the KABCO scale, which is based on a visual analysis made by the police officer at the crash scene. The records are organized in three main tables:
- Crash table - covers more than 30 variables associated with the crash such as location, traffic control, road condition, alignment type, weather, lighting, and crash type.
- Vehicle table - uses the Vehicle Identification Number (VIN) to decode vehicle characteristics including vehicle type, model, year, weight, wheelbase and types of restraints available. Also includes the posted speed limit, the estimated travel speed for each vehicle prior to the crash, and the estimated impact speed.
- Occupant table - contains a record for each vehicle occupant involved in a crash with information such as age, gender, seating position, type of restraint used and testing for driving under the influence (DUI) of alcohol.
Overall, the dataset included 333,612 two-vehicle crashes. However, it was necessary to clean the data by eliminating valid or incomplete records for any of the variables included in the analysis for any of the occupants or vehicles. Without considering vehicle speed, the dataset contained complete information for 62,735 crashes involving 125,470 vehicles and 179,546 occupants. Further filtering the data to only include valid speed records reduced the size of the dataset to 28,353 crashes involving 56,706 vehicles and 81,772 occupants. Given the importance of speed in the severity of twovehicle crashes, and after verifying that the sample was still representative of the overall population, it was decided to use the smaller dataset that includes speed.
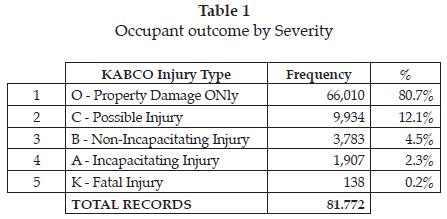
Even after eliminating invalid and incomplete records the dataset is large enough to eliminate the issues associated with small sample sizes. Table 1 presents the number of cases associated with each injury outcome. Although the magnitude of the effects of behavioral choices, in-vehicle safety equipment, and crash attributes may vary across countries depending on the level of development, demographic or socio-economic characteristics, the effect and relative magnitude of the variables evaluated here provide valuable insight into the factors that may contribute to the severity of crashes in Pan-American countries.
3. ANALYSIS FRAMEWORK
3.1. Variable selection
The dependent variable used in the analysis is the injury outcome for a given occupant, based on the KABCO scale. The selection of explanatory variables to be included in the analysis was made based on a two-step process. First, only the variables having a causal relationship with the outcome of crashes were considered. Then, a statistical analysis was done on that subset of variables to evaluate correlation among them, and in the case of two or more variables that represented the same physical effect on the crash, a chi-square analysis was performed to determine which one would contribute more to the model's explanatory power.
Table 2 lists the variables selected for use in the model and explains their meaning. Although most of them are self-explanatory, the definition of a few variables merits further discussion, as they have been inadequately formulated in other studies.
- Age is broken into three categories because it is expected that children and older occupants would have different probability of injury than adults. Children were further classified as being under or over 5 years of age, because the State of Utah requires that children under the age of 5 use a restrain system (Utah Code 41-6a-1803). Children between the ages of 5-15 are required to either use a child restrain system, or wear a seatbelt.
- Airbag was separated into front airbags and side airbags because each type of airbag is intended to protect occupants from different types of crashes. Furthermore, instead of coding airbag based on its deployment it was coded based on its availability for a given seating position. Coding airbags based on deployments creates an endogenous effect, as their deployment is more likely in more severe crashes.
- Height Ratio is a proxy variable for the height at which a vehicle applies force at impact. In this case "height" is calculated as the weight divided by the wheelbase of the vehicle. The height ratio is the height of the primary vehicle divided by the height of the partner vehicle in the crash. Height is important, because the height at which SUVs and other light trucks apply force at impact is one of the main sources of their aggressiveness towards passenger cars.
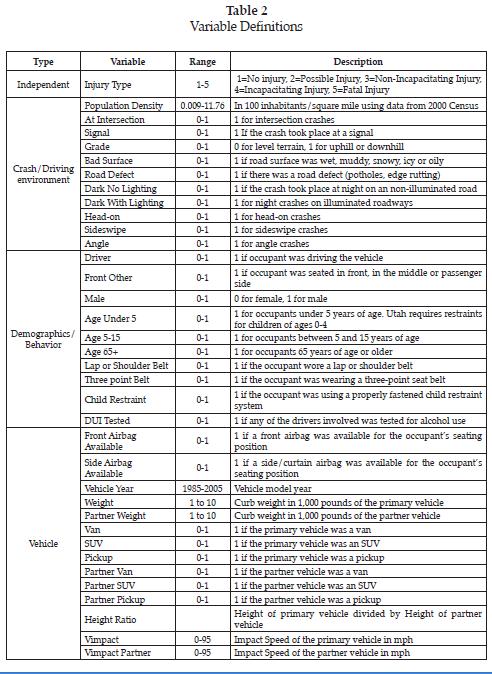
- Impact Speed is one of the speeds available on the dataset, along with speed limit and travel speed. It was selected over the other two speeds because it represents the speed of the vehicle when the crash took place, and therefore is proportional to the momentum transferred to the other vehicle.
3.2. Model Structure
Two types of statistical models were used on the data to assess the effects of the different independent variables.
- Multinomial Logit of Injury Severity: Since the level of injury experienced in a vehicular crash is often coded as a discrete outcome (the KABCO scale), a logit model was used to estimate the resulting qualitative injury severity. Within the logit family, a multinomial logit model was chosen because it allows variables to have opposing effects for the different types of outcomes, which means they can reflect the effect of variables like airbag availability more accurately (e.g., it is hypothesized that airbags can decrease the likelihood of no injury and the likelihood of a fatality, while increasing the probability of suffering a minor injury). The most significant drawback of multinomial models is that they require the estimation of more coefficients, hence demanding larger samples. However, given the amount of data available for this project, this is not a concern.
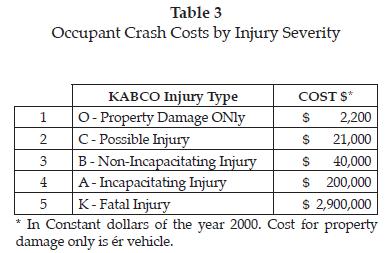
- Linear Regression of Crash Costs: Instead of estimating the likelihood of a given injury outcome, this model uses the crash costs for each occupant as the dependent variable. Although more limited than the multinomial logit because it cannot reflect opposing effects within a given variable, the main advantage of this model is that it assigns a dollar value to the safety impact of each variable. The costs associated with each injury level are from the Federal Highway Administration [8], converted to constant dollars of the year 2000 using the Gross Domestic Product Price Deflator. Table 3 presents the occupant crash cost for each severity outcome.
4. FINDINGS
4.1. Multinomial Logit of Injury Severity
Table 4 presents the coefficients, Odds Ratios (O.R.) and z-values for the multinomial logit model used to estimate occupant injury severity. Highlighted z-values indicate that the variable is significant at the 95% level.
- Crash / Driving Environment - The model shows that as population density increases, the injury severity decreases slightly, meaning that crashes are less severe in urban environments; perhaps due to the lower travel speeds and increased driving attention associated with a more complex environment. The odds of suffering a fatality decrease by 8% with each 100 inhabitants per square mile in population density.
From the data, intersection crashes are more likely to result in non-fatal injuries, but do not affect the probability of fatalities. However, this is compensated at signalized intersections by the fact that crashes at locations with traffic signals have 25% lower odds of non-fatal injuries (O.R. ranging from 0.74 to 0.76). Other road environment variables such as grade and road surface condition have smaller or non-significant effects on the level of severity, with the exception of street lighting for night-time crashes, which decrease the odds of a fatal crash by 50%, and the odds of an incapacitating injury by 17%.
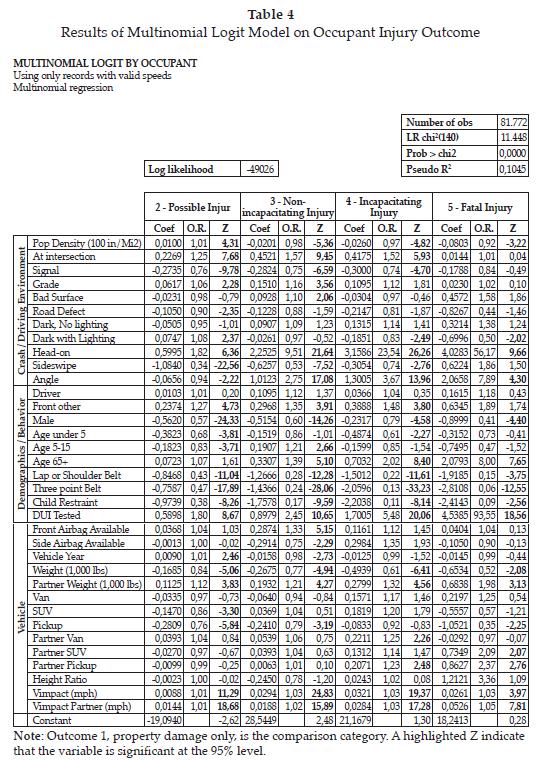
Crash type was found to be the crash-related factor with the greatest effect on injury severity. Head-on crashes are the most severe type of collision, and increase the odds of incapacitating injury or fatality 23 and 56 times, respectively. The second most severe crashes are angle collisions, which increase the odds of suffering a fatal injury by almost 8 times. On the other hand, sideswipes reduce the likelihood of experiencing any nonfatal injury and are the least severe type of collision. These findings are logical and consistent with the principles of physics. In head-on crashes, the motion vectors of the two vehicles are opposing each other, thus resulting in the highest crash energy. On Angle crashes the vectors are approximately orthogonal so the vehicle speeds and energy do not have an additive effect. In sideswipe collisions the angle of impact is relatively shallow, thus reducing the crash energy involved.
- Demographics / Behavior - The results indicate that the probability of injury for drivers and second row occupants is not significantly different. However, other front-row occupants have 27% to 48% greater odds of non-fatal injuries, with the highest value corresponding to the more severe injuries. Previous research [6] coincides in the finding that the right front seat is more dangerous than the driver's position, but found that the driver's seat is still less safe than the back seat.
In terms of demographics, males are significantly less likely than females to suffer any level of injury (O.R. range from 0.41 to 0.79). Age is also an important predictor of injury level. Even when child restraint systems are considered separately, children under the age of 5 have 39% lower odds than adults of suffering an incapacitating injury. At the other end of the scale, occupants of age 65 or older have twice greater odds of suffering incapacitating injuries, and eight times greater odds of suffering a fatality.
The use of any type of restraint system (lap or shoulder belts, three-point seatbelts and child restraints) significantly reduces the probability of all levels of injury. Although both types of seatbelts reduce the odds of a fatal injury by 85% or more, three-point belts were found to be more effective at preventing outcomes ranging from non-incapacitating injuries to fatalities. Child restraints were also determined to significantly reduce the probability of suffering injuries (O.R. ranging from 0.38 for possible injury to 0.09 for fatality).
One expected but seldom tested assumption is that alcohol involvement increases the severity of crashes. This study found that when at least one of the drivers was tested for DUI, the odds of all types of injury increase significantly, with the greatest increases taking place at the most severe end of the scale. In fact, the odds of a fatality for any of the occupants involved in a crash increase 93 times when one of the drivers is tested for DUI.
- Vehicle Characteristics -The availability of side or frontal airbags does not significantly affect the risk of injury with the exception of non-incapacitating injuries, which are slightly increased by frontal airbags and decreased by side airbags. This finding may appear to be counterintuitive, but can be explained by the fact that approximately 90% of the occupants in the crash data were reportedly wearing seatbelts, which in many cases provides sufficient protection from injury. According to research by the National Highway Traffic Safety Administration [9], airbags did not provide any additional protection from serious and greater injury to occupants who wore a three-point belt. The same report also found that airbags alone did not provide significant injury protection for crashes in all damage areas.
Typically, the source of incompatibilities between two colliding vehicles is attributed to vehicle type, and weight is often ignored. The results of this analysis indicate that weight has a more significant effect on the severity outcome of a crash, and that vehicle type has a small (and often insignificant effect) on severity when controlling for weight. Heavier vehicles are more crashworthy and provide increased protection from injury to its occupants. A 1,000-pound increase in vehicle weight reduces the odds of incapacitating injury by 39% and the odds of fatality by 48%. However, heavier vehicles are also more aggressive, and achieve the safety improvement to its occupants at the expense of the occupants of the other vehicle involved in the crash (the partner vehicle). Increasing the weight of the vehicle 1,000 pounds increases the odds of incapacitating injury to occupants of the other vehicle by 32%, and almost doubles the odds of suffering a fatality for those occupants (O.R.=1.98).
Among the different vehicle types, pickups appear to be significantly more crashworthy than passenger cars, reducing the odds of non-incapacitating injuries and possible injuries by over 20%. Likewise, pickups were also the most aggressive vehicle type, increasing the risk of incapacitating injury or fatality (O.R.=1.23 and 2.37, respectively) to occupants of the partner vehicle. SUVs were found to provide some significant protection in the possible injury category, but did not provide any added safety at other injury levels. They also doubled the odds of fatality for occupants of the partner vehicle. Vans were not significantly different from passenger cars in terms of their crashworthiness.
Vehicle year, a proxy for the type of safety features present in the vehicle such as ABS and crumple zones, had a small effect on crash severity slightly reducing the odds of non-incapacitating injuries. The height ratio for the two vehicles did not have any significant effect on the severity of the crash.
Vehicle speed was also an important factor in the severity outcome of two-vehicle crashes. A 1-mph increase in the impact speed of the primary vehicle raises the odds of non-incapacitating and incapacitating injury by 3%, while the odds of a fatality increase 5%. Increasing the impact speed for the partner vehicle by 1 mph also has a similar effect on severity.
4.2. Linear Regression of Occupant Crash Costs
Table 5 summarizes the results of the linear regression conducted to estimate occupant costs on two-vehicle crashes. The overall R2 of the model (0.0848) was expected, as crash severity is a phenomenon with a high proportion of unexplained variation. Therefore, the R2 of the model should not be compared to the R2 of other phenomena with a small amount of variation, but with the R2 of other studies that evaluated the same phenomenon. Studies of injury severity by White [10] and by Khattak and Fan [11] reported R2 (or pseudo R2) values of 0.0822 and 0.07, respectively. Both of those measures are comparable to, but lower than the R2 measured with this model. The highlighted t-values for the individual variables indicate that the variable is significant at the 95% level.
- Crash / Driving Environment - The results of this model related to population density coincide with the multinomial logit in the sense that as population density increases, the crash costs (and by extension the injury severity) decrease. Also, roadways with defects such as potholes produce crashes with lower injury costs, possibly because of more cautious driving.
As was the case with the multinomial logit, the type of crash also had a significant effect on crash costs. Head-on crashes are estimated to increase the occupant crash cost by over $117,000 (relative to the comparison category, a rear-end crash) because of their severity. Angle crashes are the second most severe crashes, followed by rear-ends and sideswipes. However, the costs of the last three types of crashes are all within $10,000 and cost more than $100,000 less than head-on crashes.
- Demographics / Behavior - Most of these variables (8 of 10) were significant at the 95% level. As far as seating position, although drivers do not have significantly different crash costs than second row passengers (the comparison category), the other front occupant is expected to suffer injuries with approximately $5,000 greater cost than rear seat occupants. This finding is consistent with the multinomial logit model that the second row is safer than the front row. Also confirming the results of the multinomial logit and the Wang and Kockelman [6] study, males have lower expected crash costs than females ($3,418 less).
The average crash costs for children in the 5-15 age group are nearly $5,000 less than for adults, while as expected, the costs for older occupants (65 or older) are $17,342 higher than for adults. In regards to restraint use, occupants who wore any type of belt suffered significantly lower costs than unbelted occupants. The estimated benefits of using a three-point belt system are just over $40,000, approximately $5,000 more than those of using a lap or shoulder belt or a child restraint system.
Finally, when one of the drivers is tested for DUI the crash costs per occupant increase by over $162,000, indicating that alcohol use results in significantly more severe crashes and has a very high cost to society.
- Vehicle Characteristics - As was the case with the multinomial logit, there was no evidence that airbag availability (front or sides) reduces crash costs. The model year of the vehicle had no significant impact on costs, suggesting that improved safety systems associated with newer vehicles and unaccounted for in other variables (such as crumple zones and ABS) do not have a significant effect on crash costs.
Vehicle types were found to sometimes be related to crash costs. While SUVs and pickups decrease crash costs for their occupants (more crashworthy), the results suggest that no vehicle type increases the crash costs for the other vehicle (none of the coefficients for the partner vehicle are significant). This last finding is different than the finding from the multinomial logit that found that SUVs and pickups significantly increase the fatality risk for occupants of the other vehicle. Also in contrast to the multinomial model, as the height ratio increases, so do the crash costs, indicating that on a collision between a passenger car and an LTV, the crash costs for the LTV occupant are greater (with everything else being equal). On the other hand, vehicle weight still has an important effect on the cost of crashes. Given the estimated coefficients, a 1,000 lb increase in vehicle weight reduces the crash costs for the occupant of the vehicle by $3,780,but the reduction is achieved at the expense of the occupants of the partner vehicle, who experience a $5,510 increase each in crash costs. Therefore, the net result for society of a 1,000-pound increase in the average weight of the vehicle fleet is an increase of $1,730 dollars per occupant per crash.
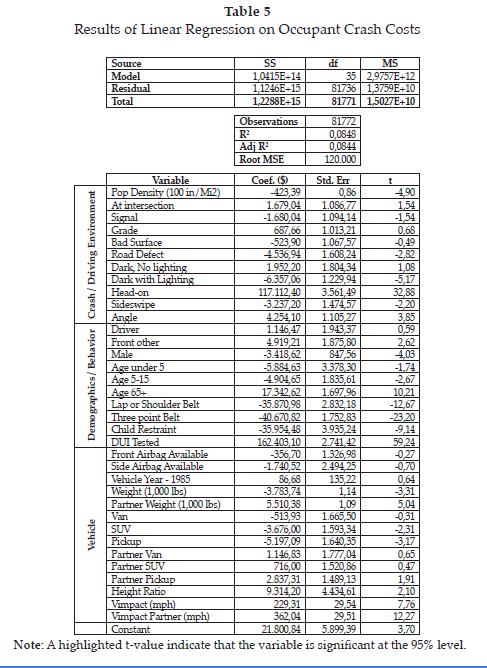
Speed was also considered to be directly proportional to crash costs. A one-mile per hour increase in speed results in a $230 increase in the cost of the crash for occupants of that vehicle, and on a $360 increase in cost for occupants of the other vehicle.
5. CONCLUSIONS
This study has provided a comprehensive analysis of the effects of different environmental, demographic and vehicle elements on the severity of twovehicle crashes. Shortcomings of previous studies have been addressed by using a large sample size, properly defining the independent variables, and by considering the effect of factors normally unaccounted for such as crash type, DUI involvement, impact speed and height incompatibilities between the two vehicles.
The use of a multinomial logit model provides the flexibility to evaluate variables that may have non-ordinal effects on crash severity, and estimates coefficients for each variable and possible outcome. An innovative linear crash cost model was also developed to estimate the effect of the different independent variables in terms of dollars. This simplification is particularly useful when discussing the causes of crashes and potential policy treatments for improving road safety with transportation officials, politicians and other decision makers.
The findings from the two models are consistent, and suggest that the type of crash (head-on, angle, rear-end or sideswipe) is the crash environment factor with the greatest impact on severity, as head-on crashes increase the odds of a fatality more than 56 times relative to a rear-end crash, and more than 7 times relative to an angle collision (the second most severe crash type). This indicates that improving directional separation between twolane roadways either by adding barriers, medians or just rumble strips along the centerline could be an effective strategy for reducing fatalities. Age is the most significant demographic variable, with children being less likely to be injured than adults, and older occupants being significantly more likely to be injured.
Occupant behavior also seems to be a critical factor, as the use of seatbelts and alcohol involvement have the potential of greatly decreasing or increasing, respectively, the severity of the crash. Improvements can be made in both of these areas by the development of educational or enforcement campaigns. In terms of vehicle characteristics, increasing vehicle weight increases the safety of its occupants but decreases the safety of occupants of the other vehicle. The net effect of increasing the average weight of the vehicle fleet would be an increase in crash costs. Vehicle types were not found to be as significant weight, with the notable exception of pickups, which are at the same time more crashworthy and more aggressive than passenger cars.
ACKNOWLEDGEMENTS
The authors wish to thank Rob Clayton and Michael Kaczorowski at the Utah Department of Transportation for sharing the crash records and allowing their use in this study. The assistance provided by Larry Cook at the University of Utah in decoding Vehicle Identification Numbers (VIN) is also appreciated.
REFERENCES
[1] World Health Organization WHO, World Report on Road Traffic Injury Prevention, World Health Organization, Geneva (2004). [ Links ]
[2] S. RAJESH, Motor Vehicle Traffic Crashes as a Leading Cause of Death in the United States, 2003. Publication DOT HS 810 568. NHTSA, U.S. Department of Transportation, Washington D.C. (2006). [ Links ]
[3] L. EVANS and P. WASIELEWSKI, Serious or Fatal Driver Injury Rate Versus Car Mass in Head-On Crashes between Cars of Similar Mass. Accident Analysis and Prevention. Vol 19, N° 2, (1987) pp. 119-131. [ Links ]
[4] C.J. KAHANE, Vehicle Weight, Fatality Risk and Crash Compatibility of Model Year 1991-1999 Passenger Car and Light Trucks. Publication DOT HS 809 662. NHTSA, United States Department of Transportation (2003). [ Links ]
[5] E.L. TOY and J.K. HAMMIT, Safety Impacts of SUVs, Vans, and Pickup Trucks in Two-Vehicle Crashes. Risk Analysis, Vol. 23, N° 4, (2003) pp. 641-650. [ Links ]
[6] X. WANG and K. KOCKELMAN, Use of Heteroscedastic Ordered Logit Model to Study Severity of Occupant Injury: Distinguishing Effects of Vehicle Weight and Type. Transportation Research Record: Journal of the Transportation Research Board, N° 1908, TRB, National Research Council, Washington, D.C., (2005) pp. 195-204. [ Links ]
[7] State of Utah. Utah Code. Utah Legislature. http://le.utah.gov Accessed June 2, 2007. [ Links ]
[8] Federal Highway Administration FHWA, Motor Vehicle Accident Costs, Federal Highway Administration, Washington D.C. (1994) http://www.fhwa.dot.gov/legsregs. AccessedApril30,2008 [ Links ]
[9] National Highway Traffic Safety Administration NHTSA, Fifth/Sixth Report to Congress on the Effectiveness of Occupant Protection Systems and their Use, National Highway Traffic Safety Administration, Washington, D.C. (2001) [ Links ]
[10] M.J. WHITE, The "Arms Race" on American Roads: the Effect of Sport Utility Vehicles and Pickup Trucks on Traffic Safety. Journal of Law and Economics, Vol. XLVII, The University of Chicago, Chicago, (2004) pp. 333-355. [ Links ]
[11] A.J. KHATTAK and Y. FAN, What Exacerbates Injury and Harm in Car- SUV Collisions. Journal of Transportation Engineering, Vol. 134, N° 2, American Society of Civil Engineers, (2008) pp. 93-104. [ Links ]

