


Serviços Personalizados
Journal
Artigo
 Inglês (pdf)
 Artigo em XML
 Referências do artigo
 Enviar este artigo por email
Indicadores
-
 Citado por SciELO
 -
 Acessos
Links relacionados
-
 Citado por Google
 -
 Similares em
SciELO
Similares em
SciELO -
 Similares em Google
Compartilhar

 Permalink
Ingeniería y Desarrollo
versão impressa ISSN 0122-3461
Ing. Desarro. vol.31 no.1 Barranquilla jan./jun. 2013
ARTÍCULO DE INVESTIGACIÓN / RESEARCH ARTICLE
Multivariate model for in-line monitoring of moisture content in
a high shear mixer using near infrared spectroscopy
Modelo multivariado para monitoreo en línea del contenido de humedad en un mezclador
de alta cizalladura usando espectroscopia infrarroja cercana
Alvaro Realpe Jiménez*
Universidad de Cartagena (Colombia)
Carlos Velázquez Figueroa**
Universidad de Puerto Rico (Puerto Rico-USA)
María Teresa Acevedo Morantes***
Universidad de Cartagena (Colombia)
* Doctor en Ingeniería Química de la Universidad de Puerto Rico; Profesor Asistente del Programa de Ingeniería Química de la Universidad de Cartagena (Colombia). Investigador del grupo Modelación de Partículas y Procesos. arealpe@unicartagena.edu.co
** Doctor en Ingeniería Química de la Universidad Connecticut; Profesor del Departamento de Ingeniería Química de la Universidad de Puerto Rico. carlos.velazquez9@upr.edu
*** Magister en Ingeniería Química de la Universidad de Puerto Rico; Profesora Auxiliar del Programa de Ingeniería Química de la Universidad de Cartagena. Investigadora del grupo Modelación de Partículas y Procesos. macevedom@unicartagena.edu.co
Correspondencia: Álvaro Realpe Jiménez, Calle El Consulado n°. 48 B - 152, Oficina 308, Bloque A, Campus Piedra de Bolívar. Programa de Ingeniería Química, Universidad de Cartagena. (Colombia). arealpe@unicartagena.edu.co. Tel: (5)-6752040.
Subvenciones y apoyos: INDUNIV (Consorcio Industrias-Universidades), Código G-05-01.
Fecha de recepción: 1 de septiembre de 2012
Fecha de aceptación: 19 de enero de 2013
Abstract
Wet granulation process in a high shear mixer is a complex unit operation widely used in the pharmaceutical and food industry where moisture content is a critical factor since it affects the growth of granules or particles. The granule size affects flow ability, drug delivery, and tablet hardness; therefore, it is important to monitor and to control the quantity of liquid in the mixer. In this work a mixer was equipped with a near infrared (NIR) spectrometer to monitor the moisture content during granulation. Initially, pharmaceutical excipients were homogenized in a mixer. Next, water was added to the powder mixture to initiate wet granulation, and NIR spectra were collected each minute.
The aim of this work was to evaluate the near infrared spectroscopy as an in-line technique for monitoring the moisture content of pharmaceutical powders during wet granulation process in a laboratory-scale high shear mixer. The results confirm the ability of NIR spectrometer to take full in-line and off-line spectra of pharmaceutical powders at different levels of added binder. The multivariate model developed for determining the in-line spectra variation during granulation was capable of measuring the moisture content with high precision (0.207% w/w).
Keywords: High shear mixer, in-line measurements, off-line measurements, moisture content, process analytical technologies, wet granulation.
Resumen
El proceso de granulación húmeda en un mezclador de alta cizalladura es una operación compleja ampliamente usada en la industria farmacéutica y alimentos, dónde el contenido de humedad es un factor crítico que afecta el crecimiento de los granulos o las partículas. El tamaño del gránulo afecta la capacidad de flujo, la liberación de droga y dureza de la tableta, por consiguiente, es importante monitorear y controlar la cantidad de líquido en el mezclador. En este trabajo un mezclador fue equipado con un espectrómetro de infrarrojo cercano (NIR) para monitorear el contenido de humedad. Inicialmente, los excipientes farmacéuticos se homogenizan en el mezclador. Luego, se agrega agua a la mezcla de polvos para iniciar la granulación húmeda, y tomar los espectros NIR cada minuto.
El objetivo de este trabajo fue evaluar la espectroscopia infrarroja cercana como una técnica en línea para monitorear el contenido de humedad de polvos farmacéuticos durante el proceso de granulación húmeda en un mezclador de alta cizalladura a escala de laboratorio. Los resultados confirman la habilidad del espectrómetro de NIR para tomar espectros en línea y no en línea de polvos farmacéuticos en diferentes niveles de líquido agregado. El modelo multivariado desarrollado determinó el contenido de humedad en el proceso de granulación húmeda con alta exactitud de 0.207% w/w para espectros en línea.
Palabras clave: Contenido de humedad, granulación húmeda, mezclador de alta cizalladura, medidas en línea, medidas fuera de línea, proceso de tecnologías analíticas.
INTRODUCTION
In-line measurements of moisture content have become one of the main concerns for industrial processes in which a product is dried or moisturized. Near infrared (NIR) spectroscopy has been a technique used for moisture measurements in pharmaceutical laboratories. Furthermore, the moisture measurements have also been performed successfully during the granulation process in a fluid bed drying [1, 2]. Additionally, constant values of moisture in a high shear mixer were obtained during wet massing phase [2]; whereas in other studies, it was observed a decrease in the moisture content during the same phase, due to the binder evaporation induced by high shear force, which increased the temperature of the system [3, 4]. As a consequence, monitoring the moisture content during the granule growth with NIR spectroscopy allows fundamental understanding of wet granulation process.
The liquid makes the agglomerate more deformable due to decreased particle-particle interactions. These results are in accordance with the ball growth that occurs, if too much liquid is added, or if granulation times are too long [5]. The granule deformability increases the probability of agglomeration of two colliding granules [6]. Thus, the development of a NIR calibration model could be very helpful to in-line monitor of binder content, which affects the granule size [3, 7, 8]. In-line moisture content determination depends on the ability of a sensor to provide continuous and reliable measurements despite the noise caused by movement of the mixer. Near-infrared spectroscopy technology has been developed over the last twenty years for a wide range of industrial applications and it is recognized as an extremely powerful measurement technique. It has the ability to quickly provide qualitative and quantitative information of many products [9-12]. The non-invasive and non-destructive features of vibrational spectroscopy techniques, such as NIR, make them novel tools for in- line quality assurance. The NIR spectrum covers the interval between 4000 cm-1 to 12,500 cm-1. Some absorption bands for water in NIR can occur at 5128 cm-1 and 6897 cm-1 [13-16]. The ability of the NIR spectroscopy technique for in-line monitoring the moisture content during the wet granulation process in a laboratory-scale high shear mixer was investigated.
MATERIALS AND METHODS Raw materials and equipment
Pharmaceutical powders such as lactose anhydrous and monohydrate supplied by Mutchler Inc were used to prepare the granulation. The Fourier Transform (FT)-NIR spectrometer Bruker Optics (Billerica, MA) Vector 22/N was used to take spectra. This spectrometer uses a fiber optic probe, which is connected to an InGaAs diode detector. The moisture content of the powder mixture was determined off-line by loss on drying (LOD) method using a moisture analyzer. Granule size was determined by sieve analysis using the following sieve trays Tyler's 270, 230, 200, 170, 140, 70, 50 and 40 meshes US Standard. The samples were vibrated with a mechanical sieve shaker until the weight of the samples in mesh sieves did not change significantly with respect to previous weight.
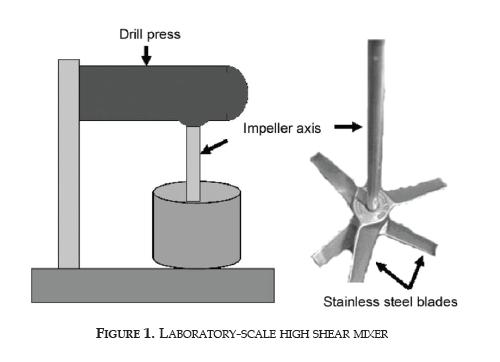
Figure 1 depicts a schematic of the laboratory-scale high shear mixer equipped with NIR spectrometer. The tank was made in acrylic material with a diameter of 6 1/2-inches. A RyobiTM 12-inches drill press was used as an impeller motor, vertically rotating; its speed was fixed at 560 rpm. Two stainless steel blades of 6-inches diameter were attached to the impeller axis. The binder solution was dispersed in fine particles to the powder mixture at a rate of 161.7 ml/min using a peristaltic pump through a nozzle to ensure the homogenization of the mixture.
To obtain an acceptable mixing quality, the zone of poor mixing in the mixer must be reduced. This was reached by reducing the space between blades and vessel wall and equidistant positioning of the blades in the vessel as shown in figure 1. Image analysis was used for the granulator characterization [17] to ensure the reproducibility of the experiments [3]. Although this is a laboratory-scale high shear mixer, the down-scaling of wet granulation process resulted in a well-mixed sample without a significant spatial variation of particle size distribution (PSD).
Granulation Method
Approximately 90 g of lactose monohydrate and 345 g of lactose anhydride were mixed during five minutes in a high shear mixer, operating at 560 rpm to ensure homogenization of powder mixture. Next, water was added to the lactose mixture, and the powder mixture was granulated for 3 minutes. Different amounts of water were added to the mixture to obtain a granulated material with different moisture content of approximately 2, 4, 6, 8, 10, 12, and 14% (w/w). An in-line NIR spectrum at a resolution of 4 cm-1 with 16 scans per sampling was collected before stopping the granulator in the spectral region from 12000 and 4000 cm-1, at this point, the height of granule bed was about 2-inches due to the centripetal force. The granulator was then stopped and two samples were taken from different points inside the mixer to measure moisture content with LOD method, and also to obtain off-line spectra. The granulation process was turned on again for one more minute and another in-line NIR spectrum was collected. The granulating process was then stopped and two samples were taken from different points inside the mixer. The NIR spectra of the collected samples were obtained and their moisture content determined by LOD.
DEVELOPMENT OF CALIBRATION MODEL
A calibration model was developed to determine the moisture content of the powder mixture using NIR spectra and LOD data. The collection and transformation of spectral data were performed using spectroscopic analysis software (OPUS and Pirouette, version 3.11).
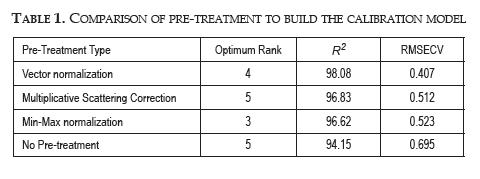
The calibration procedure involved collecting a number of samples, obtaining their NIR spectra and then determining the moisture content with the reference method (LOD). Next, Multivariate calibration models were developed by using partial least square (PLS) [18] and they were used to predict the moisture of future samples. However, the solid dosage processing presented uncontrollable physical variations such as non-homogeneous distribution of the particles, changes in refractive index, density variability, and changes in surface roughness and shape, leading to light scattering effect, causing slope variation of spectra [19]. This slope variation was reduced by decreasing the physical information of particle size and shape in the NIR spectra with a data pre-treatment method [20], such as vector normalization, multiplicative scattering correction and other methods, as shown in Table 1.
A total of 16 in-line NIR spectra with their respective average moisture content were used to develop the PLS calibration model. PLS generates the multivariate calibration model as shown below:
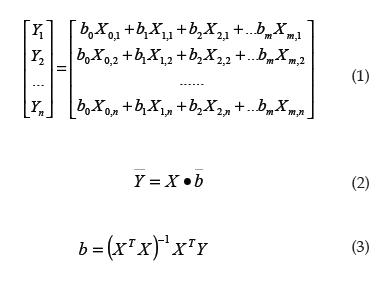
where Yn is the moisture value as determined by the loss on drying (LOD), bm are the regression coefficients and Xm is absorbance value in a determined wavelength. The PLS method is used to estimate the respective regression coefficients (bm) from a relationship between the moisture content (Yn) determined by LOD and absorbance values (Xm), then, the multivariate model can be used to make predictions for new NIR spectroscopy spectra.
For the development and validation of the NIR spectroscopy method, we used 5 off-line spectra as training samples and several statistic tools, such as the correlation coefficient (R2), the root-mean-square error of cross validation (RMSECV), and the root-mean-square error of prediction (RMSEP). These techniques were useful to assess the method accuracy, the determination of suitable data pretreatment, and the selection of a wavelength region. The RMSEP is defined by
where Yi is the observed moisture content as determined by reference method, Ypi is the moisture content predicted by the NIR spectroscopy technique and n is the number of testing samples in the data set being examined. Equation 4 was also used to define the training sample accuracy. In this case, it was called root mean square error of cross validation (RMSECV).
RESULTS AND DISCUSSION
Calibration and Validation Model for in-line NIR Spectroscopy Measurements
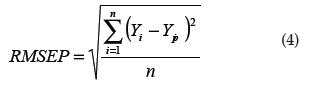
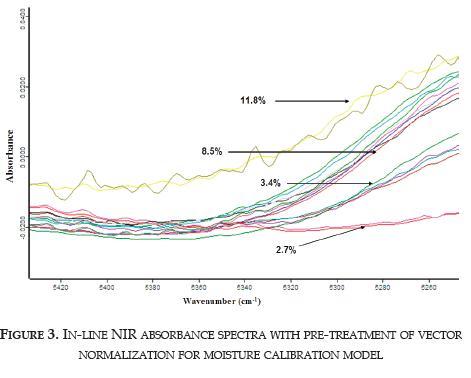
Figure 2 shows in-line measurement spectra without data pre-treatment where the region of 7000 to 4300 cm-1 depicts the relevant changes in the absorbance measurements due to absorption bands for water in NIR at 1450 nm and 1900 nm (6896.6 cm-1 and 5263.2 cm-1, respectively) [13-16]. The NIR spectra show differences in their baseline. These variations are expected since these are in-line measurements obtained for particles that are moving and growing; subsequently, the light interactions with the analyzed surface are different each time. The baseline shifts are the result of the particle size changes that are occurring during the granulation process and it causes a change in the amount of radiation scattered by the sample [1, 21-24]. The next step was the development of a PLS model to determine the moisture content. This required reducing the physical information of particle size and shape in the NIR spectra with a data pre-treament method. Vector normalization was performed in the region from 5320-5220 cm-1 to observe the real variation of absorbance with respect to moisture content as observed in figure 3. The absorbance change is due to stretching or bending vibrations of O-H bond [13, 25].
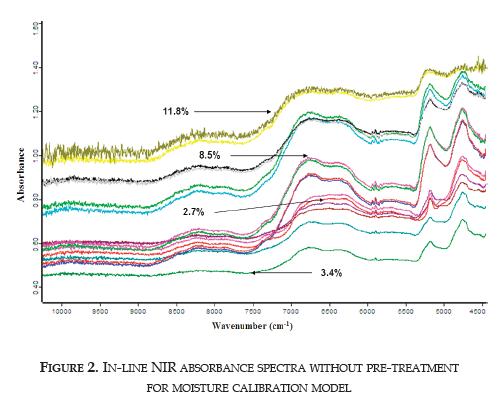
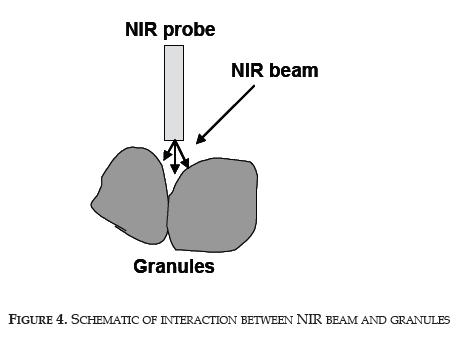
Figure 3 depicts how the baseline shifts up in the y axis as moisture content increases, which causes the granule size to increase [3]. The baseline displacement of spectra is commonly associated to the granule size [26, 27]. Also, the spectra noise increases with increasing of granule size or moisture content. The high noise observed on the in-line NIR spectra with moisture content of 12 and 14% was associated to the insufficient contact of NIR beam with lactose granules due to the voids between large granules with about 0,5 inch diameter, as illustrated in figure 4. The in-line NIR spectra with moisture content of 14% were excluded from the calibration model because accuracy decreases due to high noise on spectra.
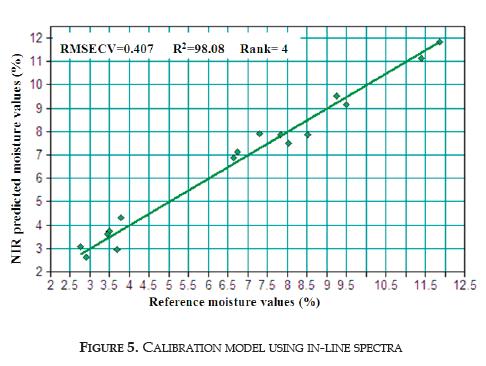
Figure 5 shows the accuracy of the calibration model to discriminate training samples. High R2, and low RMSECV indicate that the predicted values are close to the true values. Table 1 summarizes the statistical results obtained for each spectrum pre-treatment to determine the optimal calibration model. The application of PLS with vector normalization spectral pre-treatment yields the higher accuracy to predict training and testing samples.
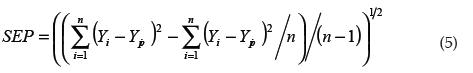
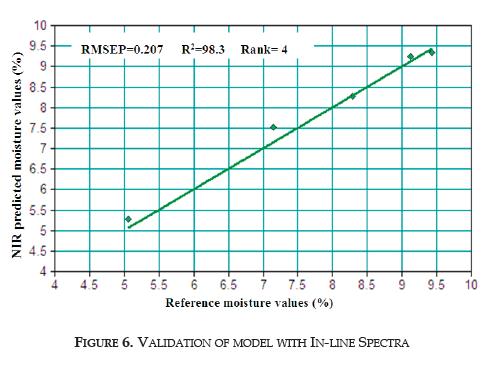
The accuracy of the calibration model indicated by the RMSEP to predict testing samples was 0.207% as shown in figure 6. This accuracy can be considered good when it is compared to the 0.27% accuracy obtained by Rivera [28] in a fluid bed dryer. The accuracy obtained by means of the standard error of performance (SEP) (equation 5) was 0.21%. The accuracy 0.20% value indicated by the SEP is considered enough for in-line measurements in a fluid bed granulator [1].
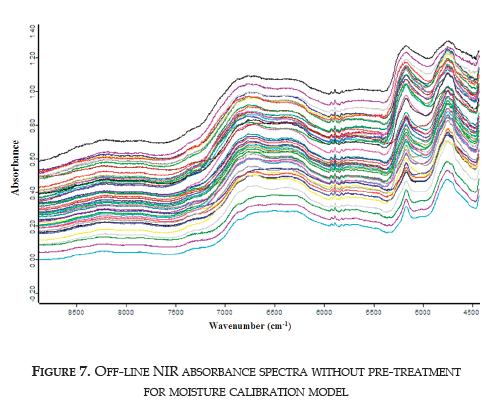
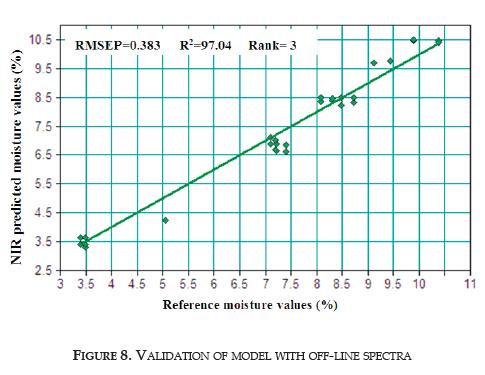
Comparison of in-line and off-line measurements using NIR Spectroscopy Off-line spectra present lower noise than in-line spectra as shown in figures 7 and 2, respectively. The calibration model obtained from off-line NIR spectra without pre-treatment yields high accuracy to predict testing samples with a high R2 value and a low RMSEP as indicated in figure 8. The accuracy of the in-line measurements is confirmed with the analysis of the Student's t-test by comparison with off-line measurements. The Student's t-test indicates that the off-line and the in-line measurements are not significantly different at the 95% confidence level. This is very important since NIR spectroscopy has been used as a suitable tool for off-line determination of moisture content.
CONCLUSIONS
This paper shows that the multivariate model using NIR spectroscopy is capable to work with high accuracy for in-line determination of moisture content during a high shear granulation process. The accuracy of the calibration model was 0.207%, as indicated by the RMSEP, which is a good value as compared with the values of about 0.27% reported in the literature.
The NIR would be considered as a process analytical technology tool to determine the moisture content during wet granulation in a full-scale high shear mixer. In addition, the NIR spectrometer can be used to take full inline and off-line spectra with low noise when the moisture content in the granulation process is below 10%, although NIR spectra taken with 14% moisture content presented high noise. These spectra, with high noise, were not suitable to build the calibration model. The noise observed in the in-line NIR spectra with moisture content of 12 and 14% would be associated to the insufficient contact of NIR beam with lactose granules due to the voids between large granules. From which, it is recommended to use NIR light beam with large reach to make contact with the granules, and reducing in this way the noise.
Acknowledgments
We are grateful to Angel Zapata, Efren Gregory, Mariel García and Mayra Semidey for their collaboration during the equipment setup. Thanks to the INDUNIV for their financial support with grant No. G-05-01.
REFERENCES
[1] J. Rantanen et al., "On-line monitoring of mixture content in an instrument fluidized bed granulator with a multi-channel NIR moisture sensor," Powder Technology, vol. 99, pp.163-170, 1998. [ Links ]
[2] J. Rantanen et al., "Use near-infrared reflectance method for measurement of moisture content during granulation," Pharm. Dev. Technol., vol. 5, no.2, pp. 209-217, 2000. [ Links ]
[3] A. Realpe and C. Velazquez, "Growth kinetics and mechanism of wet granulation in a laboratory-scale high shear mixer: Effect of initial polydispersity of particle size," Chemical Engineering Science, vol. 63, pp. 1602 - 1611, 2008. [ Links ]
[4] A. Realpe, et al., "Agglomeration modeling of small and large particles by a diffusion theory approach," AIChE Journal, vol. 55, no.5, pp. 1127-1134, 2009. [ Links ]
[5] A. Jaegerskou et al., "Granulation in high speed mixers. Part 3: Effects of process variables on the intragranular porosity," Pharm. Ind., vol. 46, no.3, pp. 310-314, 1984. [ Links ]
[6] N. Ouchiyama, and T. Tanaka, "The probability of coalescence in granulation kinetics," Ind. Eng. Chem. Process Des. Dev., vol. 14, pp. 286-289, 1975. [ Links ]
[7] M. Mackaplow et al., "Effect of primary particle size on granule growth and endpoint determination in high-shear wet granulation," Powder Technology, vol. 108, pp. 32-45, 2000. [ Links ]
[8] S. Iveson et al., "Fundamental studies of granule consolidation part 1: Effects of binder content and binder viscosity," Powder Technology, vol. 88, pp. 15-20, 1996. [ Links ]
[9] D. Wetzel, "Near-infrared reflectance analysis: Sleeper among spectroscopic techniques," Anal. Chem., vol. 55, no.12, pp. 1165A-1175A, 1983. [ Links ]
[10] J. Ramirez et al., "A novel method for analyzing thick tablets by near infrared spectroscopy," AAPS PharmSciTech, vol. 2, no.E11, 2001. [ Links ]
[11] R. Romanach and M. Santos, "Content uniformity testing with near infrared spectroscopy," Am Pharm Rev., vol. 6, pp. 62-67, 2003. [ Links ]
[12] C. Meza et al., "Quantitation of drug content in a low dosage formulation by transmission near infrared spectroscopy," AAPS PharmSciTech, vol. 7, no.1: Article pp. 29, 2006. [ Links ]
[13] K. Buijs and G. Choppin, "Near- infrared studies of the structure of water-I.Pure Water," J. Chem. Phys., vol. 39, pp. 2035-2041, 1963. [ Links ]
[14] J. Curcio and C. Petty, "The near- infrared absorption spectrum of liquid water," J. Optic. Soc. Am., vol. 41, pp. 302-304, 1951. [ Links ]
[15] Jr. Workman and L. Weyer, Practical Guide to Interpretive Near-Infrared Spectroscopy. Taylor & Francis Group, Boca Raton, FL, 2008. [ Links ]
[16] C. Pasquini, "Near infrared spectroscopy: fundamentals, practical aspects and analytical applications," Journal of the Brazilian Chemical Society, vol. 14, no.2, pp. 198-219, 2003. [ Links ]
[17] A. Realpe and C. Velazquez, "Pattern recognition for characterization of pharmaceutical powders," Powder Technology, vol. 169, no.2, pp. 108-113, 2006. [ Links ]
[18] J. Duckworth, "Spectroscopic quantitative analysis," In Applied Spectroscopy, a Compact Reference for Practitioners, Eds. J. Workman and A. Springsteen, Academic Press, San Diego, CA, 1998, pp. 93-190. [ Links ]
[19] P. Geladi et al., "Linerization and Scatter-Correction for Near-Infrared Reflectance Spectra of Meat," Applied. Spectroscopy, vol. 39 no. 3, pp. 491- 500, 1985. [ Links ]
[20] R. Barnes et al., "Standard Normal Variate Transformation and De-trending of Near-Infrared Diffuse Reflectance Spectra," Applied Spectroscopy, vol. 43, no.5, pp. 772-777, 1989. [ Links ]
[21] W. Hruschka, Data Analysis: Wavelength Selection Methods, in volume: Williams, P. and Norris, K. (eds.): Near-Infrared Technology in the Agricultural and Food Industries. American Association of Cereal Chemists, St. Paul, Minnesota, USA, pp. 35-55, 1987. [ Links ]
[22] M. Pasikatan et al., "Evaluation of a near-infrared reflectance spectrometer as a granulation sensor for first-break ground wheat: studies with hard red winter wheats," Cereal Chemistry, vol. 79, no.1, pp.92-97, 2002. [ Links ]
[23] J. Hall et al., "Analysis of polymer pellets obtained from two extruders using near infrared spectroscopy," J. Near Infrared spectroscopy, vol. 1, pp. 55-62, 1993. [ Links ]
[24] J. Irons et al., "Prediction and measurement of soil bidirectional reflectance," IEEE Transactions on Geoscience and Remote Sensing, vol. 30, pp. 249-260, 1992. [ Links ]
[25] B. Osborne et al., Practical NIR Spectroscopy with Applications in Food Beverage Industry Analysis, Longman, Harlow, UK., 1993. [ Links ]
[26] P. Frake et al., "Process control and end-point determination of a fluid-bed granulation by application of near- infrared spectroscopy," Int. J. Pharm., vol. 151, pp. 75-80, 1997. [ Links ]
[27] C. Cai and D. Radspinner, "A novel approach to determining particle size distribution of pharmaceutical powders by near infrared spectroscopy," Pharmaceutical Review, vol. 8, no.6, pp. 51-56, 2005. [ Links ]
[28] E. Rivera, "Optimization of drying-end-points measurements for the automation of a fluidized-bed dryer using FT-NIR spectroscopy," M.S. thesis, Dept. Chem. Eng., University of Puerto Rico, Mayagüez, Puerto Rico, 2004. [ Links ]
