


 English (pdf)
 Article in xml format
 Article references
 Send this article by e-mail
 Cited by SciELO
  Cited by Google
  Similars in
SciELO
Similars in
SciELO  Similars in Google
 Permalink
INTRODUCTION
The last decades have been a time of rapid change in Chilean's higher education sector. New private universities emerged, and students registered in Higher Education Institutions (HEIS) increased from 150.000 in 1994, to 1.144.184 in 2020. Although public spending on Chilean tertiary education is financed by public and private sources, government expenditure as a percentage of Gross Domestic Product was reported to grow from 0,5 % in 1997, to 1,359 % in 2017. This expansion in the number of students has placed extra pressure on governmental financial resources, and on HEIS to remain competitive. In this context, it is vital for public universities to improve their performance in order to better use public resources. The aim of this study was to estimate the efficiency of 30 academic departments of a regional, public, state-owned university located in southern Chile, in light of the fact that the Chilean government at the time, started to assign university budgets using a different funding policy. This university -as well as others- had to produce state-of-the-art qualitative and quantitative research and provide high quality education at undergraduate and graduate level, mainly using the financial resources provided by the state. The need in measuring technical efficiency was motivated by questions about the performance of the departments. Were financial resources being used in an efficient manner by all departments? What variables affected their efficiency performance the most? Academic departments that develop higher levels of teaching are technically more efficient than those focused mostly on research, considering that external variables do affect their performance level. When considering educational issues, efficiency estimation must consider intangible factors, such as the outputs of higher education or the process of education, both part of the quality of the service provided. The study used Data Envelopment Analysis (DEA) methods [1] to estimate technical efficiency scores. The findings on returns to scale were used to go further, by examining the inefficiency of the departments, using a multivariate analysis via a Biplot model [2]-[3], to characterize them and to identify the variables that affect efficiency. DEA is ideal for activities with a large number of units using multiple inputs to produce multiple outputs, since this method estimates efficiency scores for complex systems without making assumptions about the efficiency frontier [4]. The number of technically inefficient academic departments is greater than the number of technically efficient academic departments in all models; those academic departments with higher levels of teaching were more efficient than those focused mostly on research. Clustering helped identifying the variables that most affect the level of performance. By analyzing existing potential performance improvements, the results provided feedback for local authorities to support their decision-making process.
MATERIALS AND METHODOLOGY
In higher educational systems, efficiency can be analyzed from two perspectives: external, which tries to maximize the benefit that education provides to society; and internal, which tries to produce results with the lowest possible cost. In order to evaluate internal efficiency, a production function must be built. This function shall represent the process by which each of the Decision-Making Units (DMUS), in this case each Academic Department, transforms its inputs into outputs. Usually, the production objectives are used as a reference. According to Jarrat [5], said objectives for a university are to properly educate its students with skills and competences that will allow them to insert themselves into the job market, to create new knowledge, and to transmit general culture to society. Those objectives are reached through teaching, research and innovation, and outreach activities, which are performed, simultaneously, using the same inputs.
To measure teaching results, variables should adequately reflect the product of this process for each knowledge area. The selection and use of variables that best approximate the educational process, without skewing the results in favor of any DMU, depended on their availability and neutral condition. Research is another important component; however, making comparisons between knowledge areas and researchers is complex, which is why the authors weighted such variables following guidelines provided by the institution. Finally, outreach activities are part of the educational process, and the university's contribution to society.
The revised literature classifies input variables as work or capital factor [6]. In the first group, the teaching faculty variable is widely used; some authors split it based on qualifications and dedicated working hours; using a Full Workday Equivalency is neutral between the areas of knowledge, since it homogenizes the time dedicated to productive activities. For capital, it is customary to utilize personnel and operating costs. Since such monetary expenditures vary depending on several factors, as well as by knowledge area, they were not considered in this study.
Evaluation Models
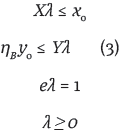
Modern literature frequently uses the DEA technique, since it's a better tool to represent the production characteristics of an educational system with multivariable scopes. DEA utilizes linear programing to define an envelopment area, based on the group of units being analyzed. This envelopment area is known as the efficient frontier, or empirical production function. The main advantage of using DEA lies in the modelling of the process, which assumes a specific functional form for the production function. This also allows the use of multiple results, a limitation of parametric techniques such as Stochastic Frontier Analysis or Ordinary Least Square. The absence of prices in the public sector is solved by DEA in an endogenous manner, maximizing the productive efficiency of each of the studied units by objectively fixing optimal values, making DEA a flexible analysis tool with the ability to adapt. The main disadvantages of DEA are its deterministic nature, the process of selecting the variables, and the sensitivity to the presence of measurement errors in the variables, which may generate outliers. The estimation of technical efficiency is input-oriented when trying to achieve the maximum proportional reduction for the outputs, while maintaining the outputs produced on the efficiency frontier; the technique can be re-oriented towards results when it is desired to maximize the proportional increase of the outputs given a certain level of inputs. A DMU is considered efficient when it is no longer possible to increase the outputs while maintaining a fixed number of inputs, nor is it possible to reduce the inputs without altering the number of outputs [7]. As this study analyzes departments of a state-owned institution with limited resources that must be maximized, a DEA output-oriented model was chosen. There are two basic DEA models: one where the percentage increase of the outputs is equal to the percentage increase of the inputs, known as constant, and one where the percentage increase of outputs and inputs are different, known as variable. The usage of data in the form of a relation is typical in the services' sector. This implies the use of Constant Returns to Scale (CRS); although, the use of rates creates a convexity problem in the Group of Production Possibilities. Hollingsworth and Smith [8] suggest using a formulation of Variable Returns to Scale (VRS), despite its use of rates, and thus, several authors have followed. The overall technical efficiency is measured with the CRS model; this implies that the same scale level must be used for all the DMUs. The estimation of pure technical efficiency by means of the VRS model measures the level of efficiency represented by each DMU, when compared with another one of similar dimensions. From the relation between overall technical efficiency and pure technical efficiency, we obtain the scale efficiency. From a management point of view, it is important to determine how much is productivity affected by the scale of operations. A model that maximizes results without changing the number of required inputs is known as output-oriented, and it is solved by:

Subject to:
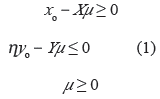
If λ = µ/η, Θ=1/η then an optimal solution for the output-oriented model is related to the input orientation by η* = 1/ Θ, µ* = λ*/0*. The gap (t -, t+) of the output-oriented model is determined by Xµ + t - = x o and Yµ - t + = η у o , which have values related to the input-oriented model by t-*= s */ Θ *, t+*= s +*/Θ*. Given that 0< 1, η* satisfies η* ≥ 1 Thus, the larger the value of η*, the less efficient the DMU. While Θ * expresses input reduction, η* express output expansion. An input-oriented CRS model would be efficient for any DMU if, and only if, said DMU is also efficient when using an output-oriented CRS model to evaluate its performance. The optimal solution for the dual model, obtained from the p and qvectors, is obtained from p*=v*/ Θ *, q*=u*/ Θ *. The VRS model [9] relaxes such assumption by including the following condition to the CRS model:
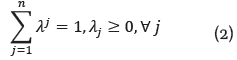
The output-oriented vrs model measures the efficiency of the DMU 0 (o = 1,2,n) by solving the following linear problem:

Subject to:
To analyze the influence of external factors, a Biplot [2] model was used. Its main objective is to provide an approximated graphical display of the data, with a high enough quality that would allow for visually noticing the relationships between groups of individuals and variables, as well as the relationship between the elements of each group. Representation on a plane provides a window on top of the geometrical structures of the data, without any assumptions regarding the underlying probabilistic distributions. Therefore, it provides a graphical representation displaying the joint distribution of several variables, in the same way that a dispersion diagram shows the joint distribution of two variables [2], [10]. To the best of our knowledge, the use of a Biplot model in a Second stage-DEA has not been previously used in the Chilean tertiary educational systems, but it has been used in healthcare [3] and another services.
Variable Selection
In order to prevent any biases when estimating scores, some authors suggest making a conglomerate of the units under study before performing the efficiency study [11]. Academic Departments are, by definition, homogenous by working under the same rules, regarding their operation. Using a high number of variables reduces discrimination when estimating relative efficiency, and it could assign high ponderations to less relevant variables. To solve this, Cooper et al. [12] suggests that the number of DMUS must be equal to 3 times the summation of input and output variables. As such, for this study, the sum of variables could not be superior to 10. The variables were chosen based on the literature review, expert judgement, and available data. Regarding input variables, there is no consensus regarding which ones should be used; among the employed ones are: academic and non-academic personnel [13]; number of students, personnel, and external funding [14]; total income per student and weekly teaching hours per student [15]; faculty, tenured faculty, associate professor, assistant professor, instructors, department budget [16]; yearly budget, public origin resources, resources for technological transfers, number of researchers [17]. Regarding outputs variables, some commonly used ones are: undergraduate enrollment, graduate enrollment, number of researchers, student retention rate, student progress rate, full-time employed graduate's ratio [13]; number of graduates and number of doctors [14]; rate of students from each academic unit with qualifications greater than 5 in their selection tests, coefficient of the average grade of selectivity for each center [15]; percentage of faculty with good academic performance evaluations, number of credits offered by each department, number of graduates within the first and second cycles, number of students in their third cycle in each department, number of publications, income per research project [16]; number of publications, number of technological transferal contracts [17]. The selection of variables is a critical aspect of the analysis. Besides, they must fulfill the following conditions: (i) have a solid conceptual and empirical base that justifies the relation between inputs and outputs; (ii) the relation must mean that an increase in the inputs means an increase in the outputs; (iii) the values reached by the variables cannot be null [18]; all of these elements were complied by the used variables. Data was obtained from the departments of six faculties: Law and Business Sciences; Education, Social Sciences and Humanities; Engineering and Sciences; Dentistry; Agricultural and Forestry Sciences; and Medicine. After careful revision, for the DEA models, three input and seven output variables were selected. For the Biplot model, six external variables were chosen. A summary of descriptive statistics is shown in table 1.
TABLE 1 DESCRIPTIVE STATISTICS FOR VARIABLES USED IN DEA AND BIPLOT MODELS. N = 30

Source: the author.
After defining the variables over which the productive efficiency of each DMU was to be estimated, the authors specified the DEA models to estimate the efficiency scores. A correlation study was performed on the studied variables, which presented a high correlation index with a significance level of 0,05, this means that the studied variables were mutually independent and valid for the efficiency study.
Model Descriptions
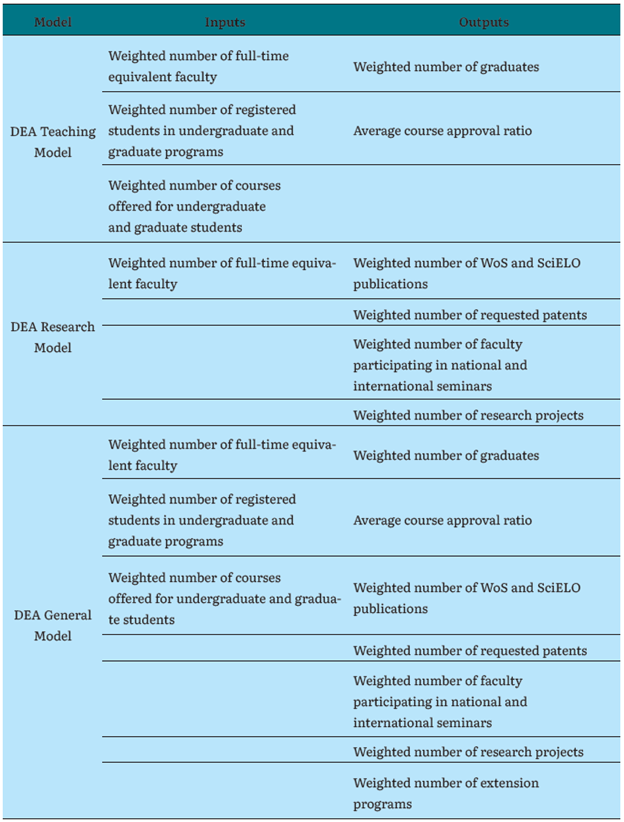
Three different model configurations were used to evaluate six scenarios. The first one was named "DEA Teaching Model", focused on the measurement of productive efficiency from the perspective of the education process; three input and two output variables were used. The second model was named "DEA Research Model"; it used one input and four output variables, focused on research. The third one was named "DEA General Model"; it included three input and seven output variables. A summary is shown in table 2.
RESULTS AND DISCUSSION
Table 3 shows the results of using three output-oriented DEA models with a CRS and a VRS approach. The descriptive statistics findings for the Teaching Model shows that under CRS, there were 7 technically efficient DMUS, and when using the VRS model, there were 11 technically efficient DMUS, i.e., 23% and 37%, respectively. The average efficiency was 0,699 for CRS and 0,942 for VRS. This means that academic departments could increase outputs by 30,1% and 5,8%, respectively. Clearly, there were inefficiencies in both scores regardless of the chosen model, being larger for the CRS model, since this model combined both, technical and scale inefficiency; 10 DMUS had decreasing returns to scale, while the other 20 had constant returns to scale. Regarding the DMUS (11) that appeared most commonly as reference points for the inefficient departments with the VRS model, 5 belong to Medicine, 1 to Agricultural Sciences, 2 to Education, Humanities and Social Sciences, and 2 to Engineering and Sciences. For the Research Model, the CRS model found 3 technically efficient DMUS, and the VRS model found 8 efficient units; this means that, 10% and 27% of the units were efficient, respectively.
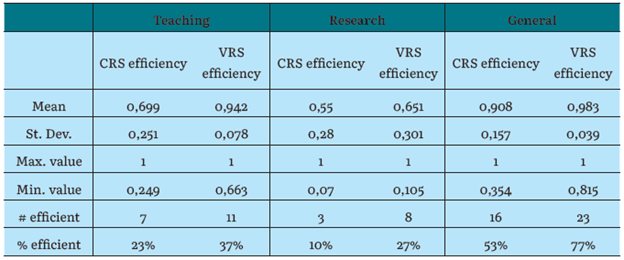
The values for the CRS and the VRS technical efficiency, on average, were 0,55 and 0,651, correspondingly. Regarding the DMUs (8) that appeared most commonly as reference points for the inefficient departments using the VRS model, 3 belong to Medicine, 1 to Agricultural Sciences, and 4 to Engineering and Science; 17 academic departments had decreasing returns to scale, 1 had increasing returns to scale, and 12 had constant returns to scale. When combining all variables in a General DEA model, the results from Table 3 indicated that the CRS model had 16 technically efficient DMUS versus 23 from the VRS model, i.e., 53% and 77%. The CRS and the VRS technical efficiency values, on average, were 0,908 and 0,983, respectively. This means that, when using all variables, there was an increase of efficiency performance for most DMUS; 11 of the departments had decreasing returns to scale, 1 had increasing return to scale, and 18 had constant returns to scale. Three DMUS from Medicine were efficient in all DEA-VRS models: Teaching, Research, and General. These DMUS were found to be efficient in all VRS models. This suggests that they can generate extra outputs and their best practices should be studied to help others improve. In general, academic departments could increase outputs, given the actual conditions, by 6% in the VRS Teaching model, 35% in the VRS Research model, and 2% in the VRS combined model. The higher efficiency scores for the Teaching model suggests that undergraduate and graduate teaching explains most of the efficiency scores. On the other hand, the Research model is a key factor for some DMUS. This finding suggests that teaching consumes most of the resources, and when isolating research, the efficiency of less robust departments decreases. This is consistent with the productivity level and the capacity of some academic departments to produce indexed publications and to work on research projects, as a consequence of asymmetries among them. The DMUS with increasing returns to scale should consider escalating their operational level in order to increase productivity levels. The results were close to the inefficiency reported by Cáceres et al. [26] for departments of another Chilean university, although a different approach (one stage DEA) and variables were used. It indicates a similar behavior that is not sensitive to variables at the efficiency level, such as the focus on teaching, rather than on research.
To characterize the departments, and to identify the variables affecting their inefficiency levels, a Biplot analysis was performed using 16 variables (mentioned in Table 1) and the 2 efficiency scores for the Teaching DEA model (Code in figure 1: MODAC) and the Research DEA model (Code in figure 1: MODIN). The efficiency score for the General DEA model was not included as variable in the analysis because it did not show enough statistical variability. Figure 1 shows a graphical approximation of the analyzed data, which visually represents the interrelations between the inefficient scores of the DMUS shown as dots, while the variables are presented as vectors. The longer the vector, the higher the influence. The smaller the angle, the closer the relationship.
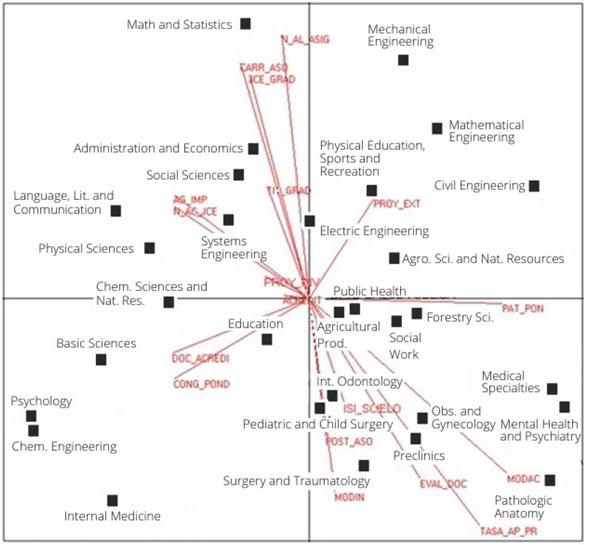
Results showed that 55% of the efficiency for the Teaching model was explained by the variable Average course approval ratio (TASA_AP_PR). and 5.3% by Weighted number of registered students in undergraduate and graduate programs (N_AL_ASIG). For the Research model, 70.7% of the variability of the performance level was explained by the variables Weighted number of faculty participating in national and international seminars (CONG_POND) and Weighted number of WoS and SciELO publications (ISI-SCIELO). For the General Model, 29.9% of the variability of the performance level was explained by the variable Weighted number of registered students in undergraduate and graduate programs (N_AL_ASIG) and 2.7% by the variable Weighted number of WoS and SciELO publications (ISI_SCIELO).
On the other hand, the Biplot model revealed a combination of the selected variables; it identified them as superior and inferior according to the score of each DMU for each variable. It also classified the departments into four different groups, as exhibited in figure 2.
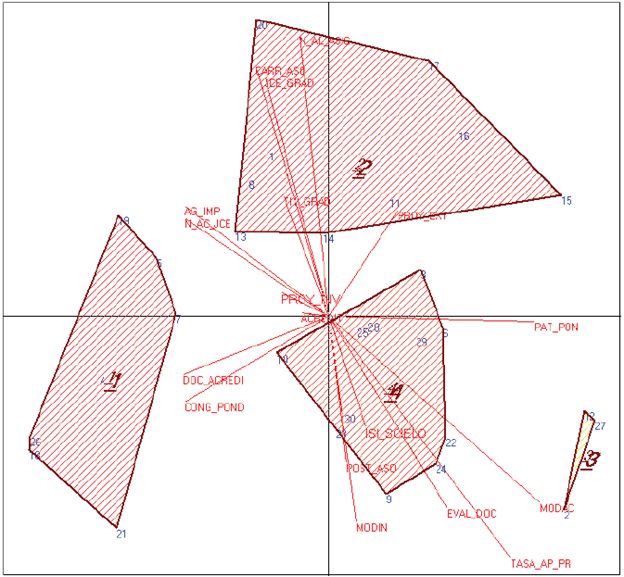
Group 1: Internal Medicine; Psychology; Chemical Engineering; Languages, Literature and Communication; Physical Sciences; Chemical Sciences and Natural Resources; Basic Sciences. Four statistically relevant variables (p < 0,05) were found: Number of full-time equivalent faculty holding graduate studies (JCE_GRAD); Weighted number of courses offered for undergraduate and graduate students (AG_IMP); Weighted number of faculty participating in national and international seminars (CONG_POND); and Weighted number of accredited faculty (DOC_ACREDI); all those variables were considered as very superior. The variables number of full-time equivalent faculty holding graduate studies (JCE_GRAD) and the Research Model efficiency score (MODIN), were considered as superior variables.
Group 2: Civil Engineering; Mechanical Engineering; Mathematical Engineering; Mathematics and Statistics; Electric Engineering; Physical Education, Sports and Recreation; Systems Engineering; Social Sciences; and Administration and Economics. It was characterized by six statistically relevant variables (p < 0,05), four of them being very inferior: Weighted number of WoS and SciELO publications (ISI_ SCIELO); Number of associated graduate programs (POST_ASO); Weighted number of accredited faculty (DOC_ACREDI); and the Research Model efficiency score (MODIN)). Two variables were considered inferior: Weighted number of faculty participating in national and international seminars (CONG_POND); and Faculty academic performance evaluation (EVAL_DOC).
Group 3: Pathologic Anatomy; Mental Health and Psychiatry; Medical Specialties. This group identified ten statistically relevant variables (p < 0,05). Six of them were identified as very inferior ones: Number of full-time equivalent faculty (N_AC_JCE); Weighted number of courses offered for undergraduate and graduate students (AG_ IMP); Weighted number of faculty participating in national and international seminars (CONG_POND); Number of associated undergraduate programs (CARR_ASO); Weighted number of accredited faculty (DOC_ACREDI); and Number of full-time equivalent faculty holding graduate studies (JCE-GRAD). Two variables were considered inferior: Weighted number of registered students in undergraduate and graduate programs (N_AL_ASIG) and Weighted Number of extension programs (POY-EXT). There was one superior variable, Average course approval ratio (TASA_AP_PR) and one very superior variable, Teaching Model efficiency score (MODAC).
Group 4: Public Health; Agricultural Production; Agronomic Sciences and Natural Resources; Social Work; Forest Sciences; Surgery and Traumatology; Preclinical; Obstetrics and Gynecology; Integral Odontology; Pediatric and Child Surgery; Education. it concentrated the largest number of Academic Departments and was characterized for having five statistically relevant variables (p < 0,05). Two variables, Weighted number of research projects (PROY_INV) and Number of associated undergraduate programs (CARR_ASO) were considered very inferior; one variable, Weighted number of courses offered for undergraduate and graduate students (AG_ IMP), was considered inferior; two variables, the Teaching Model efficiency score (MODAC), and the Average course approval ratio (TASA_AP_PR), were considered superior and very superior, respectively.
In summary, three clusters - Group 1, Group 3 and Group 4 - had superior or very superior variables. Group 1 included 63% of the units identified as efficient by the VRS Research DEA model; consistently, the superior variable identified by the Biplot was the research efficiency score (MODIN) and the number of full-time equivalent faculty holding graduate studies (JCE_GRAD), meaning that units with more qualified staff produces more research. It also included 18% of the efficient departments classified as such by the VRS Teaching DEA model. Group 3 and Group 4 shared the same superior variable, Average course approval ratio (TASA_AP_PR), and very superior variable, the Teaching Model efficiency score (MODAC), being consistent with the performance level obtained. Group 3 accounted for 25% of units identified as efficient by the VRS Research DEA model, and Group 4 included 27% of the efficient departments of the VRS Teaching DEA model. Group 2 did not have any superior or very superior variables but accounted for 36% of the efficient units from the VRS Teaching DEA model.
The use of Biplot helped confirm the focus on teaching or research for the units under analysis. Although clustering techniques or methods have been extensively applied to find groups within data, they ignore the input-output relationship that DEA uses. Thus, combining them was a powerful tool for this study.
CONCLUSIONS
From the analysis of overall and pure technical efficiency, it was found that, on average, academic departments could improve their performance by increasing the proportional number of outputs. Academic departments with higher levels of teaching were technically more efficient than those focused mostly on research. Only 3 departments were technically efficient in all 3 VRS models; all of them belong to the Faculty of Medicine; two were characterized in Group 4 and one in Group 1 by the Biplot analysis.
Using the variable Faculty academic performance evaluation (EVAL_DOC) as output increases the efficiency score, thus significantly influencing the value for each Academic Department. Therefore, the use of the aforementioned variable is advisable in future studies as a second stage external variable, since students can positively or negatively evaluate a faculty member depending on their passing grade in a given class, and not always based on the performance of the faculty member. Although this variable is important for the departments, its subjectivity could skew the efficiency score. A policy implication may need to include more objective questionnaires to have academic performance-based measurements. Although other studies have used DEA and clustering in Latin America countries, they have focused on other services [27-28]; in higher education, clustering has been used to characterize students [29] or to analyze education using DEA [30-32]. This study is the first to assess Chilean tertiary education with a two-stage DEA-Biplot analysis, adding to the literature in higher education. Decision-making top managers should focus on the use of inputs to produce more outputs, learning from efficient units. There are other variables that would be interesting to incorporate in future studies, such as faculty payroll and benefits, department budget, number of students with scholarships, freshman retention rate, among others that have been utilized, although not all of them, in Chilean [33-35] DEA studies.

