


 English (pdf)
 Article in xml format
 Article references
 Send this article by e-mail
 Cited by SciELO
  Cited by Google
  Similars in
SciELO
Similars in
SciELO  Similars in Google
 Permalink
INTRODUCTION
Colombia aims to contribute to the prevention of the 2° C temperature rise in the world. The country contributes approximately 0.46% of the greenhouse gases emissions in the world, and this percentage could rise in the upcoming years. For this reason, it should low its emissions by a 20% and, in doing so, contribute to the health of the planet [1].
Transportation systems are important for the reduction of greenhouse gases in Colombia. They are responsible for a high percentage of emissions that come from fossil fuels [2]. The Cop21 was a conference on climate change that took place in Paris, in 2015. There, each country committed to actions to mitigate climate change. Colombia committed to reducing greenhouse gases emissions by 20% by the year 2030. For this reason, Colombia has been proposing alternatives to reduce these emissions in the transport systems, considering alternatives like a renewal of the vehicle fleet, or the use of zero and low emission vehicles [3].
ideam has an inventory of the zones that produce the highest contamination of greenhouse gases, where the city of Bogotá and departments like Antioquia and the Valle of Cauca are noteworthy [2]. The World Health Organization (who) considers the following to be the primary polluting gases: particulate material (pm), the ozone (O3), nitrogen dioxide (NO2), and sulfur dioxide (SO2) [4], all of which are found in Colombia's principal cities and may affect health. This leads to a high mortality rate due to respiratory illnesses [5].
Therefore, the country must direct its efforts to diversify the energy that is using in transportation systems with zero and low emission options. Some models, like [6], [7] prioritize urban traffic. Conversely, the models presented in [8], [9] focus on the behavior and dynamic cycles of transport systems to estimate emissions and generate emissions inventories. Others models like [10], [11] integrate technical-economic factors. Although this phenomenon has been studied, the response of the government has been slow. The objective of this study is to present the development of a computational tool that facilitates the configuration of different energy scenarios where resources like natural gas and electricity are included as fuel sources for vehicle transport systems. The tool allows for the evaluation of the impact of these fuel sources on the energy matrix, air contamination, and ghg emissions in a particular place o city.
BACKGROUND
The national governments urgently need to reduce greenhouse and polluting gases emissions generated, mostly, by the operation of transportation systems. Focusing efforts to transition to systems that produce fewer emissions is key. Here is where vehicles powered by electricity, natural gas, hydrogen, and other zero and low emission fuels gain interest [12], [13].
Regarding electric systems, China leads the implementation of this technology as many of its transport systems, like taxis, buses, and public transportation, in general, are powered by electricity [14]. The European Commission published a list of countries that implement the use of alternative fuels by the year 2020. In this regard, the advances in countries like The Netherlands, Denmark, and Norway are noteworthy [15]. In Latin America and the Caribbean, progress has not been as significant. Nevertheless, Chile has already introduced electric buses in its public transportation system. Likewise, some cities in Uruguay and Mexico City have electric taxis. Colombia, through the Environmental and Sustainable Development Ministry, has adopted the national mobility electricity strategy, whose goal is to incorporate at least 600 thousand electric vehicles by 2030. Moreover, Colombia is making efforts with tariff and tax incentives to encourage the use of electric vehicles [15], [16].
On the other hand, natural gas can be used as Compressed Natural Gas (cng) or Liquified Natural Gas (lng) in vehicular applications. Its use could help to considerably reduce contamination [17], as occurred in the United Kingdom. Its use in the United Kingdom lowered emissions by 34% [18]. Natural gas is considered a transition fuel toward an economy not dependent on fossil fuels. CNG is used mostly by light vehicles, principally in taxis and private vehicles [19], while lng is used in cargo vehicles like trucks and tractor-trailers, among others [20].
Regarding hydrogen, in September of 2021, the Colombian Ministry of Mines and Energy launched the Hydrogen Roadmap, which proposes, among other things, the use of this fuel in transportation systems.
The described panorama demonstrates the importance of the diversification of the energy sources offered for the transport sector. But this requires a computational tool containing data projections in the short-, medium-, and long-term to calculate the energy impact and vehicle emissions in different technological scenarios. There are some evaluation tools worth mentioning regarding energy diversification in transport systems. moves (motor Vehicle Emission Simulator) is a model that estimates the emissions of mobile sources for atmosphere pollutants and generates emission inventories, using measurements of the United States [21]. copert (Computer Programme to Calculate Emissions from Road Transport) does the same as moves, and it is used in Europe [22].
Other computational models that integrate economic, social, technological, and energy factors exist in other countries. In these, the behavior of pollutants associated with road transportation systems are analyzed [6]-[8], [10], [23]. Though these computational models of energy analyses are available in the world, many do not include measurements of conditions and vehicle fleets like those that operate in Latin America. For this reason, computational tools that facilitate the evaluation of energy consumption and vehicle emissions of each city, in different technological scenarios, as well as factoring in socioeconomic factors generating short-, medium-, and long-term projections, are required.
MATERIALS AND METHODS
The tool was developed using a computer with Intel Core I7 processor with 16 MB of RAM memory and a Windows 8 operating system. Frontend was developed with the REACT library, using the Javascript programming language. The Backend was developed with the Firebase service offered by Google, also using Javascript programming language. Finally, we used the Firestore Database with a NoSQL approach.
The agile methodology of extreme programming (xp) was used to develop the tool. The tool focuses on adaptability, contemplates constant requirement changes, is applied in small development teams, and focuses on the continuous building of computer code. After the first meetings between stakeholders and developers, it was concluded that five modules for the computational tool were needed. These modules will work sequentially and by iterations, as presented in Table 1.
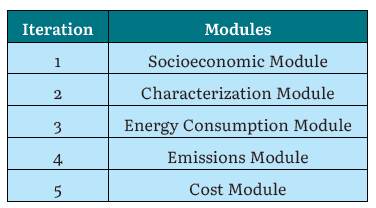
The "socioeconomic module" uses the behavior of the population growth and the gross domestic product per capita in the last decade to project them until the year 2070, by the Gompertz function. The projection of these socioeconomic parameters is the starting point to estimate the number of vehicles in the "fleet characterization module". The latter considers some of the characteristics of the vehicles, such as: the number of vehicles by class and motorization technology, the average kilometers traveled (avkt) by class, among others. This is done to project the number of vehicles for the period that will be analyzed. Subsequently, the total kilometers traveled (vkt) by class and technology is calculated, which is the input to calculate the energy consumption and the vehicle emissions. The tank to the wheel (ttw) energy consumption of the vehicles is calculated by class and engine technology, once the fuel economy for each technology is known. The well to tank (wtt) energy consumption is calculated based on factors depending on the energy source (gasoline, diesel, natural gas, electricity, hydrogen) and the energy required by each motorization technology. The "emissions module" considers: the vehicle emission factors, the vehicle useful life, and the year of entry of the Euro 6/VI standard in accordance with Colombian regulations. With these parameters, the emission module estimates the ttw emissions of co2, co, nox, and pm25. Additionally, wtt co2 emissions are calculated using emission factors for each energy source. The "cost module" is intended to show the economic effects of TTW emissions. The software uses the proposed methodology of the International Council on Clean Transportation (icct). This methodology utilizes the projections of the number of vehicles, the calculated polluting emissions of nox and pm2 , and the cost of living in Colombia to determine the economic costs in health, infrastructure, and human lives lost.
The xp methodology applies an object-oriented approach for each of the iterations described by the phases in Figure 1. During the planning, several meetings were held with stakeholders to construct the respective user stories.
In the design phase, initial ideas were discussed and represented through diagrams of use cases and activities, after which tools were used for an initial approach of a graphical interface. Finally, crc (class - responsibility - collaboration) cards were constructed, which facilitated the representation of the synthesis of needs of each class in the project [24]. In the coding phase, code corresponding to the design was written. Programming by pairs was applied, where one person coded and the other tested, and they then exchanged roles. This was done to meet the established requirements [25].
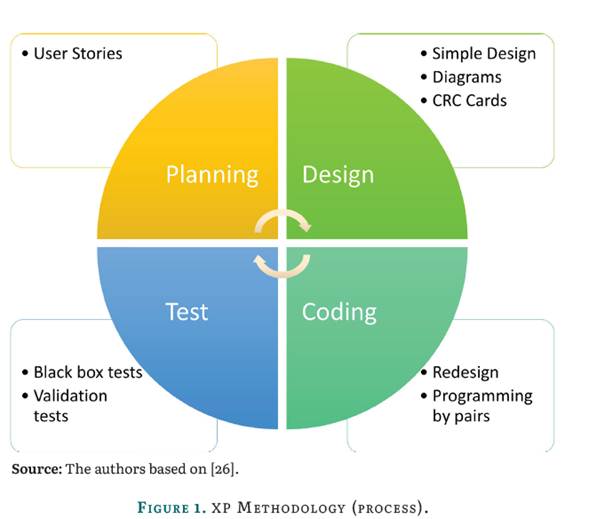
In the testing phase, validation of the computational tool was carried out, black box tests were used, and the system was developed specifically for inexperienced users, who enter data, make projections, and expect the correct results [27].
RESULTS
Prior to the development of the iterations, a user authentication system to access the tool was created, for which the use case diagram presented in Figure 2 was modeled, then coded.
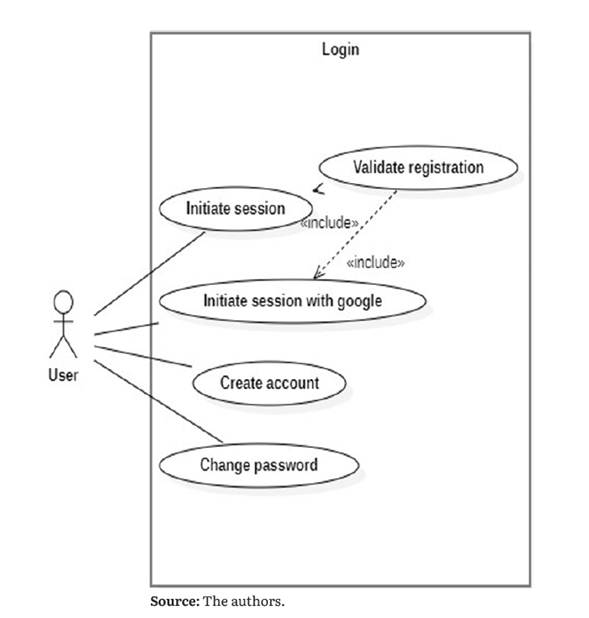
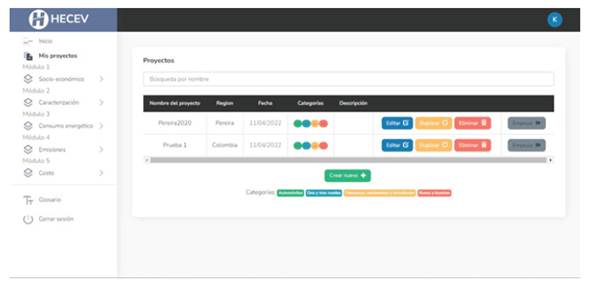
The user has two ways to access the tool: the first is by registering in the application, filling out a simple form; the second is through an authentication process via Gmail. Furthermore, the user loading the initial data will be able to move through different modules of the system. For this reason, the option "My Projects" was created. This allows the user to execute CSUD (create, search, update, and delete) operations of different projects. The developed interface is presented in Figure 3. With these two coded and tested options, the development of the planned iterations began, following the XP methodology. The socioeconomic module requires the following entry data:
The population, GDP (gross domestic product), and GDP per capita can be projected over time using population history and the GDP of the city. These data are also used to calculate indicators that contemplate the number of inhabitants and economic growth.
For the development of the first iteration, in the planning phase, the user history of the socioeconomic module was defined, after which the GDP, population, and number of vehicles by category that should be entered were determined. Moreover, this model has results presented in tables and graphic visualization. The results should stay stored in the database to later process in the other modules.
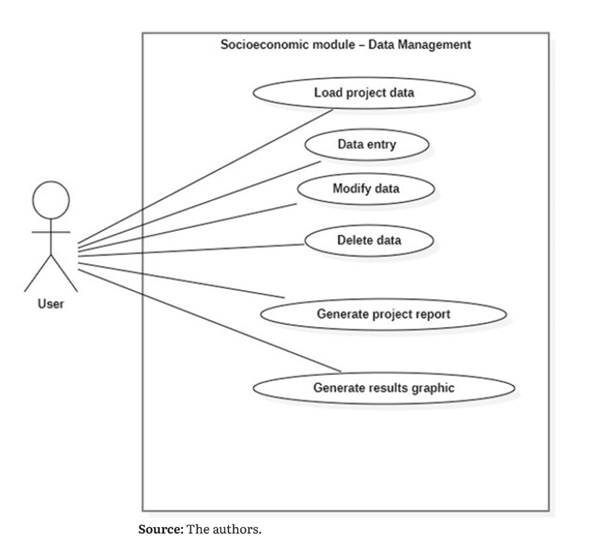
In the design phase, diagrams of use cases corresponding to data management were modeled in tables and graphs. In Figure 4, the socioeconomic module - data management use case diagram is presented. There, the procedures corresponding to data entry and subsequent processing were modeled to illustrate the information corresponding to the module.
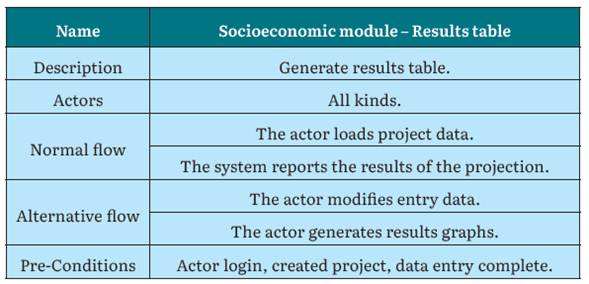
Then, the data management use cases, results table, and graphs were specified. For instance, Table 1 illustrates the specification of the use cases results table. The actors of the system, the preconditions that must be met for normal flow when the application has no errors, as well as alternative flows for errors, were defined.
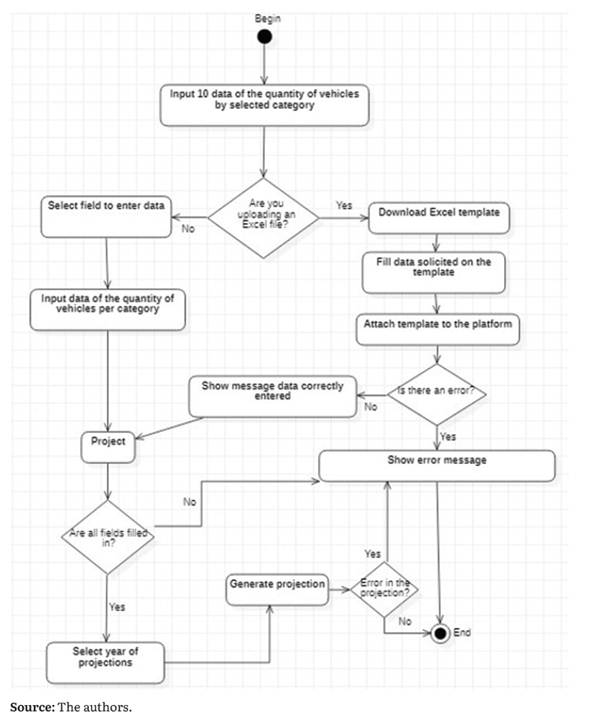
In the same design phase, a diagram of activities related to the data entry process was built, which is presented in Figure 5. The diagram facilitates the identification of activities like manually entering fields or extracting from an Excel file, the way to select data, project data results of the module, and handling exceptions.
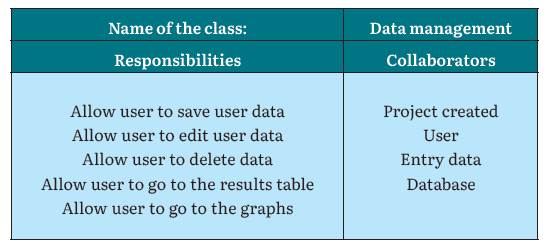
To synthesize data management, a CRC card was designed as a summary of the responsibilities of the class. The card is presented in Table 3.
In the data management coding phase, the programming language JavaScript was used for Frontend development via the React library. The Backend was programmed as a service of Firebase in JavaScript and used the firestore database, which is a NoSQL system, all of which are Google technologies.
Then, the user loads the initial data to perform all the calculations of the tool. Figure 6 shows the code fragment that permits fetching data from the database, asynchronously. With this code, the data table is filled, then the projections are generated.
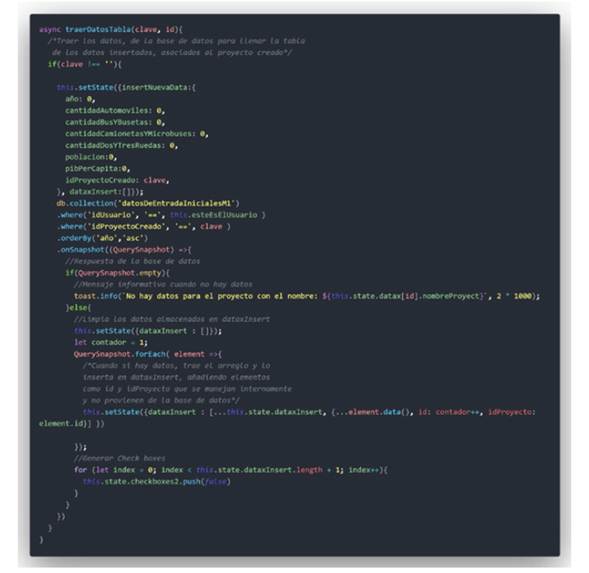
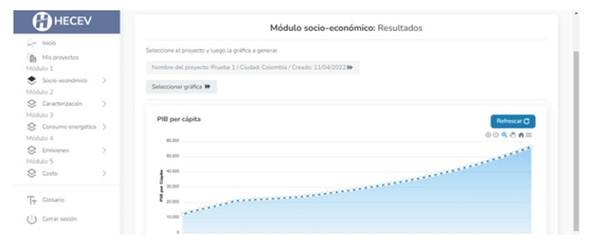
Figure 7 shows the final design of the graphic interface of the socioeconomic data management module after making the projection with the supplied data.
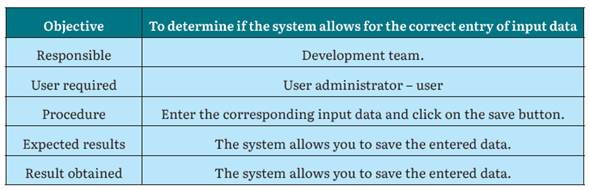
In the testing phase, the input of the data interface and the behavior of the system from the entered data were validated. The designed test is presented in Table 3, and it shows that the expected result was the same as the obtained result. Then, a user validation test was developed, where the stakeholders expressed their opinion about the developed module. To achieve this, a survey was designed with 7 statements: i) necessary requirements to obtain user information are met; ii) the data labels (names) are consistent with those required; iii) the data entry is understandable and corresponds to the needs of the module; iv) when projecting data, established standards are met; v) the results provided by the model are consistent with those that were expected; vi) the graphs associated with the data correspond to the results; vii) the mobility between subclasses of the module is pertinent.
After each statement, the stakeholder can respond with the following options: i) highly disagree; ii) disagree; iii) neutral; iv) agree; v) completely agree. Figure 8 shows the results of the responses.
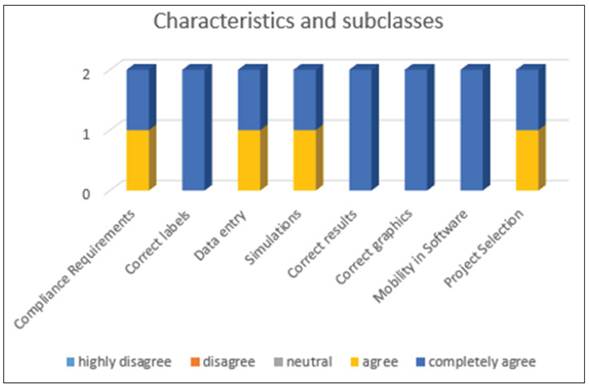
As is seen in Figure 8, the answers of the stakeholders mainly fall in the options "agree" and "completely agree". In the observation field, one of them wrote: "The socioeconomic module corresponds to what was expected. It worked effectively for the user. The results obtained are adjusted to the proposed needs." At this point, the first iteration corresponding to the socioeconomic module was completed.
The next task was to develop the remaining modules, for which four iterations were used, comparable to the iteration that was applied to the socioeconomic module. The fleet characteristic module was developed in iteration 2. Considering vehicle characteristics allows for projecting the number of vehicles for the period that was analyzed, thus finding the total number of kilometers traveled by class as well as by technology.
The energy consumption module was developed in iteration 3, which requires the data of module 2 to later calculate energy consumption by class and motor technology. After this, the performance data for each technology within the class is obtained. The emissions module was developed in iteration 4, in which carbon monoxide, carbon dioxide, nitrogen dioxide, and particle material emissions were projected. Finally, in iteration 5, the costs module was developed, in which models of environmental costs, human health costs, as well as infrastructure costs, were used. These all consider the cost of total emissions generated by the vehicle fleet.
DISCUSSIONS
The existing models try to simulate the behavior of the vehicles or their respective polluting gas emissions. For instance, one of the models is Roadmap [8], which consists of a tool that has several programmed modules using Microsoft Excel calculation sheets. In dracula [28], the user can model and later execute a microsimulation network to study the behavior of vehicular flow. Nevertheless, the authors recognize that their interface needs improvement. vissim [8] allows for the simulation of the behavior of the drivers and pedestrians, and it is characterized because of the high influence of the programming language C in its construction. Stern and Richardson [29] present a Framework focused on understanding the behavior of users before a determined driving action and how technology can help prevent accidents. Horni et al. [30] present matsim, a simulator that permits the generation of traffic and congestion patterns, considering individual travelers in daily and weekly activities, initially using the C++ programming language. It is currently used by many groups around the world and was programmed in the Java language. Rothengatter et al. [31] present a methodology that uses I-Think, a model generator with a user interface to analyze different emissions scenarios and has a high influence of the programming language Fortran. Pfaffenbichler [9], [32] presents mars, a model with three equations: the first one calculates automobile emissions; the second equation is for private vehicle carbon dioxide emissions; and the last one is for public vehicles carbon emissions. It used the Microsoft Visual Basic programming language.
The software applications are necessary to create simulations or projections where new forms of energy can be used for vehicle motorization and, thus, estimate how polluting gases emissions are reduced in these scenarios. Our contribution to the previous models is to highlight that, although distinct applications exist, software development methodologies and modern programming technologies, as those applied in this study, should be used.
With the development of our computational tool and, based on the tests performed in distinct modules, it was verified that our system allows for the configuration of distinct technological scenarios. The most relevant impact of the study is that several private and public institutions can use the tool and, thereby, improve the environment by reducing gas emissions, contributing to Colombia's cop21 commitment.
CONCLUSIONS AND FUTURE WORK
This study proposed the development of a computational tool in a web environment that allows for the implementation of various models to configure distinct technological scenarios to project what would happen with an increase in electric and natural gas vehicles. For the construction of the tool, the extreme programming (xp) methodology was used, where, after speaking with stakeholders, various iterations were defined. For each of these iterations, a module was developed. Thus, five modules were created: i) socioeconomic; ii) characterization; iii) energy consumption; iv) emissions; and v) costs. Within each module, the respective phases were applied: planning, design, coding, and tests. Using this methodology allowed for assertive communication between the stakeholders and the development team, which facilitated meeting the requirements of the application.
In the Frontend construction, the React bookstore of Facebook was used with JavaScript programming language. This resulted in a good performance of the application, because the dom could be dynamically generated, and the whole page did not need to be rendered with changes in data, instead, the corresponding components were updated, improving agility. The handling of components and the Isomorphism of React circumvented the use of a content management system (cms); moreover, the use of latest-generation technology like ecmascript 6 allowed for code legibility and versatility. Conversely, the Backend was used as the service that offers Google's Firebase. It is a cutting-edge technology because it allows for an intuitive integration, offers automated learning capabilities and speed in development, provides error-monitoring help, allows sharing data in real time, and provides good application security. As a database technology, Firestore was used, which is a NoSQL. This enables storing data like collections of documents, performs ordered and filtered indexed reports, manages advanced written and transaction operations, and it is scalable, has good security, and the costs are low.
According to the black box tests that were carried out in the system, and acknowledging the respective feedback of the stakeholders, it can be concluded that the computational system meets with the established requirements. The application of a methodology that can be useful to execute planned simulations and, thereby, contribute to the environment, meets the objective of its construction, making it a quality product.
To date, the tool has been dispersed among distinct groups of stakeholders in the cities of Bogotá, Medellín, and Pereira. In meetings, the need to continue with the development of the platform to maximize its potential became evident. Based on these meetings, the following future studies are anticipated: i) the inclusion of heavy-vehicles in the analysis categories; ii) on top of analyzing cities, particular sectors can be analyzed to study the impact of vehicular restrictions in those areas; iii) taking into account the impact of the wear of the vehicle on the concentration of generated emissions, depending on the use time; iv) to include the use life of vehicles to project a time estimate for vehicle circulation; and v) given that some data exists that is not available for Colombia, it was necessary to use international data. It is important to either validate the data being used or to collect said information for Colombia.

