


Services on Demand
Journal
Article
 English (pdf)
 Article in xml format
 Article references
 Send this article by e-mail
Indicators
-
 Cited by SciELO
 -
 Access statistics
Related links
-
 Cited by Google
 -
 Similars in
SciELO
Similars in
SciELO -
 Similars in Google
Share

 Permalink
Papel Politico
Print version ISSN 0122-4409
Pap.polit. vol.19 no.2 Bogotá July/Dec. 2014
https://doi.org/10.11144/Javeriana.PAPO19-2.oprc
Oil policies and the resource curse in Colombia and Ecuador*
Políticas petroleras y la maldición de los recursos en Colombia y Ecuador
Orlando Rodríguez García**
*Artículo de Investigación. Agradezco al Profesor Dr. Christoph Scherrer de la Kassel University por sus pertinentes comentarios durante el proceso de investigación, los errores restantes son mi entera responsabilidad.
**Master in Global Political Economy, Kassel University (Germany). Researcher in Political Science. Philosopher, Universidad Santo Tomás. Business Manager, Universidad Nacional Abierta y a Distancia. Journalist - Social Communicator, Universidad Católica de Pereira. Professor at the Economics Department of, Universidad Libre. E-mail: orlando.rodriguez@msn.com
Recibido: 27/01/2014 Aprobado: 03/03/2014 Disponible en línea: 01/07/2014
Cómo citar este artículo
Rodríguez, O. (2014). Oil policies and the resource curse in Colombia and Ecuador. Papel Político, 19(2). pp. 459-496. http://dx.doi.org/10.11144/Javeriana.PAPO19-2.oprc
Abstract
The world expects that oil countries grow faster than non-endowment economies. Though, the observed is the opposite. It is the resource curse, which leads to economic volatility (Auty, 2009). Some scholars assert that efficient institutions curb the curse, and lead to stable economic growth (Robinson, Torvik & Verdier, 2006). Other authors refuse the role of institutions (Warner & Sachs, 1995). This paper provides the main findings of a research through comparative methods in order to ask to what extent does institutional efficiency help Colombia and Ecuador to foster oil policies, which lead to stable economic growth in 1996-2013? It found evidence of the curse in the both economies during the oil boom. However, it made less impact in Colombia, because it experienced institutional transformation. In contrast, Ecuador diminished its institutional environment. Colombia described a more stable economic growth.
Keywords: new institutionalism; institutional efficiency; the resource curse; oil policies; economic growth
Resumen
El mundo espera que los países petroleros crezcan más rápido. Sin embargo, se observa lo contrario. Esa es la maldición de los recursos, que genera volatilidad económica (Auty, 2009). Algunos académicos aseguran que las instituciones eficientes evitan la maldición (Robinson, Torvik y Verdier, 2006). Otros autores niegan la incidencia de las instituciones (Warner y Sachs, 1995). Este artículo presenta los hallazgos principales de una investigación, que aplica un método comparativo para indagar ¿hasta qué punto la eficiencia institucional ayuda a Colombia y Ecuador a adoptar políticas petroleras, que conduzcan a un crecimiento económico estable? Se encontró evidencia de la maldición en las dos economías. Sin embargo, el impacto en Colombia fue menor porque experimentó una transformación institucional, mientras que Ecuador fue debilitado en su ambiente institucional. Colombia experimentó un crecimiento económico más estable.
Palabras clave: nuevo institucionalismo; eficiencia institucional; maldición de los recursos; políticas petroleras; crecimiento económico
Introduction
Oil-rich countries tend to experience lower economic growth than non-endowment countries (Auty, 2009). That paradox, known like the resource curse, is the starting point for this paper. It is explained by failures in institutions like political instability, high transaction cost or the lack of transparency, which avoids a stable economic growth (North, 2005). The research looks for empirical evidence of the resource curse through the oil reserve policies fostered by Colombia and Ecuador during the oil boom in 1996-2013.
The research is supported on the new institutional economics (NIE) theory (North, 2005). It states that institutions create the historical pattern to face uncertainty in periods of crises. The experience during a new crisis offers policy learning, through incremental changes on institutions in order to improve the economic growth. Efficient institutions make the difference in the pattern of growth among the economies. Institutions help to reduce transaction cost of political and economic exchanges. It allows economies to be involved in more complex negotiations, and to grow faster. However, some scholars refuse the role of institutions in the stability of economic growth (Warner & Sachs, 1995). Instead, they state that the resource curse is independent of institutions, and institutional efficiency neither prevent its causes nor reduces its effect. Therefore, this research looks for the role of institutions in the stability of economic growth.
The research asks to what extent does institutional efficiency help oil-rich countries to foster oil reserve policies, which lead to stable economic growth? The question is answered through a comparative research in the case of oil policies applied in Colombia and Ecuador in 1996-2013. It looks at institutional efficiency through informal institutions, institutional environment, institutional transparency and export transaction cost; oil policies like production rate, management of agencies, allocation of resources and control to boom-bust cycle; and the stable economic growth through commodity dependency, economic volatility, well-being and informal economy.
The research finds that the both countries are threatened by the resource curse. However, Colombia was able to manage its causes better than Ecuador. Colombia faced the late-1990s crisis by institutional transformation which reduced the effects of the curse (HDI, 2014). Colombia decreased its dependency on oil, promoting other sectors (Dane, 2014). In contrast, Ecuador was more vulnerable, because the rent-seeking cycle affected the institutional environment (Monty & Keith, 2009). Oil revenue was focused on central government spending rather than regional development. Other tradable sectors in Ecuador did not receive incentives and they lost competitiveness (ECB, 2014). Therefore, institutions made the difference in the stability of economic growth between Colombia and Ecuador.
The research includes four main parts. First, it is stated the theoretical approach. It introduces the puzzle of the resource curse (Auty, 1993), and the hypothesis about the role of institutions in economic growth according to NIE (North, 1990). Second, the methodology through a comparative research is justified, and it introduces the path to answer the research question through the operationalization of variables. Third, the main findings analyze the case studies focus on Colombia and Ecuador with a final comparison of their key differences. Finally, the conclusion suggests political and economic policies to curb the resource curse.
Theoretical approach
The resource curse is the counterintuitive phenomenon, where the most endowed countries perform low economic growth (Auty, 1993). Resource abundance is related to violent conflicts among illicit army groups for fertile land and internal migration; over-extraction of resources and environmental damage; corruption of rent-seeking governments; and poverty and low human development.
Researchers dispute whether is possible to curb the curse through efficient institutions. Warner and Sachs (1995) conclude that resource abundance leads to higher consumption rather than growth. They state that institutions do not make difference. Other scholars assert that institutional efficiency prevents resource mismanagement (Perry & Olivera, 2012). This paper follows the second theoretical frame, taking into account there is evidence of economies, which curb the curse through efficient institutions (Hagedorn, 2007), such as Norway (Stiglitz, 2007). It is a big oil-producer, which records high human development.
The hypothesis is that countries with more institutional failures tend to experience high volatility in economic growth rate. Therefore, institutional efficiency curbs the resource curse. Particularly, net oil exporters are exposed to the resource curse. However, they apply different oil policies. On the one hand, efficient institutions allow external overview on allocation of resources, transparency in the management of oil agencies, and a long term plan to control boom-bust cycles. On the other, economies with less efficient institutions have policy instability, short-horizon solutions, rent-seeking cycle, and lack of autonomy of oil agencies (Radon & Thaler, 2009). It avoids countries to monitor the allocation of resources. Overall, the more institutional efficiency, the less vulnerability to economic volatility (Auty, 2009). Efficient institutions foster oil policies, which allow it to have a more stable economic growth rate. Less efficient institutions avoid the economies to resist economic volatility. In this case, its growth is driven by oil boom cycle. Therefore, economies with efficient institutions are less vulnerable to the resource curse.
The resource curse is a symptom of the Dutch disease (Khodeli, 2009). It involves the oil sector; the non-tradable sector, like construction; and other tradable sectors, like manufacturing (Humphreys, Sachs & Stiglitz, 2007). The disease starts when the oil boom catches the attention of government, which pursues the highest revenue from it. It moves skill labor, technology and investments toward the oil sector (Wohlmuth, 2007). Government spending is used to promote non-tradable sectors. The real currency appreciation affects exports of other tradable sectors. It leads to deindustrialization (Jerome, 2007). If the oil price drops, all the economy declines as well. It finds difficulty to be recovered through other tradable sectors, because they are weak. Overall, the resource curse is allowed by overestimation of income, insufficiency of savings, unproductive investment and high government consumption (Auty, 1993). Instead, the real value of resources depends on its access to capital markets, in order to turn these resources into wealth during the upswing of oil boom. It protects the oil revenue from price volatility.
Uncertainty in oil market leads countries to face problems to experience economic growth. Actors make decisions according to their ability to process the available information (Furubotn & Richter, 2005). There is uncertainty about the expectations in the decision making process of other individuals. The actors' decision making process is driven by their knowledge of other individuals' behavior (Boland, 1993). Though, institutions are able to shape individuals behavior in a particular direction (Furubotn & Richter, 2005). Institutions give a basis to expect a behavior in economic exchanges.
Formal institutions are written rules. It includes constitutions, laws, policies and property rights (Furubotn & Richter, 2005). Further, informal institutions emerge within the gaps of the formal one. Informal institutions survive in the daily interaction among individuals seeking their self-interest. Informal institutions are belief systems, motives, habits of thought and behavior and traditions. The match between formality and informality determines the institutional environment.
Institutions provide to actors the structural environment to face externalities efficiently. Efficiency is the condition "where the existing set of constraints will produce economic growth" (North, 1990, p. 92). The complexity of transactions depends on institutional efficiency. Overall, institutional efficiency reduces uncertainty, prevents volatility and leads to a pattern of stable economic growth through policy stability.
Methodology
Policymakers should take into account the historical performance of institutions (North, 1990). It offers policy learning. Further, cross-country comparison provides knowledge about institutional performance of a similar economy, in order to learn about It (Ebbinghaus, 2005). Institutional efficiency should be compared in countries with similar path dependency. It allows rulers to start reforms within common habits of though and behavior to seek assertive change. The research asks whether the alternatives followed by two similar economies through the oil policies made the difference between them. Colombia and Ecuador allow the comparison of different oil policies in economies with similar institutional settings. The late-1990s crisis in the Andean economies is an opportunity to test their institutional efficiency. Comparison of these case studies looks at three variables: institutional efficiency (independent variable), oil reserve policies (intervening variable) and stable economic growth (dependent variable) (cp. Table 1). They are compared through interview to experts, observation on field and documentary analysis.
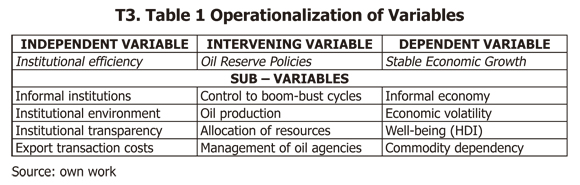
Institutional efficiency asks for the background of the economy to face further challenges. It analyses four sub-variables: First, informal institutions are beliefs, motives, habits of thought and behavior and historical traditions. Actors may become dependent of parallel informal rules led by interest groups. It could be permissive with rent-seekers and increase pressure on political actors to accept harsh practices (Humphreys et al, 2007). Second, institutional environment is a macroscopic level which covers the general framework over the economic and political transactions in society, such as the constitutions (Furubotn & Richter, 2005). It prevents the effects of political instability, such as corruption, disruption in democratic processes, tensions over the territory, environmental degradation and migration. Third, institutional transparency increases the access of population to information, in order to monitor processes (Wohlmuth, 2007). Fourth, institutional efficiency reduces the export transaction costs (North, 1990). It prevents the Dutch disease and commodity dependency (Auty, 1993). It controls the effects of downswing of economic cycles in well-being and informal labor, by giving incentives to entrepreneurs and workers.
Oil reserve policies come from the institutional setting. The adjustments in oil policies change the circumstances for economic growth. Oil policies have four subvariables: First, oil production asks for the management of oil reserves, exploration and production (Khodeli, 2009). Second, allocation of resources analyzes the share of spending (Humphreys et al, 2007). Third, the control to boom-bust cycle analyzes the use of oil funds (Karl, 2007). Fourth, the management of oil agencies analyzes the roles of regulator and operator (Radon & Thaler, 2009).
The stable economic growth is the outcome of institutions reducing uncertainty through oil policies (North, 1990). It has four sub-variables: First, the commodity dependency looks at the weight of oil exports in the national budget. It asks for the ability of public spending to give incentives to other sectors. Second, economic volatility asks for the historical performance of the per capita GDP growth rate and the impact of inflows and outflows of capital (Mork, 2000). Third, high economic volatility leads to low well-being. Fourth, informal economy highlights the issue to apply labor policies (ILO, 2002).
Main findings A. Ecuador
Institutional Efficiency
a. Informal Institutions
Ecuador has 16 millions of inhabitants (Inec, 2014). Urban population represents 65% (Eclac, 2014). Native communities are seven percent of population (Flacso, 2014). Oil has widespread a routine in the Amazons zone. Carlos Saltos, documentalist filmmaker and resident in the zone, points out oil exploitation in parks, which were stated as untouchable by the government like the Block 161. In compensation, indigenous receive alcohol drinks. It affects nomadic communities like Waorani, Taromenani and Tagaeri. Some of them have a lack of contact with urban society. Suddenly they could find a high-way built by oil companies within the jungle. It is strange for them, and they react by killing people. Informal institutions replace the policies.
b. Institutional environment
Ecuador has a presidential system with election every four years. The stability was disrupted in the late-1990s. First, the Asian financial crisis in 1997 led to massive outflow of short-term capital. Sucre currency was devaluated 200% in 1999 (ECB, 2014). Second, oil price declined 30% in 1998 (EIA, 2014). Oil revenue represented 24% of income in national budget in 1999 (ECB, 2014). Third 'El niño', the environmental phenomenon in 1998, led to floods, destroyed roads, houses and crops and spread infectious diseases.
The crisis coincided with corruption scandals of President Abdalá Bucaram, who was installed in August 1996. The majority of his ministers resigned accused of clientelism. Military advisers cut their support to Bucaram, and on 6th February 1997, the Congress declared Bucaram 'mentally ill'. Bucaram resigned and was exiled in Panamá. Fabián Aar-cón, president of Senate, led the transitional government in 1997-1998. However, Alarcón was involved in corruption scandals (González, 2007). Jamil Mahuad was elected president in 1998. This year was launched a constitution. However, his 'Recovery plan' led to the Sucre devaluation. Unemployment rate increased to 15 percent in 1999 (Eclac, 2014). The institutional crisis got worse after Mahuad announced the dollarization on 9th January 2000 to stop devaluation. Just 12 days later, on 21st January, a revolt of indigenous and
dissidents of the military took the Congress. They installed the National Salvation Junta, and Mahuad left the country. Vice-president Gustavo Noboa led the transitional government until 2003. He continued the Recovery Plan. Mahuad was accused of fraud. Lucio Gutiérrez, a former member of National Salvation Junta and military in Bucaram period, was elected president in 2003. Gutiérrez was accused of nepotism (González, 2007). On 24th April 2005, Gutiérrez left the country after a revolt of indigenous. He was replaced by the Vice-president Alfredo Palacio. Rafael Correa became president in 2007. Overall, weak formal institutions to achieve promises led population to claim by informal ways.
Unemployment led to emigration of workers toward Spain and US. The migration rate changed from -5.06 per thousand inhabitants in 1995-2000 to -6.31 in 2000-2005 (Eclac, 2014). Failures in political management of economy affected the trust on formal institutions. For instance, just 34.5% of population was satisfied with democracy in 2000. Finally, the constitution in 2008 changed the presidential period, and President Rafael Correa was reelected until 2017. Correa experienced a more stable political environment; except for a revolt from armed police in September, 2010. They asked for higher fringe benefits, and attacked the president. He received medical assistance in a hospital. Government controlled the riots by increasing wages to the army.
c. Institutional transparency
Ecuador ranked 24 out of 31 American countries in the Transparency International Corruption Perception Index in 2011 (CPI, 2014) (cp. Graph 1). The confidence in Congress decreased from 27% in 1996 to six percent in 2003-2007, and the trust in judicial power decreased from 31% to seven percent in 2003 (Eclac, 2014).
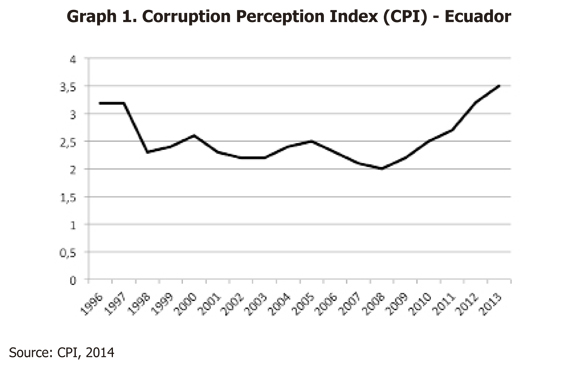
Ecuador signed up conventions against corruption with Organization of American States (1996) and UN (2005). Though, external oversight contributed only 15% reducing corruption in 2003-2007 (IDB, 2014). Overall, there was a gap between written agreements and habits of thought and behavior. CPI increased since 2008 after stability of Correa's government. It ranked 102 out of 177 countries in 2013 (CPI, 2014).
d. Export Transaction Cost
The country risk increased in 1999 from six to seven, the worst level. It remained in that position until 2014 (OECD, 2014). The Government launched policies to reduce export transaction cost. First, the dollarization in 1999 improved trade with US, its main partner (ECB, 2014). The economy grew five percent in 2001. However, exports to Andean Community of Nations decreased one percent in 2003 and 32 percent in 2008. Ecuador was in disadvantage, because it was unable to adjust the exchange rate. Colombia, the second trade partner, devaluated its currency 25 percent in 2002 (Banrepública, 2012). It made difficult to compete with neighbors. Second, users of the Export Processing Zones (EPZs) received since 1999 benefits like tax exoneration. Though, in 2000 exports from EPZs accounted 0.76 percent of total exports due to the lack of experience of producers (Conazofra, 2010). The quality of harbors infrastructure remained underdeveloped. Property rights decreased from 50 in 1996-2000 to 30 in 2001-2008, in a scale from zero to 100, with higher scores entailing greater security (IDB, 2014). Dollarization sought to reduce transaction cost in trade with US. Though, Ecuador had a lack of technology to compete. Ecuador lost control over monetary policy to compete in regional trade. Therefore, transaction cost was higher than its trade partners.
Oil Reserve Policies
a. Oil Production
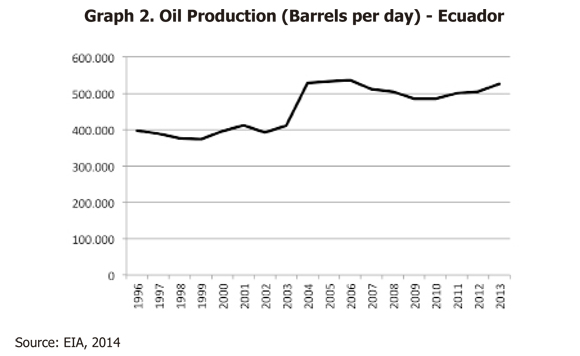
Petroecuador, the state-owned company represented 50% of oil national production between 1996 and 2005 (Petroecuador, 2010). Foreign companies represented 62% of oil production in 2006. Oil price declined from US$18.2 per barrel in 1996 to US$11.2 in 1998 (EIA, 2014). Ecuadorian oil exports represented 33% of total exports in 1999, and 49% in 2000 (ECB, 2014). Ecuador survived to the unstable economy through the discovery of oil in the Amazons in 2003. It increased in 119% oil proven reserves (EIA, 2014). Oil production rose 25% in 2004 and oil exports were 54% of total exports.
Correa joined Ecuador to OPEC in 2007. In 2008, OPEC reduced Ecuadorian production in 27.000 barrels per day (b/d) in October, and 40 thousands in December (cp. Graph 2). Ecuadorian oil exports decreased 25% in 2009. Though, the price rose from US$61.4 per barrel in 2007 to US$85.71 in 2008 (EIA, 2014). Ecuador offered to UN in 2010 to leave underground oil in ITT, the biggest Ecuadorian oil field with 850 millions of barrels, located in the natural park ofYasuní in the Amazons on 4.8 million of hectares (Yasuni-ITT, 2014). In compensation, Ecuador asked to the international community for 50% of revenue that it would receive by oil exports. It would represent annual income of US$350 millions for the next 12 years. However, the North did not answer. Correa resigned its proposal, and offered Yasuni to oil exploitation in 2013. Ecuador turned on its policy in 2011, and increased three percent its oil production. It took advantage of the high price of US$94,85 per barrel that year (EIA, 2014). Oil production rose to 526.000 b/d in 2013.
b. Management of Oil Agencies
The state is owner of 100% of Petroecuador, which signs up and monitor the contracts with oil companies. Petroecuador produces, refines, stores, transports and sales crude. Ecuador focused its oil policies in the late-1990s on giving benefits to foreign companies, in order to solve its need of capital after the Asian financial crisis (Esmap, 2005). Therefore, the government gave further incentives to exploration. It was ten oil rounds in 1985-2003. FDI increased from US$90 millions in 1990 to US$1063 million in 2002. It was a total of seven oil rounds in 1985-1996: The seventh round and eighth round gave seven and ten blocks in 1997, the ninth round was in 2002 over the coastal fields.
In 2003, it was celebrated the tenth round over Napo, Pastaza, Zamora Chipichipe and the field of Ishpingo, Tambococha and Tiputini (ITT) in the National Park of Yasuní. The rounds were managed by Petroecuador.
Oil policies changed in 2005. First, President Alfredo Palacio and his minister of Economy, Rafael Correa, cut the contract to the foreign company Occidental (US), because it did not report a transfer of 40% of its rights in exploitation to Alberta Energy Company in 2000. The use of the former Occidental's exploitation zone represented an additional production of 97 thousand of barrels per day and US$719.1 million for the state (Artola & Pazmiño, 2007). Second, government shifted the contracts with foreign companies in 2006 to agreements on provision of services. It increased from 20 to 50% the share to the state. Third, in 2007, President Correa replaced the Energy Department by the Secretary of Oil, under the Department of Development, centralizing the control of national budget and oil policies (Petroecuador, 2010). According to Guillame Fontaine, researcher at Flacso University, it gave further political power to Government2. Petrobras (BRA) and Noble Energy (US) did not accept the change in contracts policy, and Petrocuador took over the oil fields of these companies in 2011. The eleventh oil round allocated four blocks in the south-east Amazon in 2012.
c. Allocation of Resources
Oil income is the main source for central budget (ECB, 2014). The share of oil revenue in national budget was 28% of total income in 2000 and 2008. It was because of higher price and the lower production cost. Ecuador had average oil revenue of US$9.8 per barrel in 1998-2003 (Esmap, 2005).
The Ecuadorian Central Bank (ECB) receives the oil revenues from foreign companies. Petroecuador collects oil revenues from itself and foreign companies in sharing contracts. Until 2007, ECB and Petroecuador sent revenues to the National General Treasure, which allocated them among central government, participants and oil funds (Esmap, 2005). The allocation of oil revenue involved a set of actors, according to the type of contract, the category of exports, the difference in the oil price used as reference of budget, and the effective price on each ship. During the period 2002-2005 were allocated US$7223.2 million for oil exports (ECB, 2012). However, the central role of Petroecuador made more difficult to monitor the accounting process.
The average share of central government in oil rent distribution was 80.8% in 19982002. The national budget got 100% of oil revenue in 1999 (Esmap, 2005). In 20022006, oil income was US$11,410 million, with annual average rise of 37%. It is because of increasing in oil exports and oil price from US$16.6 per barrel to US$65.7. That period, oil revenue was 12% of GDP and 51% of exports (ECB, 2014). Though, Ecuador cannot influence the world price. It leads to uncertainty in budget projections. Oil income in national budget drops 2.4% per each dollar the oil price decreases (Artola & Pazmiño, 2007).
There were some failures planning the resources allocation. The designation of participants did not have a pattern. It depended on the perception of policymakers. The decentralized use of oil revenue was just 2.3% (Esmap, 2005). The Amazon region received 80% of the decentralized share. The Development Fund in the eastern regions received 11%.
President Alfredo Palacio and his minister, Rafael Correa, stated the Hydrocarbons Law reform in 2006. Changes in oil contracts gave a further income to the state of US$863 million the first year (ECB, 2014). A share of 34% went to central government, 14% to Petroecuador and 52% to participants (Artola & Pazmiño, 2007). A further reform was in 2007, when President Rafael Correa eliminated pre-allocations, through the Reformatory Law for the Tributary Equity (Ecuadorian Constituent Assembly, 2008a). Rather, 100% of oil income goes to central budget. There is not a system to monitor budget management and rent distribution (Fontaine, 2010).
d. Control to Boom-Bust Cycle
The Oil Stabilization Fund (FEP) was created in 1998. FEP received resources from the surplus in oil price. In 2000, the Trole I Law changed the concept of surplus in oil price to surplus in the national budget (Artola & Pazmiño, 2007). The Department of Economy managed the fund and supervised the Trole I Law. Only if there was effective surplus, it was able to allocate these resources. However, since 2003 the Department of Economy withdrew a main share. It took 95% of FEP income in 2005, and it was almost empty in 2006.
The Oil Stabilization, Social and Productive Investment and Reduction of Public Debt Fund (FEIREP) was created in 2002. It received resources, when oil price overcame US$20 per barrel. This fund was distributed between the national budget and the foreign debt service (Esmap, 2005). The share of FEIREP in the oil revenue increased from zero percent in 2002 to 12.3% in 2005. FEIREP registered US$921 millions in 2002-2005. In FEIREP, a share of US$538.7 millions went to public debt service, US$110 millions were sent to the stabilization of income, and US$40 millions went to social spending. The Hydrocarbons Law reform in 2006 replaced FEIREP by the Account of Productive and Social Supporting for the Scientific and Technological Development and Fiscal Stabilization (CEREPS) and FEP (ECB, 2014). Mauricio Olivera, researcher of Fedesarrollo, the Colombian think-tank, stated that royalty law reform should be complemented with external oversight, in order to control its allocation in provinces against rent-seekers3.
CEREPS started in July 2005. Its interests were directed to the general government budget. It would support technological projects (Artola & Pazmiño, 2007). CEREPS received incomes from oil produced by sharing contracts with crude lower than 23 API grades and the royalties. In 2005-2006, CEREPS was allocated among the Fund of Saving and Contingency (FAC), infrastructure, education and foreign debt service. FAC was created in order to ensure savings of 2,5% of GDP. However, the FAC fund represented one percent of GDP until 2007.
Correa eliminated the oil funds in 2008, through the Organic Law for the Recovery of the State Oil Resources (Ecuadorian Constituent Assembly, 2008b). Oil funds were managed without external control. They did not have annual limited spending, and it was used to finance government consumption. Oil funds did not control inflation, and they were used to pay foreign debt. Overall, there was a gap between the aim of the hinds and their real use.
Stable Economic Growth
a. Commodity Dependency
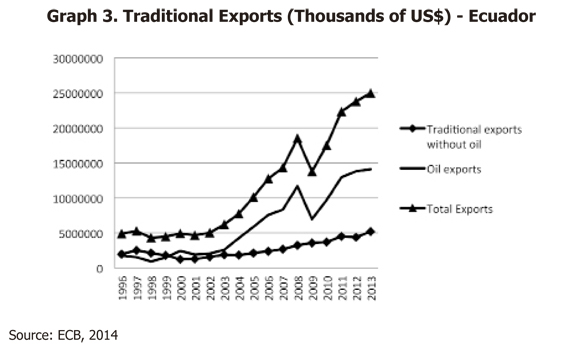
Bananas, shrimps, coffee, cacao and tuna represented 50% of exports in 1998 (ECB, 2014). Though, it changed after the dollarization of economy in 2000. They were 20% of total exports in 2005 and 17% in 2008. Exports to US represented 40% in 2002, and 53% in 2006. Colombia is the second destination. Exports to Colombia were 7.2% of total exports in 2002 and 5.6% in 2006, while imports from Colombia increased 42% in 2002-2006. Colombia has similar exports like coffee and flowers. Colombia devaluated its currency 25% in 2002, making expensive Ecuadorian products (Banrepública, 2012). Ecuador was unable to modify its exchange rate, because it does not control monetary policy after dollarization. Traditional exports without oil were 20% of total exports in 2013 (ECB, 2014) (cp. graph 3).
Oil represented 36% of exports in 1996. It declined during the crisis of 1998 to 21%. Oil was 63% of total exports in 2008, and 54% in 2013 (ECB, 2014). The share of oil increased to 58% in 2005, and 63% in 2008. Oil exports were 56% of exports in 2013 (cp. graph 3). Oil and mining represented 21% of GDP in 1996-2009 (Eclac, 2014). Oil caught 37% of FDI in 2013 (ECB, 2014). However, there is no link between oil and other sectors, because oil is an enclave.
Construction sector followed the crisis in 1999 and the recovery the first years after dollarization. Construction's GDP increased 15% in 2001. This year, imports in raw materials for construction increased 98%. Though, the reduction in exports in the further years affected public spending in infrastructure. Construction caught 13% of FDI in 2013 (ECB, 2014). Manufacturing delayed its recovery one year more than construction. Dollarization allowed manufacturers to get cheaper imports. However, manufacturing is not significant in Ecuador (Conazofra, 2010). Manufacturing sector accounted five percent of GDP in 1996-2009 (Eclac, 2014). Manufacturing got 16% of FDI in 2013 (ECB, 2014). Overall, the recovery of economy was supported in oil, which increased its weight in the economy. Though, dollarization affected exports, and producers lost regional competitiveness.
b. Economic Volatility
Ecuadorian economy in 1996-2009 was marked by the high volatility of its growth (cp. Graph 4). It was evidenced in indicators, like foreign trade deficit, high interest rate, high pressure in exchange rate and outflow of capitals (ECB, 2014).
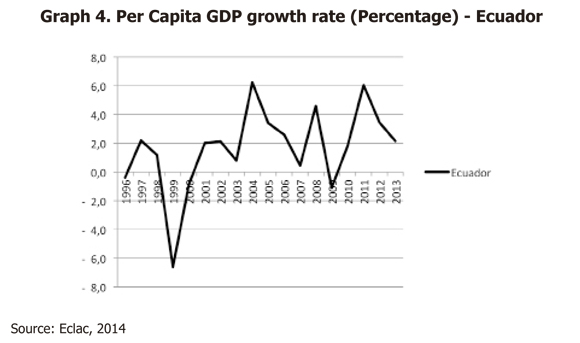
Dollarization was the answer of Mahuad to recover monetary and fiscal stability. This policy came after freezing private accounts and closing temporarily banks in 1999, in order to lock-out the outflow of short-term capital and the devaluation of Sucre. Do-llarization pursued the same advantages of a fixed exchange rate, taking into account that US is the main trade partner. It would reduce the transaction cost in bilateral trade without the friction of currency conversion, and would stimulate inflow of capital due to the predictable rate of return to investors in the long term. Dollarization was kept by the governments after Mahuad. Per capita GDP growth rate increased 184% in 2001. Though, Ecuador lost its ability to intervene monetary policy, and it hurt domestic actors. The exchange rate increased the relative cost of exports in the regional trade. Further, it reduced the real wages and increased the consumer basket price. Unemployment led to migration of workers. The main sources were oil income and remittances (ECB, 2014). Remittances were 6.53% of GDP in 1999, 8.29 in 2000, and seven percent in 2007 (IDB, 2014). Per capita GDP growth rate was 6% in 2011. It was pushed up by the highest oil price in 1996-2013 of 111.63 dollars per barrel that year (EIA, 2014). FDI as percentage of GDP was 0,4% in 2007 and 1,2% in 2011 (Eclac, 2014).
c. Well-Being
Ecuador uses to rank the lower places in the UN's Human Development Index in America. The average HDI for the medium term 1990-2007 was 0.47. Government spent in education eight percent of public spending in 2000-2007 (HDI, 2014). Overall, there is a lack of guarantees to get access to education in low income communities. Life expectancy is 75 years old. The spending on health was 7.3% of governmental spending in 2007. HDI described an upswing in Correa's administration from 0,68 in 2007 to 0,724 in 2013. The gap between rich and poor populations is bigger in rural communities.
d. Informal Economy
Informality is a main source of employment. Urban population in informal labor were 54% in 1997, and it rose until 59% in 1999, and drop to 57.4% in 2008 (Eclac, 2014). Microenter-prise employees represented 15% in 1996-2008. In 2007-2009, informal sector did not drop lower than 56%. Further, there is illegal trade of gas and oil around oil exploitation zones.
The Department of Labor has policies related to fair income, social security and social dialogue (Ecuadorian Department of Labor, 2014). Though, the main effect of the late-1990s crisis was higher unemployment. It led to revolts, massive migration and higher informal sector. The law stated a real minimum wage of US$163 in 1998 and US$48 in 2000. However, it started an increasing tendency in Correa's administration. Minimum wage was US$170 in 2007 and US$318 in 2013. The Labor Law of 2005 states the fringe benefits to workers like Christmas bonus calculated in 8.3% of salary, annual scholar bonus, a reserve fund estimated in 8,33% of salary, annual vacations, and 15% of the annual firm profits (Ecuadorian Labor Law, 2010).
Employees represented more than 50% of urban employed population in 1996-2009. Though it decreased in 2000, while self-employed rate increased 32% (Eclac, 2014). The employer rate was nine percent in 1999. It decreased to an average of six percent in 20002008. Services represented an average of 50% of occupied population in 1996-2009, agriculture 30% and industry 20%. Unemployment rate changed from 10.4% in 1996 to 15.1% in 1999 (cp. Graph 5). Labor productivity, measured as the growth rate of GDP per person employed, was -9.1% in 1999. It increased to 1.5% in 2006. Unemployment rate drop in 2003-2008 until 6.9%. It increased until 8,5% in 2008, and dropped again until 4,6% in 2013; the lowest unemployment rate in 1996-2013. Even though, informal labor was 54,1% in 2012 (Eclac, 2014) and 52,49% in 2013 (Inec, 2014).
Conclusion to Ecuadorian Case
High volatility in Ecuadorian economic growth rate followed inefficient institutions. Institutions in this economy were threatened through the outflow of capital in 1997, the floods in crops and the dropping 35% in oil price in 1998, when the oil share in national budget income was 24%. In 1999, traditional exports without oil declined 17% and devaluation was 200% (ECB, 2014). Unemployment increased to 15% and foreign debt 195% (Eclac, 2014). The late-1990s crisis tested the institutional environment. Though, the rent-seeking behavior of Bucaram, Mahuad and Gutiérrez and the weak categories of punishment, such as presidential amnesty, gave incentives for corruption and eroded the trust in formal institutions (CPI, 2014). Citizens moved to informal economy or left the country, raising remittances 24% in 2003 (ECB, 2014).
Dollarization stopped devaluation in 2000 (ECB, 2014). However, exports lost competitiveness, when regional partners devaluated their currencies (Banrepública, 2012). In 2003, oil reserves increased 119% and its production rose to 530,000 barrels per day (EIA, 2014). Per capita GDP growth rate was 6.8% in 2004. That year, manufacturing sector decreased 10% and bananas production decreased five percent (Eclac, 2014). The economy was driven by the upswing of oil price (EIA, 2014).
Correa's administration provided more stability in the Government. Even though, he uses to change oil policies in the short run, and it increased uncertainty in the relation with the oil companies and allocation of resources. Oil production declined with the return to OPEC in 2007 (EIA, 2014). Correa increased the share of the state in oil contracts to 50% and raised revenue. He centralized the oil policymaking in the Department of Development. Petroecuador collected royalties from itself (Petroecuador, 2010). It reduced institutional transparency. Oil was 28% of national income in 2008 (ECB, 2014). Allocation of resources focused on government consumption (IDB, 2014), rather than regional development.
HDI was among the lowest in America in 1996-2005. However, it increased its performance the next years (HDI, 2014). Informal labor was 57% in 2008 and 52% in 2013 (Eclac, 2014). The fail of the anti-extractive policy of Yasuni-initiative turned over oil policies again in 2010-2012. Correa increased oil production in 2010-2013 and launched a new oil round in 2012. On the one hand, the high oil price drove forward the economy in Correa's administration. On the other hand, the world oil price led to volatility in Ecuadorian economy.
Economic growth depended on oil market and remittances. The high oil price could not protect the economic growth rate against institutional failures, like mismanagement of national budget, the lack of export incentives, informal economy and the low capital saved in the oil funds (Esmap, 2005). Overall, institutional environment was unable to lead oil revenue to development projects, in order to recover the economy. Even though, President Correa gave more stability in 2007-2013 than former administrations in 1996-2006.
Colombia
Institutional Efficiency
a. Informal Institutions
Colombia has 47 millions of inhabitants. The urban population represents 78% (Eclac, 2014). The coffee culture grew along the rural communities during the coffee boom in 1970s. However, the coffee crises in 1989 allowed illegal groups to recruit informal labor to take illegal crops, such as coca-pasta. Political and economic informality reduced the presence of the state to 70% of territory in 1990s (GAO, 2008). The lack of ability to fulfill the law led to parallel informal rules (IDB, 2014).
The oil extraction is focused on the north and east zones. They represent 11% of national population (Dane, 2014). These regions depend on oil rent. According to the Inter-American Development Bank (IDB), in the period analyzed, Colombia experienced differentiated stability in democratic institutions and political and social integration, which allow political transformation (IDB, 2014). In 2005, 58% of population believed their children will live in better conditions than them (Eclac, 2014).
b. Institutional Environment
Colombian policies are regulated by the constitution of 1991. It deals with the political threaten from drug dealers and illegal army groups. Further, it stated the guidelines for the open-market policies. Colombian presidents have fulfilled the constitutional period since 1958. The political stability has been threatened by tensions over territory, particularly in zones of illegal crops. Left-wing rebels have integrated army groups against the Colombian state for 40 years. The main groups are the Revolutionary Armed Forces of Colombia (FARC) and the National Liberation Army (ELN). The both use kidnapping, in order to extorts civilians, and to negotiate with the state.
Government focused on military pressure by two sources. On the one hand, the military agreement included in Plan Colombia launched with US in 2000. On the other, the military strategy of President Alvaro Uribe, elected in 2002. The opium poppy cultivation and heroin production declined 50% from 2000 to 2006 (GAO, 2008). It contrasts with the rate seven years before Plan Colombia, when coca cultivation increased 300% and opium poppy cultivation 75%. Colombian Government controlled 70% of national territory in 2003. It increased to 90% in 2007. FARC membership declined from 17 thousand in 2001 to 8000 in 2008. Outcomes against FARC allowed re-election of Alvaro Uribe until 2010. Juan Manuel Santos, former minister of Defense of Uribe, became president in 2010-2014. However, Santos changed the military policy, and opened a peace negotiation with FARC.
Some enterprises have sponsored the United Self Defense Forces of Colombia (AUC), an illegal military group, in order to prevent kidnapping from guerrillas since the 1980s. Further, AUC leaders got into the drugs business. Uribe signed up demobilizing agreements with AUC. Thirty thousand of AUC members were disarmed in 2007 (Monty & Keith, 2009). AUC and guerrillas are denounced because of Human Rights abuses against rural population. The ratio of annual net migration to the average of population was a rate of -0.79 per 1000 inhabitants in 1995-2000. It changed to -0.54 in 2005-2010 (Eclac, 2014).
Colombia ranked like the American least political stable country in 1990s (Brown, 2002). However, institutional environment was strengthened in 2000-2009. Population satisfied with democracy rose from 54% in 2000 to 80% in 2005. Progress against corruption in state institutions increased from 45% in 2005 to 59% in 2008 (IDB, 2014).
c. Institutional Transparency
Transparency International Corruption Perception Index (CPI) was affected in the economic dislocation in 1996-1998 (cp. Graph 6) (CPI, 2014). This period, President Samper was investigated about financing support from drug cartels in his electoral campaign. However, he fulfilled his four years of government. CPI was improved gradually until 2001, and it remained stable during Uribe's period. Forty-nine percent of population believed in a better control of corruption in 2004. It increased to 57% in 2006 (IDB, 2014). CPI had a slow-down in 2007. This year, 68 Congressmen were investigated due to links to AUC (Semana, 2007). Colombia ranked 12 out of 31 American countries in CPI in 2009.
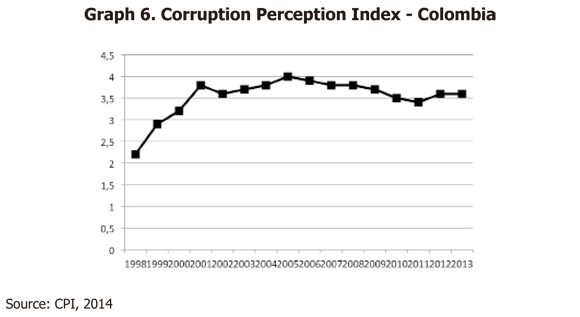
Government stated a standard methodology of allocation of resources, which mandates a report about the royalties sent to regions (Esmap, 2005). The external oversight institutions contributed in 40-57% to fight against corruption in 2003-2007 (IDB, 2014). It remains over 3,5 points until 2010. It coincides with the reduction of guerrillas and AUC memberships. Though, there are investigations for the relationship between politicians and illegal groups. Further, in June 2011, the former agriculture minister, Andres Arias, was in jail because of corruption scandals around the allocation of agricultural subsidies. It declined the CPI to 3,4 in 2011. Colombia dropped to 18th place out of 32 countries in America in 2013. Overall, CPI uses to register over 3,5 points in 2001-2013.
d. Export Transaction Cost
Uribe began his second period in 2006 with a better macroeconomic environment than in 2002, when he became president for the first time (IDB, 2014). The Colombian classification in the OECD Country Risk increased to six in 2002, in a scale from zero (low risk) to seven (high). Then, it went down to four in 2006-2013 (OECD, 2014). According to the Inter-American Development Bank (IDB), Colombia experienced an economic transformation because of the advances in civil pacification and an extensive market size. The Government decreased the procedures to start a business from 18 in 2002 to 11 in 2008 (IDB, 2014). Time for import decreased from 48 days in 2005 to 20 in 2008. Colombia has three types of Export Processing Zones (EPZ): goods and services, tourism and technological services (Presidency of Colombia, 2014). Users receive a reduction in 35 percent within the pay of rent taxes, according to the Plan Vallejo Law. Particularly, importers of inputs for national industry, such as machinery and raw materials should not pay import rights. Further, users receive specialized loans from the Colombian Exim-bank, Bancoldex. The business freedom and property rights improved from 1996 to 2008 (IDB, 2014). Colombia has offered gradually a better friendly environment to exporting firms. It has reduced the transaction cost for entrepreneurs. However, upgrading competitiveness has been slow, and technology and infrastructure remain low to face complex transactions.
Oil Reserve Policies
a. Oil Production
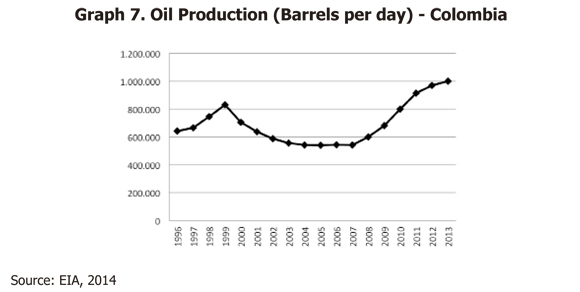
The oil proven reserves in Colombia decreased from 3500 billion of barrels in 1996 to 1355 billion of barrel in 2009 (EIA, 2014). The oil exploration is 90% from foreign companies. President Pastrana created the Oil Exploitation Fund in 2001 by the Law 49, in order to increase oil reserves (Ecopetrol, 2014).
Oil production increased 11% in 1999, when it registered 830,194 barrels per day (cp. Graph 7). However, it decreased to 539,819 in 2005, when there was a reduction of reserves (Pulido, Montes & Beltrán, 2004). Then, oil production increased to 680,479 barrels per day in 2009 (EIA, 2014). Oil exports increased 16% in 2007. It was helped by higher oil prices, which continued until the peak of US$126.14 per barrel on the 4 July 2008. Colombia continued its policy of rising oil production until one millions of barrels per day in 2013.
b. Management of Oil Agencies
Oil policies in Colombia search technologies for exploration and higher production by promoting FDI. It declined in 1998. Many companies left exploration activities in 2000, because of insecurity and the lower rate of oil discovery (Brown, 2002). President Pastrana modified the oil policies. He opened a new oil round in 2000 (Esmap, 2005). Further, the share of foreign companies in contracts increased from 50% to 70% in 2002.
The main shift in oil policies was led by President Uribe with the Law 1760 in 2003. It derogated the Law 2310 of 1974, and allowed all types of contracts. The policy modified the structure and role of Ecopetrol as producer and manager of oil resources. Ecopetrol would focuses only on exploitation. The reform created two new entities: first, the Hydrocarbons National Agency (HNA) collects royalties and negotiates contracts. It sought to increase the expertise of negotiators. Second, the Colombian Energy Promotion Society (CEPS) controls investments (Esmap, 2005). HNA launched an oil round in 2007 with seven fields in the east region. The oil round in 2008 offered 93 blocks. The round of 2010 allocated 76 blocks, and the round of 2012 gave 50 blocks (Ecopetrol, 2014). Changes in Ecopetrol and creation of HNA promoted confidence and FDI. Benefits depend on discover more reserves that extend the interest to invest in Colombian oil.
c. Allocation of Resources
Oil income is a main source in Colombia. Royalties collected by the Hydrocarbons National Agency (HNA) from oil companies represented US$12 thousand millions in 19942006 (HNA, 2014a). The average share of oil revenue sent to central government in 1998-2002 was 36% of total oil income (Esmap, 2005). Oil represented 1.6% of total income in national budget in 1999, and 5.6% in 2008 (Colombian Department of Economy, 2010a). Colombia has a decentralized model for allocation of oil revenue stated by the laws 11 and 12 in 1986. Political Constitution in 1991 stated a Royalties National Fund in order to compensate regions, because of resource exploitation in their territories. Oil revenue has two main sources: rent taxes, which go to the central government, and royalties that are distributed among the regions. Royalties were distributed on the basis of the oil barrels produced per day by each region. Producer regions received an average of 75% of royalties in 2004-2009, the Royalties National Fund 12% and other participants 13% (HNA, 2014b). Santos launched a reform in 2012. It diminished share to oil producer regions, and widespread royalties among the other ones, according to percentage of population and poverty: territorial pensions 10%, Science and Technology Fund 10%, Savings and Stabilization Fund 30%, direct assignation 12,5%, Territorial Compensation Fund to population without satisfaction of basic needs 27,5% and Territorial Development Fund 10% (Minminas, 2014).
d. Control to Boom-Bust Cycle
Colombia created permanent funds to stabilize the economy. The Royalty National Fund should invest in regional projects among territories without direct relation to oil extraction (Colombian Congress, 2002). The Law 209 created the Oil Stabilization and Savings Fund in 1995. It is stated in US dollars and managed by Banrepública, the central bank (Colombian Congress, 1995). However, President Pastrana announced in 2001 the transfer of US$210 millions from the Oil Stabilization Fund to regions and districts, in order to pay their debts (Ecopetrol, 2001). President Uribe increased the restrictions to make transfers from the Oil Stabilization and Savings Fund in 2004. In 2009, the annual capital sent to the state was reduced in 67%, in order to protect the fund (Colombian Department of Economy, 2010b). The Fuel Price Stabilization Fund was created by the government of Uribe such as a mechanism to stabilize the internal price of fuel and to reduce volatility (Zuluaga, 2008). President Santos ratified Banrepública as manager of Savings and Stabilization Fund by the royalty reform of 2012 (Minminas, 2014).
Stable Economic Growth
a. Commodity Dependency
The growth rate in GDP increases since 2001 until its highest record in 2007. Even though, foreign trade was affected by cut in exports to Venezuela, the second trade partner, after a political disagreement about the place of US military bases in Colombia in 2008-2009 (Dane, 2014). Coffee, coal and nickel were 20% of exports in 1999 and 23% in 2009 (cp. Graph 8). Traditional exports represented 52.62% of total exports in 1999, and 55% in 2009.
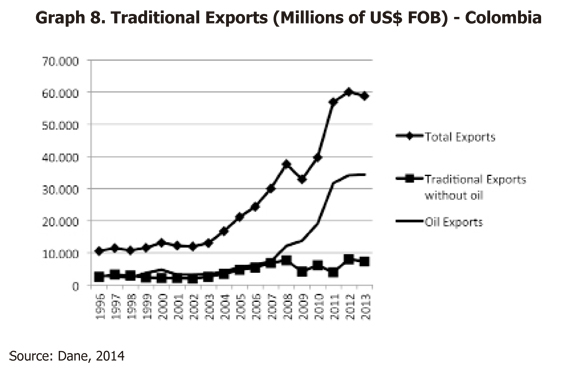
The oil reserve in Cusiana was discovered in 1991 (Pulido et al, 2004). It led to higher oil exports, which represented 27.68% of total exports in 1996 (cp. Graph 8) (Dane, 2014). In 2000, the oil income transferred from Ecopetrol to national budget represented three percent of GDP (Pulido et al, 2014). However, oil exports income decreased 14% in 2002, after the reduction in oil reserves. Oil represented 27% of total exports in 2002-2007. The higher oil price recovered the income since 2003 (EIA, 2014). Colombia increased its dependency on oil exports during Santos' administration. Oil represented 48% of total exports in 2010 and 58% in 2013 (Dane, 2014).
Manufacturing sector increased in 2000. In 2007, the GDP share was services 47%, manufacturing 15%, oil five percent and agriculture eight percent (Eclac, 2014). GDP of construction increased 14.7% in 2003. The share in 2012 was services 34%, manufacturing 11%, mines and oil 7%, agriculture 6%, commerce 11% and construction 6% (Dane, 2014).
b. Economic Volatility
Colombia faced "international financial crisis in 1998 and the dropping in private savings" (Banrepública, 2000), (cp. Graph 9). Colombia found a source of capital by involving US in a financial support against illicit crops. The agreement, called Plan Colombia, was approved in 2000 (GAO, 2008). Colombia received US$6 billion between 2000 and 2008. It included US$1.3 billion for non-military assistance, focused on economic and social progress, and the rule of law. The Farc's profits per kilogram of cocaine decreased from a range of US$320-US$460 in 2003 to US$195- US$320 in 2005. The US Agency for International Development (USAID), the Department of Justice, and State monitored the non-military assistance. It was represented in economic alternatives to the drug business, aid to internal migrants, demobilization of 30 thousand former combatants, and judicial reforms. USAID implemented two additional development programs: Areas for Municipal Level Alternative Development (ADAM) and More Investment for Sustainable Alternative Development (MIDAS). ADAM focused on the development of crops with long-term potential, such as specialty coffee. MIDAS supported infrastructure projects and encouraged private-sector to led business initiatives, in order to reduce unemployment and income growth, by microfinance fees to small and medium sized business. However, rural population still received less income from legal jobs than their earnings in narcotic trade.
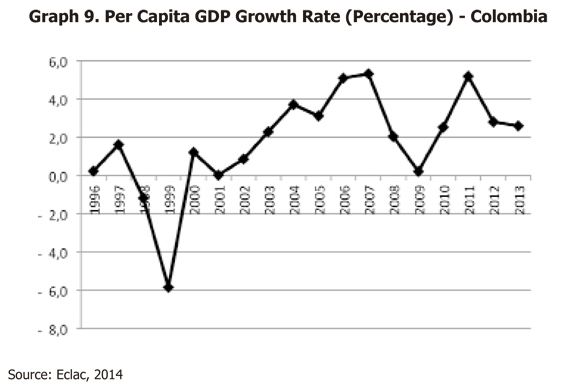
FDI as a percentage of GDP increased from 2.85% in 2000 to 8.33% in 2005. It declined until 5.35% in 2009 (IDB, 2014) and 2,6% in 2011 (Eclac, 2014). Remittances were 0.78% of GDP in 1996 and 3.86% in 2003 (HDI, 2014). External public debt as percentage of GDP was 13% in 1996. It increased gradually to 27% in 2002, and decreased to 13% in 2008 (IDB, 2014). Per capita GDP growth rate was 5,2% in 2011 (cp. Graph 9). It matches with the high oil price. Even though, per capita GDP decreased during Santos' administration in 2012-2013 (Eclac, 2014).
c. Well-Being
Well-being tested by the UN's Human Development Index Report (HDI) (2014) rose in Colombia in 1996-2006. Colombia has high human development. HDI and its components are expressed as values between 0 and 1. The average in medium term of Colombian HDI 1990-2007 was 0.71. Public expenditure on education as a percentage of total public expenditure was 14.2% in 2000-2007. Public spending in education as a percentage of GDP was between 4.2% and 5.2% in 1999-2007 (Eclac, 2014). Life expectancy is 75 years old (HDI, 2014). Government expenditure on health as a percentage of total government expenditure was 17% in 2007. HDI was 0,71 in 2010-2013.
d. Informal Economy
The Government took advantage of higher FDI to decreased unemployment rate. Plan Colombia helped to achieve partially this goal. The legal weekly working hours are 47, and the real minimum wage was US$278 in 2009. This year, it increased 7.6%, and 257.2% in relation to 1996 (Minprotección, 2010a). Though, informal economy is a current issue.
The late-1990s crisis affected unemployment rate. It increased from 11.2% in 1996 to 19.4% in 1999. Labor productivity, measured like the growth rate of GDP per person employed, was -10% in 1999. It increased to 5.2 in 2006 (Eclac, 2014). Unemployment rate decreased between 2002 and 2008 (cp. Graph 10). It was 11,5% in 2008. However, it was affected in 2009-2010 by the cut of exports to Venezuela, because of a political disagreement of Venezuelan government in relation to the close relationship between Colombia and US.
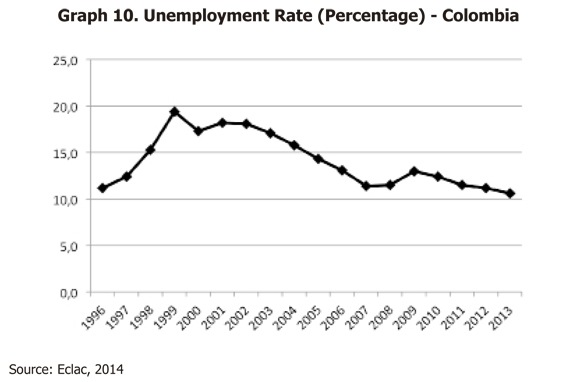
Twenty percent of firms were in informal sector in 2002-2006 (IDB, 2014). Informal labor in 2007 was 54% (Minprotección, 2008). The main share of employed population is employees, and the second one is self-employed. Self-employed without high education were 30% of occupied population in 1996-2009 (Eclac, 2014). The Law 100 in 1993 and the Law 1122 in 2007 ruled the fringe benefits of employees, through the employers and the General System of Social and Health Insurance (GSSHI). The fringe benefits are the payment for services premium every six months, labor costume and unemployment insurance (Minprotección, 2010b). In 2006, 17.98% of workers did not have legal protection of GSSHI. It dropped to 15.43% in 2007 (Minprotección, 2008). Unemployment rate declined in Santos' period until 10,6% in 2013 (Eclac, 2014). It was the lowest unemployment rate in 1996-2013. Population occupied in service was 27,2%, in agriculture, 26,7% in commerce, 17,1% in manufacturing sector and 1,1% in oil and mines sector in 2012. Informal labor was 58,6% in 2008 and 58,9% in 2012. Overall, unemployment decreased since 1999. However, oil is a low source of labor and informality is a main source of income.
Conclusion to Colombian Case
Incremental change in institutions allowed Colombia to experience a stable economic growth rate. Colombia had a weak institutional environment in the 1990s (Brown, 2002). President Samper in 1996 was accused oflinks to drug cartels. Further, rural families found in illicit crops a more profitable income than traditional exporting products (GAO, 2008).
The drug war was the opportunity to face financial crisis in 1997, by the aid from US with Plan Colombia in 2000. It sought to recover the economy from illicit activities, through US$1.3 billion (GAO, 2008). That year, GDP of manufacturing sector increased 9.7%, and traditional exports without oil rose 17% (Dane, 2014). Pastrana increased FDI, though he reduced the share of the state in oil contracts from 50% to 30% in 2002 (Esmap, 2005). Uribe continued Plan Colombia, increased the presence of the state from 70% to 90% of territory, and reduced illegal army groups. It improved the trust on institutions (CPI, 2014).
The Hydrocarbons National Agency (HNA) replaced Ecopetrol in contracts negotiation and collection of royalties in 2003. Ecopetrol focused on exploitation. It increased the expertise of agencies. Further, the Royalties National Fund allocated the oil revenue among regions (HNA, 2014b). It increased accounting transparency. Production decreased 27% in 1998-2004 (EIA, 2014), due to reduction in oil reserves. However, the high price increased oil exports income 16% 2007.
Coffee exports increased eight percent in 2004 (Dane, 2014). HDI increased from 0.757 in 1995 to 0.807 in 2007. It dropped to 0.71 in 2010-2013 (HDI, 2014). Unemployment rate decreased from 19% in 1999 to 11% in 2008 (Eclac, 2014). Though, 18% of workers were insufficiently covered by social benefits in 2006 (Minprotección, 2008). Further, informal labor represented 58.9% in 2012 (Eclac, 2014). Going deeply, oil represented 56.8% of exports in 2012. Even though, oil and mines sector provided just 1.1% of total labor the same year.
Plan Colombia started an institutional transformation. It allowed a more stable economic growth rate after the late-1990s crisis. HNA offered more transparency in oil sector. Colombia still faces further issues like informal labor and poverty rate. Though, the experience in the medium term (2000-2008) provided policy learning to continue an institutional innovation. In contrast, oil policies in 2008-2013 focused on higher oil production and FDI. It increased oil dependency. Further, royalty law provides a weak link of oil to other economic sectors, and there is a low impact on Human Development Index.
Crucial differences in Colombia and Ecuador
Colombia and Ecuador followed different paths to face the late-1990s crisis. It coincided with the institutional transformation in Colombia. In contrast, Ecuador experienced institutional instability. The difference in institutional efficiency led them to different levels of economic volatility through their oil policies in 1996-2008. However, economic up and down swings were led by oil exports in 2008-2013 in the both economies. Oil policies were adjusted during administrations of Rafael Correa in Ecuador and Juan Santos in Colombia. They followed the same path driven by oil boom. Santos and Correa increased economic dependency on oil sector. It made vulnerable the economy to face volatility of oil market (cp. Graph 11).

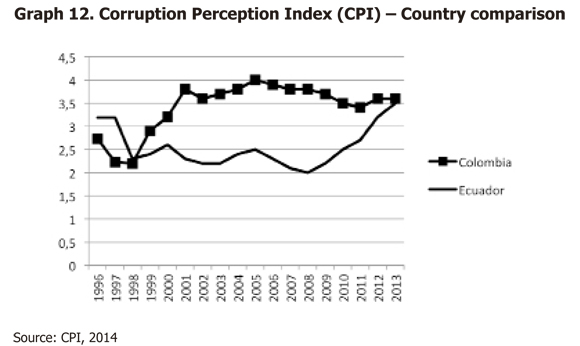
CPI moved to opposite directions in Ecuador and Colombia in 1996-2008 (CPI, 2014) (cp. Graph 12). Ecuador experienced three constitutions in 1996-2009 and three presidents overthrown. It affected policy consistency. The rent-seeking behavior of Bucaram, Mahuad and Gutiérrez (1996-2005) over-extracted the resources at expenses of wealth creation (González, 2007), when central budget received 100% of oil revenue (Esmap, 2005). It affected trust in formal institutions. Further, Ecuadorian government lost presence in the Amazons. Companies negotiate oil exploitation with native groups in forbidden zones4. In contrast, Colombia increased confidence on institutions, through higher control of violent groups. Government increased the presence on national territory from 70 to 90 percent in 2000-2007 (GAO, 2008). The CPI turned on the opposite direction for the both economies in 2008 (CPI, 2014). On the one hand, stability of Correa's government recovered the confidence of citizens. On the other, Uribe's cabinet was investigated about misallocation of agricultural subsides, and the unclear link between right-wing politicians and illegal army groups. Even though, the perception of corruption remains higher among Ecuadorian citizens than in Colombia.
The difference in political stability offered different backgrounds to support the ways to solve the deficit of capital. Colombia received financial aids from US through Plan Colombia, which included a share to promote national production (GAO, 2008). It reduced economic dependency on illegal crops, and started a new pattern of development in the long horizon. Colombia increased incentives to exporters by reducing the process to exports in 2000. However, political conflict with Venezuela, its main trade partner, declined traditional Colombian exports in 2008-2009. The economic growth was supported on oil in 2010-2013 by policies of President Santos. In contrast, Ecuador dollarized the economy in order stop the devaluation of Sucre (González, 2007). However, it was a short-term policy horizon within political instability. Export transaction cost increased. Ecuador lost competitiveness in regional trade, because it could not adjust the exchange rate (ECB, 2014). It reduced incentives for diversification of production. Therefore, the economy experienced higher volatility.
Oil sector in Colombia and Ecuador experienced different circumstances. Colombian oil reserves and oil production decreased in 1996-2009 (EIA, 2014). Though, higher oil price led to higher revenue. Ecuador kept the levels of oil production until 2003, when its oil reserves increased 119%. Oil policies changed in 2007, when Ecuador returned to OPEC and reduced production (ECB, 2014). Ecuador failed its initiative to leave oil reserves underground in Yasuni park. Therefore, Correa ratified exploration through a new oil round. Oil policies in the both economies became similar in the both economies in 2010-2013, when they based their economic growth on oil exports.
Oil is the first exporting product in Colombia and Ecuador (Eclac, 2014). However, Guillaume Fontaine, researcher on oil sector, ratified that Ecuador has higher oil de-pendency5. In 2005, oil exports represented 40% of Ecuadorian exports (ECB, 2014). That year, oil exports accounted 26% in Colombia (Dane, 2014). Oil revenue was 28% of central budget income in Ecuador in 2008 (ECB, 2014). This year, oil revenue represented 5.58 percent in central budget income in Colombia (Colombian Department of Economy, 2010a). Oil increased its significance in the both economies. Oil was 56,5% of exports in Ecuador (ECB, 2014) and 58,9% of exports in Colombia in 2013 (Dane, 2014).
The oil sector structure was reformed in the both countries, but in different directions. In Colombia, the HNA replaced Ecopetrol in negotiation of oil contracts in 2003. CEPS assumed the investments in oil activity. Ecopetrol focused only on exploitation. It increased institutional transparency. The state decreased its share in oil contracts from 50 to 30 percent. It sought to increase FDI (Ecopetrol, 2014). On the other side, Ecuador centralized management of agencies, replacing the Department of Energy by a Sub-secretary of oil under the Department of Development in 2006 (Petroecuador, 2010). Petroecuador kept the dual role of oil exploitation and collection of royalties. Ecuador does not distinguish rent from oil exports. It affects budget projection and accounting transparency, and increases the risk of rent-seekers. Ecuador increased oil revenue in contracts from 20 to 50 percent in 2005 (ECB, 2014).
Colombia decentralized allocation of resources among the regions. The reform to royalty' law widespread oil income to regions, according to poverty and percentage of population (HNA, 2014a). In Ecuador, rent distribution depends on government perception, rather than a standard policy. Ecuadorian central government receives 100% of oil revenue, and there are not defined participants (Artola & Pazmiño, 2007).
The oil funds followed different aims. Colombia increased restrictions to use the oil funds, in order to control spending (Colombian Department of Economy, 2010b). It led capital to regional projects. Ecuador had more oil funds, though they had a lack of savings. The oil funds did not respond to the Ecuadorian crisis. They were used for pay debt. Ecuador had higher volatility in foreign debt. It increased 196% in 1999 to solve the lack of capital (González, 2007). Colombia kept lower debt, through the inflow of Plan Colombia in 2000 and FDI (Banrepública, 2012).
Ecuador performed the lower positions of HDI in America (HDI, 2014). The HDI average medium term 1990-2007 was 0.71 in Colombia, and 0.47 in Ecuador. Even though, Colombia stopped its HDI growth in 2010-2013. Ecuador climbed to 0,724 in 2013. Ecuador had lower access to social services. Public spending in health as a percentage of GDP increased from 0.6 in 2000 to 1.2 in 2006. In Colombia, it increased from 1.87 to 3.38 the same period (Eclac, 2014). Public spending on education as a percentage of GDP in 2000 was 1.0 in Ecuador, and 3.7 in Colombia.
Informal labor is a main issue in the both economies (Eclac, 2014). There is a gap between policies and the ability to fulfill labor benefits. Unemployment led to emigration. Migration rate in Ecuador was -6.31 per one thousand inhabitants in 1995-2000. In Colombia, it was -0.58. It increased remittances. In 2000, remittances were 8.3 percent of GDP in Ecuador. The higher share of remittances in Colombia was in 2003, when it represented 3.9 percent of GDP (IDB, 2014). Informal labor was 58,9% in Colombia and 54,1% in Ecuador in 2012.
Conclusion
Higher institutional efficiency gave Colombia more resistance to economic volatility than Ecuador in 1996-2013 (IDB, 2014). Colombia is not safe of the effects of the resource curse. It performs high informal labor (Eclac, 2014) and oil exports dependency (Dane, 2014). Particularly, Colombian economy focused its economic growth on oil boom in 2008-2013. However, it was able to manage the causes of volatility better than Ecuador. Colombian economic growth was more stable in 2001-2007 (Eclac, 2014). The late-1990s crisis came during institutional transformation in Colombia (Monty & Keith, 2009). It fostered oil policies which decentralized the allocation of oil revenue among the regions (Esmap, 2005), promoted other economic sectors (HNA, 2014b), and decreased oil production (EIA, 2014). In contrast, Ecuadorian institutional environment was eroded by political failures. Ecuador fostered oil policies which increased its oil dependency, and allowed the negative effect of dollarization in manufacturing (ECB, 2014). Ecuador had a centralized allocation of resources (Esmap, 2005), and the recovery of its economy was conditioned by the oil cycle. Correa's administration provided more stability to economy than former governments. However, Correa focused Ecuadorian economy on oil sector. Broadly speaking, historical analysis warns about fragility of those economies in 2010-2013 to face oil volatility.
Colombia experienced less volatility in economic growth than Ecuador. Though, it is not enough. Oil reserves have decreased gradually, therefore Colombia has to prepare its institutions to face a higher downswing in oil production in the medium-term (EIA, 2014). Success of its policy of low share in oil contracts depends on discovery of new fields, in order to increase its oil production volume. In addition, lower oil reserves forces Colombia to look for other sources of income (Dane, 2014). Colombia should complement oil production with taxes. It prevents oil dependency in public spending. Further, control organisms should monitor the use of oil rent in provinces.
Colombia evidenced a progress for the middle term, between 1996 and 2009. Though, it should reinforce the incremental change in institutions to extend the partial achievements against the resource curse phenomena. Colombia should take advantage of its policy learning about turning illicit crops to formal units. Similar policies should be extended over other informal economic activities. It reduces poverty and increases HDI in 1996-2009. It is a permanent issue. The initial transformation of political stability and economic confidence gives government tools to promote access of population to social services. Oil funds oriented to productive investments, and incentives to manufacturing sector are ways to formalize labor. Therefore, Colombia should launched policies to link oil revenue to other economic sectors. Royalty allocation is not enough to lead oil income toward social development. There are not strong institutions to control rent-seekers in the provinces.
Colombia and Ecuador need further oil policies to ensure a more stable economic growth, by facing the resource curse. Oil income should reduce export transaction cost, through investments in R&D in manufacturing sector. It should improve infrastructure. It gives incentives to local producers, and increases the share of other tradable sectors in GDP and national budget income. Particularly, Ecuador should start a plan to reduce budget dependency on oil revenue to finance government expenditures. The diversification of national production formalizes labor, by giving more stable income opportunities. By doing so, oil revenues increase institutional efficiency.
Ecuador may get policy learning from institutional change in Colombia in 1996-2008, taking into account their similar institutional pattern in the long term (Eclac, 2014). First, Ecuador should open an oil stabilization fund. It could turn resources into wealth, saving the oil funds abroad in a foreign currency. It prevents inflation in oil booms, which affects manufacturing sector. The use of this capital should have restrictions, in order to protect them from rent-seekers and unproductive spending.
Second, Ecuador should increase institutional transparency. It should decentralize the management in the allocation of resources from oil revenue. It should increase the share to regional development. Ecuador should decentralize the power over oil policies and national budget spending focused on the Department of Development. It evolves a conflict of interests, when it allocates revenue and finances government consumption.
Third, Petroecuador needs to be reformed. It should not collect royalties from itself. Instead, an independent agency should collect them. Petroecuador should differentiate its accounting from the income received from foreign companies. It affects the estimation of revenues and budget projections. The solely report from one company for a wide number of functions decreased institutional transparency. In contrast, the division of responsibilities among specialized agencies make easier to evaluate their efficiency.
Fourth, the Ecuadorian state should increase its presence in oil exploitation zones. It should provide guarantees to indigenous. It should avoid oil extraction in natural parks stated untouchable like the Amazons. It will strengthen the institutional environment.
The success of oil policy reforms depends on government's ability to harmonize formal and informal institutions. It gives a longer room to take advantage of oil revenue. For instance, Ecuador signed up agreements against corruption, and its law mandated labor rights. Though, political and economic exchanges were led by informal processes. Informality is not an ended issue in Colombia, but its increasing reliable environment reduced the gap in formal institutions, such as the higher presence of the state, through the reduction of illicit crops. It is a starting point for institutional change toward a stable economic growth. The proposal of Ecuador to leave oil underground might be a starting point as well, if it gives time to policymakers to strengthen institutional efficiency. It reduces the risk in the boom-bust cycle. It warns about uncertainty, but also it means individuals are able to construct institutions to ensure the society they want. The historical pattern of failures provides to government and citizens the behaviors to remove and acquire day to day. The performance in economic and political exchanges leads to incremental outcomes in education, health and labor. Institutional efficiency will make a stamp in the culture. It is a path of economic development for oil-rich countries. The solution to the resource curse remains in this belief.
Foot Note
1Interview with the author in Quito on September, 2010.
2Interview with the author in Quito September, 2010.
3Interview with the author in Bogota, October 2010.
4Interview with the author in Quito, September 2010.
5Interview with the author in Quito in September, 2010.
References
Artola, V. & Pazmiño, F. (2007). Análisis de los fondos petroleros en el Ecuador. Reporte del Banco Central. Retrieved from: http://ximah.net/w/bce/?page_id=2314 [ Links ]
Auty, R. (1993). Sustaining development in mineral economies: the resource curse thesis. London: Routledge. [ Links ]
Auty, R. (2009). Natural resource rent-cycling outcomes in Botswana, Indonesia and Venezuela. In Khodeli, I. (Ed.). From curse to blessing?: Using natural resources to fuel sustainable development. (pp 33-44) Oxford: Wiley-Blackwell. [ Links ]
Banrepública - Banco de la República (2000). Resumen Marzo 2000. Reporte del Banco Central. Retrieved from: http://www.banrep.gov.co/en/node/22742 [ Links ]
Banrepública - Banco de la República (2012) Exchange rate. Reportfrom Central bank. Retrieved from: http://www.banrep.gov.co/en/data-and-statistics [ Links ]
Boland, L. (1993). Knowledge and the role of institutions in economic theory. In Hodgson, G. (Ed.). The economics of institutions. (pp 314-329) Aldershot: Cambridge University Press. [ Links ]
Brown, C. (2002). World energy resources. Springer: Virginia. [ Links ]
Colombian Congress (1995). Fondo de Ahorro y Estabilización Petrolera. Retrieved from http://www.anticorrupcion.gov.co/ [ Links ]
Colombian Constitution (1991). Text of the Constitution of Colombia. Art. 332. Retrieved, from http://confinder.richmond.edu/admin/docs/colombia_const2.pdf [ Links ]
Colombian Department of Economy (2010a). Investor Relations Colombia. Balance Fiscal Trimestral. Gobierno Nacional Central. Retrieved from http://www.minhacienda.gov.co/HomeMinhacienda/politicafiscal [ Links ]
Colombian Department of Economy (2010b). Investor Relations Colombia. Cierre fiscal 2009. [ Links ]
CPI - Transparency International Corruption Perception Index (2014). Corruption Perception Index Report. Retrieved from http://www.transparency.org/research/cpi/overview [ Links ]
Dane - National Administrative Department Statistics (2014) Statistics. Retrieved from http://www.dane.gov.co/daneweb_V09/en/index.php?option=com_content&view=article&id=175&Itemid=28 [ Links ]
Ebbinghaus, B. (2005). When Less is More: Selection Problems in Large-iV and Small-iV Cross-National Comparisons. International Sociology, 20(2), 133-152. [ Links ]
ECB - Ecuadorian Central Bank (2012). Distribución de ingresos obtenidos por exportaciones de hidrocarburos. Retrieved from http://www.bce.fin.ec/frame.php?CNT=ARB0000984 [ Links ]
ECB - Ecuadorian Central Bank (2014). Informe Anuario. Retrieved from http://www.bce.fin.ec/index.php/cuentas-nacionales [ Links ]
ECLAC - Economic Commission for Latin America and the Caribbean (2014). Latin American and the Caribbean Statistics (Cepalstat). Retrieved from http://estadisticas.cepal.org/cepalstat/WEB_CEPALSTAT/Portada.asp [ Links ]
Ecopetrol (2001). Estadísticas de la industria petrolera 2001. Retrieved from http://www.ecopetrol.com.co/especiales/estadisticas2004/legislacion/legislacion_2001.htm [ Links ]
Ecopetrol (2014). Energy for the future. Retrieved from http://www.ecopetrol.com/ [ Links ]
Ecuadorian Constituent Assembly (2008a). Ley Reformatoria para la Equidad Tributaria en el Ecuador. Retrieved from http://asambleanacional.gob.ec/documentos/leyes_aprobadas/aprobacion_proyecto_ley_regimen_tributario_interno.pdf [ Links ]
Ecuadorian Constituent Assembly (2008b). Ley Orgánica para la recuperación del uso de los recursos petroleros del Estado. Retrieved from http://www.memoriaciudadana.org/leyes/ley_aprobada_2_abril_del_2008.pdf [ Links ]
Ecuadorian Department of Labor (2014). Ministerio de Relaciones Laborales. Políticas y Normas de Trabajo y Empleo. Retrieved from http://www.relacioneslaborales.gob.ec/biblioteca/ [ Links ]
Ecuadorian Labor Law (2010). Código del Trabajo. Retrieved from http://www.mintrab.gov.ec/index.php?option=com_content&view=article&id=198&Itemid=165 [ Links ]
EIA - Energy Information Administration (2014). Independent Statistics and Analysis International. Retrieved from http://www.eia.doe.gov/emeu/international/contents.html [ Links ]
ESMAP - Programa de asistencia a la gestión del sector de la energía (2005). Estudio comparativo sobre la distribución de la renta petrolera en Bolivia, Colombia, Ecuador y Perú. ESMAP. [ Links ]
Flacso - Latin American Social Sciences Institute (2014). Flacso Andes. Retrieved from http://flacsoandes.org/web/cms2.php?c=1411 [ Links ]
Fontaine, G. (2010) Petropolítica: Una teoría de la organización energética. Flacso -Abya-Yala. Quito: Instituto de Estudios Peruanos. [ Links ]
Furubotn, E. & Richter, R. (2005). Institutions and Economic theory: The contribution of the new institutional economics. Michigan: The University of Michigan Press. [ Links ]
GAO - Government Accountability Office (2008). Plan Colombia: Drug reduction goals were not fully met, but security has improved; US agencies need more detailed plans for reducing assistance. GAO. Retrieved from http://www.gao.gov/new.items/d0971.pdf [ Links ]
González, A. (2007). Governance for the 21st Century: The fight against corruption in Latin America. London: Transaction. [ Links ]
Hagedorn, K. (2007). Integrative and Segregative Institutions: a dichotomy for understanding institutions of sustainability. Berlin: Humboldt University Berlin. Department of Agricultural Economics and Social Sciences. Division of Resource Economics. [ Links ]
HDI - Human Development Index Report (2014). Human Development Report 2009. Retrieved from http://hdr.undp.org/en/statistics/ [ Links ]
HNA - Hydrocarbons National Agency (2014a). Regalías. Retrieved from http://www.anh.gov.co/Operaciones-Regalias-y-Participaciones/Regalias/Estadisticas/Paginas/default.aspx [ Links ]
HNA - Hydrocarbons National Agency (2014b). Funciones. Retrieved from http://www.anh.gov.co/la-anh/Paginas/Funciones.aspx [ Links ]
Humphreys, M., Sachs, J. & Stiglitz, J. (2007). What is the problem with natural resource wealth? In Humphreys, M., Sachs, J. & Stiglitz, J. (Eds.). Escaping the resource curse. (pp 1-20) New York: Columbia University Press. [ Links ]
IDB - Interamerican Development Bank (2014) Data-Gov. Retrieved from http://www.iadb.org/datagob/index.html [ Links ]
ILO - International Labor Organization (2002). Effect to be given to resolutions adopted by the International Labor Conference at its 90th Session, (b) resolution concerning decent work and informal economy; Governing body, 285th session, seven item on the agenda. Geneve: ILO. [ Links ]
Inec - Ecuador National Institute of Statistics and Censuses (2014). Population. Retrieved from http://www.ecuadorencifras.gob.ec/ [ Links ]
Jerome, A. (2007). Averting anarchy in Nigeria: practical proposals for lifting the oil curse. In Wohlmuth, K. (Ed.), Africa-commodity dependence, resource curse and export diversification: African development perspectives. Vol XII, (pp. 81-114) Berlin: Transaction publishers. [ Links ]
Karl, T. (2007). Ensuring fairness: the case for a transparent fiscal social contract. In Humphreys, M; Sachs, J; & Stiglitz, J. (Eds.). Scaping the resource curse. (pp 256-285) New York: Columbia University Press. [ Links ]
Khodeli, I. (2009). From curse to blessing?: Using natural resources to fuel sustainable development. Oxford: Wiley-Blackwell. [ Links ]
Minminas - Ministerio de Minas y Energía (2014). Regalías. Retrieved from http://www.minminas.gov.co/minminas/downloads/UserFiles/File/Memorias/Memorias_2011/02-REGALIAS.pdf [ Links ]
Minprotección - Ministerio de Protección Social (2008). Propuesta sobre la definición de política pública para la generación de trabajo digno y decente en el país. Retrieved from http://www.minproteccionsocial.gov.co/vbecontent/library/documents/DocNewsNo18500DocumentNo9513.PDF [ Links ]
Minprotección - Ministerio de Protección Social (2010a). Salario mínimo históricos. [ Links ]
Minprotección - Ministerio de Protección Social (2010b). Derechos de los trabajadores. Retrieved from http://www.minproteccionsocial.gov.co/vbecontent/newsdetail.asp?id=14666&idcompany=3&ItemMenu=1_252 [ Links ]
Monty, M. & Keith, J. (2009). Polity IVCountry Reports 2008. Retrieved from http://www.systemicpeace.org/polity/polity06.htm#sam [ Links ]
Mork, K. (2000). Business cycle and the oil market. In Stevens, P. (Ed.), The Economics of Energy Vol I. (pp. 15-85). Northampton: Elgar. [ Links ]
North, D. (1990). Institutions, institutional change and economic performance. New York: Cambridge University Press. [ Links ]
North, D. (2005). Institutions and the performance of economics over time. In Ménard, C. & Shirley, M. (Eds.) Handbook of new institutional economics. (pp 21-30) Netherlands: Springer. [ Links ]
OAS - Organization of American States (1996). Inter-American convention against corruption. Retrieved from http://www.oas.org/juridico/english/treaties/b-58.html [ Links ]
OECD - Organization for Economic Cooperation and Development (2014). Country risk classification of the participants to the arrangement on officially supported export credits. Retrieved from http://www.oecd.org/tad/xcred/cre-crc-current-english.pdf [ Links ]
Perry, G. & Olivera, M. (2012). Petróleo y minería: ¿bendición o maldición? Bogotá: Fondo de Cultura Económica. [ Links ]
Petroecuador - Empresa Estatal de Petróleos del Ecuador (2010). La Empresa. Retrie-vedfrom http://www.petroecuador.com.ec/ [ Links ]
Presidency of Colombia (2014). ABC del nuevo régimen de zonas francas. Retrieved from http://web.presidencia.gov.co/especial/zona_franca/index.html [ Links ]
Pulido, C; Montes, E. & Beltrán, G. (2004). Balanza de pagos petrolera 1990-2002. Retrieved from http://www.banrep.gov.co/docum/ftp/borra278.pdf [ Links ]
Radon, J. & Thaler, J. (2009). Resolving conflicts of interest in state-owned enterprises. In Khodeli, I. (Ed.). From curse to blessing?: Using natural resources to fuel sustainable development. (pp 11-20). Oxford: Wiley-Blackwell. [ Links ]
Robinson, J., Torvik, R. & Verdier, T. (2006). Political foundations of the resource curse. Journal of Development Economics, 79(2) 447-468. Retrieved from http://www.sciencedirect.com/science/article/pii/S0304387806000137 [ Links ]
Semana (2007, may 5). Semana Magazin. La gran encuesta de la parapolítica. Retrieved from http://www.semana.com/wf_InfoArticulo.aspx?idArt=103020 [ Links ]
UN - United Nations (2005). United Nations Convention against corruption. Retrieved from http://www.unodc.org/unodc/en/treaties/CAC/index.html [ Links ]
Warner, A. & Sachs, J. (1995). Vatural resource abundance and economic growth. Retrieved from http://www.nber.org/papers/w5398.pdf [ Links ]
Wohlmuth, K (2007). Abundance of natural resources and vulnerability to crises, conflicts and disasters. In Africa - Commodity dependence, resources curse and export diversification: African development perspectives. (pp 3-48). Berlin: Transaction Publishers. [ Links ]
Yasuní-ITT (2014) A big idea from a small country. Retrieved from http://www.yasuni-itt.gob.ec/ [ Links ]
Zuluaga, O. (2008). La política petrolera y el Fondo de Estabilización de Precios de los Combustibles. Retrieved from http://web.presidencia.gov.co/columnas/columnas261.html [ Links ]
