


Services on Demand
Journal
Article
 English (pdf)
 Article in xml format
 Article references
 Send this article by e-mail
Indicators
-
 Cited by SciELO
 -
 Access statistics
Related links
-
 Cited by Google
 -
 Similars in
SciELO
Similars in
SciELO -
 Similars in Google
Share

 Permalink
CT&F - Ciencia, Tecnología y Futuro
Print version ISSN 0122-5383On-line version ISSN 2382-4581
C.T.F Cienc. Tecnol. Futuro vol.1 no.4 Bucaramanga Jan./Dec. 1998
F. KONDO2 and J. HERNÁNDEZ2
ABSTRACTT
Matrix acidizing is a stimulation technique only applicable to wells with surrounding damage. It is therefore very important to differentiate the real formation damage from the damage caused by flow dynamic effects. The mechanical damage corresponds to flow restrictions caused by partial penetration, poor perforation as well as to reduced diameters of the production tubing. The dynamic effects are generated by inertia caused by high flow rates and high-pressure differentials. A common practice in our oil fields is to use a general formulation as acid treatment, most of the times without previous lab studies that guarantee the applicability of the treatment in the formation. Additionally, stimulation is randomly applied even treating undamaged wells with negative results and in the best of the cases, loss of the treatment. The selection of the well for matrix stimulation is an essential factor for the success of the treatment. Selection is done through the evaluation of the skin factor (S) and of the economic benefits of reducing the skin in comparison to the cost of the work. The most appropriate tool for skin evaluation is a good pressure test where the radial flow period can be identified. Nevertheless, we normally find outdated tests most of the times taken with inaccurate tools. The interpretation problem is worsened by completions in which there is simultaneous production from several sand packages and it is difficult to individually differentiate damage factors. This works states a procedure for the selection of wells appropriate for stimulation; it also proposes a method to evaluate the skin factor when there are no accurate interpretations of the pressure tests. A new and increasingly applied methodology to treat wells with high water cuts, which are usually discarded due to the risk of stimulating waterzones, is also mentioned.
Keywords: matrix, acidization, stimulation, damage, well screening.
RESUMEN
La acidificación matricial es una técnica de estimulación aplicable sólo a pozos que presentan daño en sus alrededores. Por esta razón es de extrema importancia distinguir los efectos de daño de formación real de los efectos de daño mecánico y de los efectos causados por efectos dinámicos de flujo. El daño mecánico corresponde a restricciones al flujo ocasionadas por penetración parcial, baja eficiencia de cañoneo y diámetros reducidos en la tubería de producción, entre otros. Los efectos dinámicos son generados por efectos de inercia debidos a altas tasas de flujo y altos diferenciales de presión. Una práctica común en nuestros yacimientos es la de utilizar una formulación general como tratamiento ácido, muchas veces sin estudios de laboratorio que garanticen la aplicabilidad del tratamiento en la formación. Adicionalmente la estimulación se aplica indiscrimidamente, llegándose a tratar pozos sin daño en los cuales se obtienen respuestas negativas y en el mejor de los casos la pérdida del tratamiento. La selección del pozo adecuado para la estimulación matricial es un paso determinante en el éxito del tratamiento. La selección se efectúa mediante la evaluación del factor de daño o skin (S) y los beneficios económicos de reducir el skin en comparación los costos del trabajo. La herramienta más adecuada para calcular el skin es una buena prueba de presión en donde se pueda identificar el período de flujo radial. Sin embargo, lo normal es encontrar pruebas desactualizadas y muchas veces tomadas con herramientas de poca confiabilidad como el caso de las cartas de ameradas. Adicionalmente, el problema de la interpretación se agudiza por los completamientos en que se tiene producción simultánea de varios paquetes arenosos y es complicado distinguir los factores de daño individualmente. En este trabajo se plantea un procedimiento para la selección de pozos candidatos a estimulación y un método para la evaluación del factor de daño cuando no se dispone de interpretaciones confiables de las pruebas de presión. Adicionalmente se menciona una nueva metodología en creciente aplicación, para tratar pozos con altos cortes de agua, los cuales son usualmente descartados por los riesgos de estimular las zonas de agua.
Palabras Claves: acidificación, matricial, daño, estimulación, selección de pozos.
INTRODUCCIÓN
Acid stimulation of wells is a common practice in the oil industry. Unfortunately, it is not a very well understood technique and the simulations of the acid- rock reactions are still under research (Shechter, 1992).
On the field, it is a common practice to apply the same formulation to all wells. The same formulation is even used at different fields sometimes neglecting differences in lithology, fluids, temperature and all other phenomena that affect reactions of the acid with the rock. Additionally, the treatment is commonly applied to any well generating a waste of time and resources and in many cases, generating problems in wells where there wasn't any. Statistic evaluations show that the percentage of successful well acidizing is not very high (Gidley, 1985). Nevertheless, this success percentage can be increased through a better evaluation and control both in the study and application stages. The most important stage in a matrix acidizing treatment is the selection of the candidate wells that require a treatment, i.e. that have damage in the formation. Therefore, before deciding to implement a treatment, it is vital to analyze if the selection of the candidate is the result of damage in the formation or of an inadequate interpretation of the model.
PRODUCTIVITY INCREASE BY MATRIX ACIDIZING
Matrix acidizing is a technique in which an acid solution is injected inside the formation at pressures below fracture pressure, in order to dissolve minerals present in the formation pores thus recovering permeability in the area surrounding the well. This technique is successfully applied in fields with permeability above 10 md (Mcleod, 1989). Otherwise, the hydraulic fracturing is the appropriate technique. Nevertheless, fracturing with short and wide fractures is being successfully applied in fields with permeability above 10 md (Economides and Hill, 1994). This is not the case for matrix acidizing in sandstones with permeability below 10 md.
The most used acids are the chlorhydric acids, which are used to dissolve carbonates and mixtures of chlorhydric - fluorhydric acids, which are used to dissolve silicates such as clays, feldspars, and amorphous silica. Other acids such as the organic ones are used for special applications mainly for corrosion reduction and/or to keep acid - rock reaction byproducts in solution.
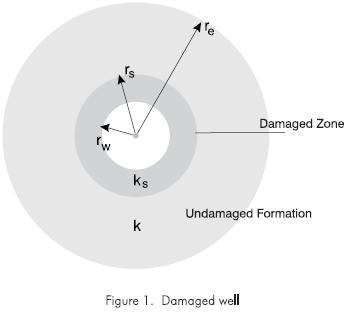
Acid stimulation can greatly increase the production of a well only in cases where there is formation damage close to the hole and the reservoir has enough pressure to increase productivity. When undamaged formations are matrix stimulated, the production increase is very low. Muskat explains it. Figure 1 outlines a simplified radial system as the representation of the oil field surrounding the well in which k is the original permeability of the well in md, ks is the permeability of the altered permeability zone in md, rw is the well radius in feet, rs is the penetration radius of the altered zone in feet and, re is the drainage radius of the well in feet.
The following equation describes the production relation of a well with altered permeability in its surroundings in comparison to a well with original permeability:
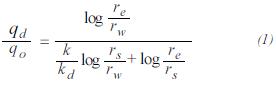
where qd is the production rate of the well with an altered permeability zone in BPD, qo is the production of the same well without an altered zone in BPD. All other terms were previously defined.
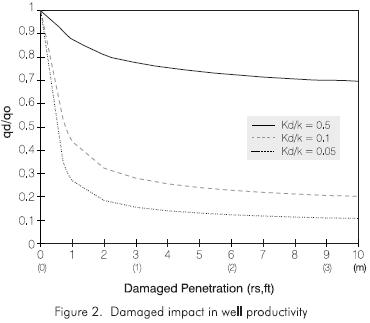
Figure 2 shows the impact caused by the recovery of a damaged zone in the productivity of a well. The applied variables were, 0.1 m (0.33 ft) for rw and 244 m (745 ft) for re. As it can be observed, a 90% permeability decrease, i.e. 0.1 kd/k., a normal situation in wells drilled with water based mud can cause up to a 68% production decrease with only an invasion of two feet and almost 56% with a one feet invasion. The productivity of the well can be ten times increased if permeability is reduced in 95% with a six feet penetration.
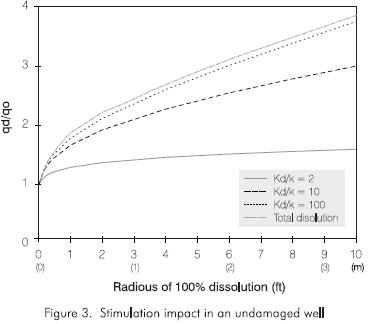
On the other hand, it is not interesting to stimulate an undamaged well. This fact is explained in Figure 3 applying the same variables of the previous exercise. qe, in the y-axis, is the caudal of the stimulated well. Notice that in the hypothetical case of a total dissolution of the area surrounding the well, in the first 3 m (10 ft) close to the hole, only a 1.8 productivity increase would be attained. This is the main reason for only applying the stimulation treatment in damaged wells.
DAMAGE RECOGNITION METHODS
A damage in the formation can be suspected when the production of a well is under the estimated one and/ or it experiments a declination rate above the expected one. Nevertheless, there are other mechanical factors adversely affecting the productivity of a well. These factors include low perforating density, small size of the hole, partial penetration, low quality of cement setting, and compressive effects of the formation.
A systematic analysis of the problem at any stage of the development of the well and of the field is required in order to define the real formation damage. Some of the techniques available for the identification of the damage are the DST (Drill Stem Test), electric logs, mechanical profile of the wells, production record, comparison of production performance of offset wells, pressure transient wee tests analysis, production tests and laboratory analysis.
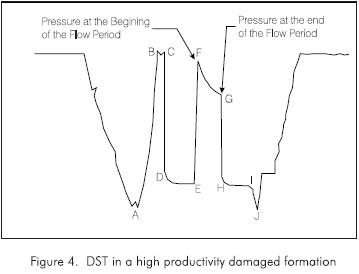
Drill Stem Tests
The DST tests are used during the first stages of the exploratory drilling of a formation to confirm the production potential. If geochemical analyses of the drilling cuts establish the presence of hydrocarbons but the DST shows a non-productive interval, there is the possibility of damage to the formation.
The pressure data analyses vs. time generated during the DST can be semi-quantitatively used to determine the severity of the damage through calculation of the skin. It is advisable to extreme precautions during the first DSTs because the pressure pulses and the high- pressure differentials can start fine migration. The evaluation of the operation records is required to identify aspects that may have caused damages in the area surrounding the well.
Figure 4 shows a typical DST curve of a high productivity formation with a severe damage. The characteristics that identify the damage in this curve are: a short radius curve in the CDE section, an almost flat slope along DE, an increase immediately after the closing period as in EF, and a large difference between the closing pressure and the pressure at the end of the flow.
If some problems have been identified through the DST and the electric logs, more research is required to determine which of the aspects of the drilling plan or of the completion one is responsible for the poor response of the formation. The daily drilling, cementation and completion and mud programs as well as the completion and stimulation fluids must be checked. If possible, the fluid losses vs. time graphic shall be drawn as to identify the zones with possible losses of high pH filtering. These zones constitute excellent candidates for high damage values.
Electric Logs
The penetration of the filtering mud during drilling can be calculated through the responses of the resistive or conductive logs of shallow, medium and deep devises. These answers will give semi-quantitative indicators of the possible impact of the damage on well production.
The invasion radius could be determined if one of the curves has a different value when compared to the other two. Three scenarios are possible when the tree curves are joined together: 1) there is no filtering invasion, 2) the invasion is too deep and the three answers are in the washed zone and 3) there is no enough contrast between the formation water and the salinity of the mud filtering.
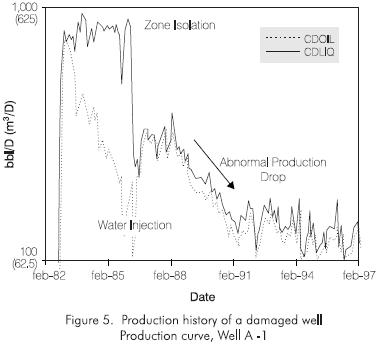
Production and Injection Records
The production changes of the well through time is one of the tools that can be used to detect a damage to a formation. For instance, a damage in the area close to the well can be suspected if an anomalous production decline is observed during production while the well's mechanical states remain constant; as it is the case immediately after a workover. The sudden changes in the production rate disregarding the depletion strategy can be associated to the precipitation of organic or inorganic compounds or with the migration of fines near to the well and/or with artificial lifting problems.
Figure 5 shows a sharp production change of the production of the well that suggests damage to the formation. A drop in the production can be observed after injection has begun in spite the fact that the tendency should be more or less stable due to the replacement of oil by water.
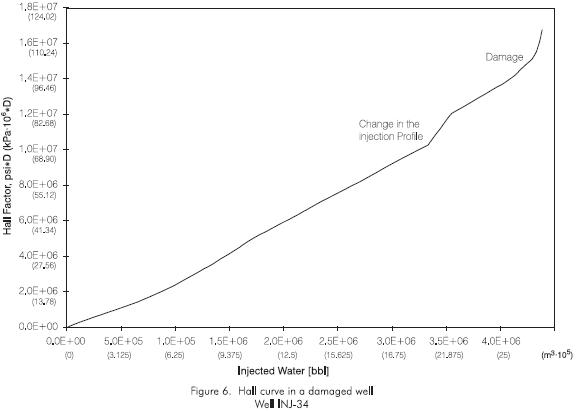
Hall's graphics are very useful in injector wells to evaluate production decrease or increase. The damage is identified through the slope increase in the logarithmic graphic of the accumulated production vs. Hall's pressure coefficient (Hawe, 1996) (Figure 6)
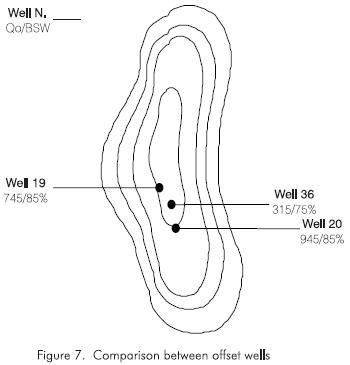
Comparison of production performance of offset wells
The production rates and the water - gas production relations as regards the oil from near and neighboring wells are compared in order to evaluate in detail the causes of low production levels in some wells. This analysis can suggest the presence of damage to the formation only if there are no strong permeability and thickness variations in the areas of the oil field in question.
The confrontation of the total caudal among wells with similar BSW values must be carried out since wells with high water cuts normally have higher rates due to the water's largest mobility. Figure 7 shows the strong production differences among some neighboring wells that suggest damage in well 36 with a production of almost a third of that of its neighbors in spite of their similar thickness and completion.
Pressure Transient Well Test Analysis
The pressure tests are the most reliable and important tool to determine formation damages and to select wells candidates for stimulation. The determination of the flow capacity, kh, the skin S, and the static pressure of the oil field at a determined rate, supply an excellent indication of the production capacity of a given well.
Nevertheless, the results of the analyses can be affected by the applied interpretation criteria, the quality of the test data, and the development of the radial flow region. The tests simultaneously carried out in wells completed in several units that have different permeabilities and pressures allow the estimation of an average pressure and permeability with certain reliability.
Nevertheless, these values must be carefully used for the determination of the damage factors.
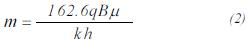
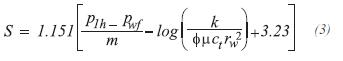
It must be taken into account that parameters such as the thickness of the formation or the viscosity of the fluid have very little incidence in the determination of the skin since this factor is mainly influenced by the value of the slope (m) of the semi-logarithmic graphic, which remains constant regardless of the magnitude of such parameters. These parameters, together with the compressibility are part of a logarithmic term as it can be seen in equations (2) and (3) thus minimizing their effect. In summary, the damage factor mainly depends on the development of the radial flow region and the adequate determination of m. Unfortunately, the pressure tests in relatively old wells were taken with amerade cards and it is very difficult to obtain the slope in the interpretation of the tests. In recent tests of wells with multiple production zones, average values could be obtained for the permeability but not for the skin ignoring the conditions of the areas that don't contribute to the flow. This implies that the damage and permeability values of the formation have a high error index and must be considered with precaution.
Production Records
The interpretation of the production records constitutes and additional tool for the identification of formation intervals that don't provide fluids and which depending on the type of identified damage may be associated to perforation/formation cloggings that could justify the utilization of divergent techniques for the stimulation treatment.
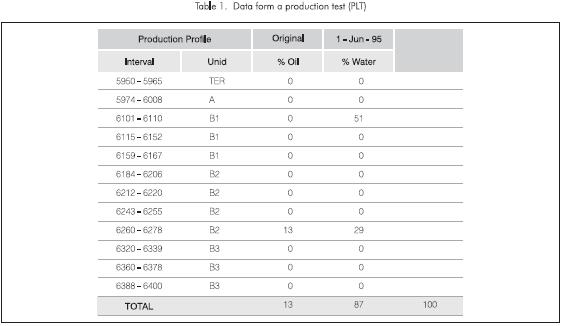
Table 1 shows the results of the PLT test where production can be observed in only two intervals. The other intervals don't produce or are depleted and take fluids from the production zones. If this result is repeated at different flowing bottom pressures, we can estimate the damage zones, the water production zones, the oil production zones and the depleted zones.
Laboratory Tests
All the above mentioned techniques can identify the possible presence of damage in a well but none of them can completely clarify the state during which damage was produced to the well neither quantify the relative contribution of several operations. The laboratory tests, correctly designed and interpreted can not only decipher the damage potential but also its presence and mechanisms together with possible solutions for the problem.
The laboratory tests involve a petrologic analysis of the sample, the mineralogical composition of the rock and the distribution of minerals and their relative position. Characterizations tests of the fluids for formation injection as well as of the ones originally present in the formation involve fluid compatibility tests, reology, and physicochemical analyses of waters among others. At the end, the adequate lab tests will report nuclei displacements, representing the pressure and temperature of the oil field together with the saturation story.
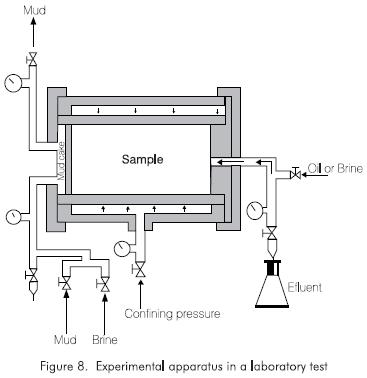
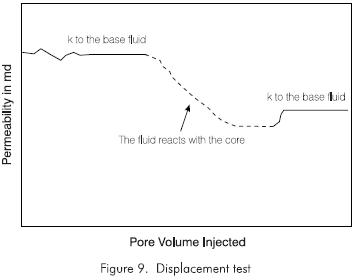
Figure 8 shows a layout of the equipment used in the simulation of the damage caused by the filtering of the drilling fluid. Figure 9 shows the typical reported graphic of the permeability of a base fluid that doesn't react with the formation and afterwards, the permeability measured at the moment of displacement of the fluid suspected to cause the damage injected in the opposite direction and finally, the return permeability of the base fluid in the initial injection direction. This permeability value is compared to the initial one to report the degree of damage. This test can be composed of multiple cycles where several fluids are injected in order to measure the individual contribution effects to the damage to the formation.
Radial flow Equation
Unfortunately, not all the data required to apply all the above mentioned technologies are always available.
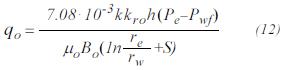
Nevertheless, another easily applicable tool can offer more information for the selection of wells appropriate for matrix stimulation. The radial flow equation, which describes the movement of the fluid that is produced or injected into the formation, can be used for this purpose.
There are two available equations: one for the steady state and the other for the pseudo-steady state.
Steady state
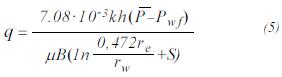
Pseudo-Steady state
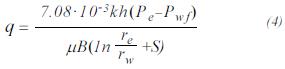
It is considered that wells have different BSW values, that pressure has remained stable whether by water injection or by the support given by an aquifer and that the steady state radial flow equation is applicable. There is no gas saturation and the gas produced at the surface comes from the gas in solution. As it can be observed, the applied data are easily taken from the oil field information.
A methodology will be initially proposed for the case of the absence of relative permeabilities. In this case, the answer will be little conservative. Nevertheless, the obtained values will not be taken as absolute but as the tendency of each well and when correlated to the previously described analyses, they will be of great benefit for the selection of candidate wells.
An alternate methodology will be subsequently proposed for the involvement of the relative permeability curves that will generate values that are more conservative.
Steady state equation - Monophasic fluid.
In this case, it is assumed that the produced fluid has one phase and its characteristics will be averaged with the BSW of each well. The origin of the values applied in the radial flow equation is given bellow.
Thickness (h)
The data of the thickness of the oil field are taken form the available lithological (Gamma Ray or SP) and from the resistive logs.
Permeability
It is possible to obtain this variable from the pressure tests, which report the effective permeabilities for each phase, from basic lab analyses and/or from the petrophysic interpretation satisfactorily adjusted by core data.
The data from log interpretation have the advantage of giving information of all wells of the different units. The permeability for each unit was considered as the geometric average of the zones that can effectively produce fluids.
The data from basic core analyses and logs determine the absolute permeability; they must be corrected using the relative permeability curves in order to consider the effective permeability to the fluid in the flow equation.
Hall's graphics are also a tool for permeability determination in injector wells.
Pressure of the oil field
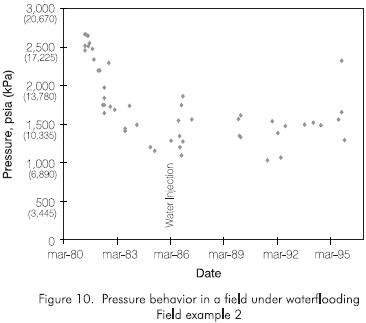
The pressure behavior of the oil field as regards time and/or the accumulated production is a tool that allows the extrapolation of the average pressure information of the oil field to areas of scarce pressure information (Figure10). The control of the energy available in the well is carried out through increase or decrease tests or through the measurement of static pressures. The behavior of the pressure could justify the production variations of a well that can be erroneously evaluated as damaged.
This datum is taken from the most recent pressure tests of each well. Frequently, not all wells have enough average pressure data of the oil field. Therefore, in some cases, this value is extrapolated from nearby wells.
The behavior of the pressure of the oil field or of the injection model is analyzed to obtain a close estimation of the pressure value.
This is a critical value for the calculations with the radial flow equation; therefore, it is strongly advisable to verify the estimated values before taking any decision concerning a treatment.
Flowing well pressures
It can be calculated from the multiphase flow correlations in cases of flow to the surface. For mechanical pumping cases, pwƒ is obtained from ecometer readings or from the level data monthly taken at the field with the application of the following formula:

where Dmp is the depth at the middle of the perforations and ƒl is the fluid level at the annular. Ρa will be defined below.
Fluid density
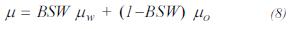
Based on the BSW of each well, a fluid with average properties was assumed as it was previously mentioned. The following is the applied equation:

where Ρa is the density of the water and Ρo is the density of the oil. BSW is the water cut for each well.
Viscosity
It is assumed that the produced fluids come from different flow paths within the oil field which prevents the mixing and emulsification between water and oil within the formation. It is averaged according to the following formula:
where μw is the viscosity of the water and μo is the viscosity of the oil field both at the field's temperature.
Volumetric formation factor
A value that represents the water - oil mixture following the BSW proportion was averaged:
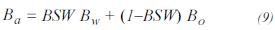
where Bw is the volumetric factor of the water and Bo is the volumetric factor for the oil, both at the conditions of the field and in bbl/STB units.
External radius (re)
The external radius is a value that has very little effect in the result since it is found within a logarithmic term. A value in the 7 to 8 range is normally taken for the logarithmic relation.
Steady state equation - Biphasic flow
In this case, the flow effect of two non-miscible liquids is taken into consideration. To do so, the fractional flow curve is derived from the relative permeability curves. If the curve of permeabilities has been obtained, the following equation can be applied:
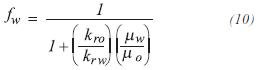
where the capillary and gravitational effects have been neglected. kro and krw are the permeabilities relative to oil and water respectively. Since relative permeabilities are a function of the water saturation then the curve, where the fractional flow is a function of the water saturation, can be obtained. Instead of using fractional flow, in field is easier to use water cut by applying the following equation:
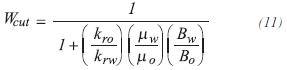
The water saturation value is then obtained from the the water cut value and the kro datum is obtained with the water saturation and the relative permeability curves.
Then we can apply:
Due to the assumptions inherent to the equations applied in calculations with the steady state equations, high skin values aren't necessarily an indication of damage to the formation, they may be due to the effect of the two phase flow (gas-oil) and/or to non Darcy flow in the formation. These phenomena are caused by high-pressure differentials, high gas-liquid relations, a Pwƒ lower than the bubble pressure and high flow rates (Brannon et al., 1987).
Complementary analyses
The analysis of information additional to the one that can establish the presence of damage is important to discriminate if the established damage can be removed through stimulation or if it corresponds to circumstances outside the formation.
Mechanical conditions of the wells
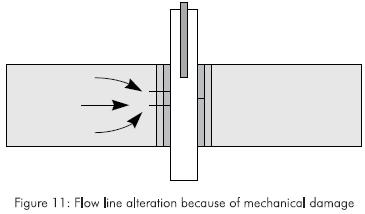
Identification of the mechanical damages in wells with a poor perforation density or in wells with partial penetration. These phenomena alter the conditions of flow, inducing damage effects as turbulence or spherical flow in the region close to the face of the well (Figure 11). The wells with gravel pack previously completed with casing, present damage due to the increase in pressure drop caused by restrictions in the perforations and in the gravel pack region. In cases where the calculated mechanical damage is equivalent to the total damage, the well must be discarded as candidate for stimulation. These effects are reflected as a positive skin in the well but that does not imply damage in the formation.
Field production history
The production behavior of the well is the reflection of its interactions with neighboring wells and of the thermodynamic changes that occur in the field due to production strategies (e.g. water injection), therefore, it is very important to know the production history of the field both during the primary and secondary production stages, the record of the drilling, workovers, the sand cleanings, perforation, stimulations, etc., in order to properly understand the individual behavior of a given well (Figure 12)
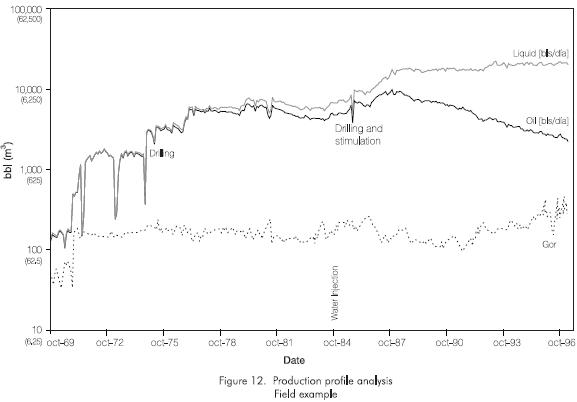
The reliability on the selection of candidate wells in a field can be additionally increased through the analysis of all the wells instead of focusing on a single one. It must also be considered that parameters such as the injection and production water, the produced hydrocarbons and the lithological characteristics are generally similar for all wells in a given field.
Evaluation of previous stimulation treatments
Stimulation treatments that had been carried out in the well or in other wells of the field must be analyzed in detail to use them as experience for the correct selection of wells and the design of future treatments.
In addition to the operation reports of the treatments and the before and after production reports, Pwƒ measurements must be taken. If possible, pressure test must also be taken to define the productivity changes of the well and thus correctly evaluate the results of the treatment and of the analyses carried out during the design.
The analysis of the flow back samples provide a more objective idea of the reactions that occurred in the oil field during the treatment and will allow the identification of the real causes of the damage.
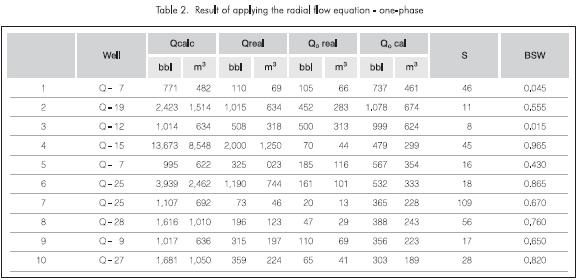
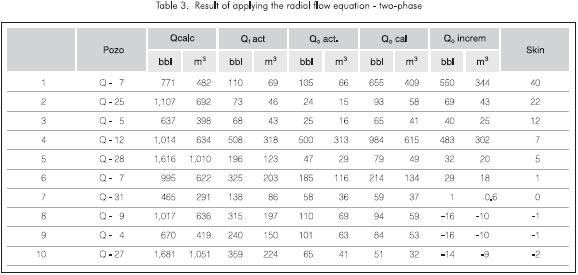
Analysis of the results
Tables 2 and 3 show a summary of the results obtained during the utilization of the steady state radial flow equations given above. It can clearly be seen that the first method (one phase flow) is a more liberal one and it assigns a large damage to almost all wells. On the contrary, the second method (two phase flow) is a more conservative one showing little damage to wells. Moreover, most of the wells are presented in a stimulated state with enormous fractures, which is a highly improbable case. The importance of the method lies in the interpretation of the results as a trend mainly due to the suppositions that are done to simplify the calculations. Permeabilities are averaged, fluids and oil fields are assumed as uniform, etc. Nevertheless, the combination of both methods together with the above mentioned techniques, supply indications for the selection of candidates and they allow establishing priorities according to the oil increase in each well and not according to the value of the damage directly affecting the productions as a function of the water cut of each well.
Acid Treatments in Wells with High Water Cuts
Wells with high water cuts have been traditionally discarded from stimulation treatments due to the fact that they normally produce sharp water cuts and an oil rate decrease after the treatment (Figure 13).
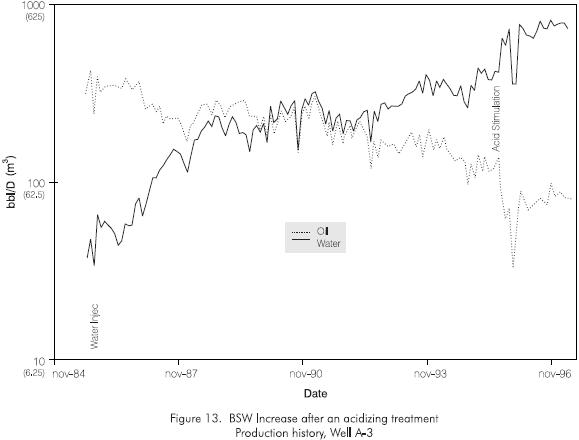
The main difficulty lies on the poor directional control of the injected fluids because in most fields, production is carried out from several zones with simple completion. The injected acid will encounter fluids with a different mobility within the formation. For the case of only water and oil, oil will normally show a higher movement resistance due to its viscosity. In this case, water will offer the least resistance path and the well zone will be stimulated resulting in the production of larger water volumes considerably reducing the oil production.
problem. From sealing balls to high flow rates according to Paccaloni's technique (Paccaloni, 1992). Nevertheess, these techniques have not totally solved the problem. A method that could increase the success relation in the treatment of wells with a high BSW has been recently proposed (Gidley et al., 1996). The technique that prevents discarding the accomplishment of matrix acidizing in wells with a high BSW and which are economically attractive, consists in the injection of a CO2 pre-flow miscible in both water and oil to displace the oil field fluids from the face of the well allowing the acid to act uniformly and freely with the rock. It also prevents detrimental reactions of the acid with the water and/or the oil. (e.g. tendency to form emulsions with the acid, organic or inorganic precipitates as a subproduct of the reaction)
CONCLUSIONS
- The matrix stimulation treatments are effective and profitable in wells with damages and very little attractive in wells with no formation damage.
- The utilization of steady state flow equations is a quick method to evaluate the productivity conditions of wells and they constitute another tool for the selection of wells appropriate for matrix stimulation treatments.
- The obtained results are optimistic when one phase is assumed and conservative when two phase is assumed. Nevertheless, the results show tendencies instead of absolute values due to the suppositions required for the calculation.
- There is a possibility to increase matrix stimulation success by integrating the results obtained through the proposed methods with the quantitative evaluations of the mentioned techniques when applying the treatment in damaged wells.
- An adequate characterization of the oil field and good pressure information allow estimating the required data with more accuracy thus increasing the reliability of the results obtained through the equations.
- The usage of CO2 as a pre-flow in acid treatments allows considering wells with high water cuts with a good oil production potential, as candidates for matrix stimulation.
REFERENCES
Brannon, D. H. et al.,1987. "Matrix Acidizing Design and Quality-Control Techniques Prove Successful in Main Pass Area Sandstone", paper SPE 14827, JPT (August). [ Links ]
Economides, M. J., Hill, A.D. and Ehlih-Economides, C., 1994. Petroleum Production Systems, PRT Prentice Hall, Englewood Cliffs, New Jersey. [ Links ]
Gidley, J. 1985."Acidizing Sandstone Formations: A detailed Examination of Recent Experience", paper SPE 14164, presented in the SPE Annual Technical Conference and Exhibition, Las Vegas, Nev., (Sep). [ Links ]
Gidley, J., Brezovec, E. J. and King, G. 1996."An Improved Method for Acidizing Oil Wells in Sandstone Formations", paper SPE 26580, SPE production and Facilities (February) [ Links ]
Hawe, D. 1976. "Direct Approach Through Hall Plot Evaluation Improves the Accuracy of Formation Damage Calculation and Eliminates Pressure Fall-Off Testing", paper SPE 5989 (July). [ Links ]
McLeod, H. O. 1989. "Significant Factors for Successful Matrix Acidizing", paper SPE 20155, presented in the SPE New Mexico Technical Centennial Symposium (Oct.) [ Links ]
Meehan, D. N. 1995. "Technology Vital for Horizontal Well Success", Oil & Gas J. (Dec. 11): 39 - 46. [ Links ]
Paccaloni, G., 1992. "A New, Effective Matrix Stimulation Diversion Technique", Artículo SPE 24781 presented in the 67th SPE Annual Technical Conference and Exhibition, Washington, DC. (Oct.) [ Links ]
Shechter, R. S., 1992. Oil Well Stimulation, Prentice Hall, New Jersey. [ Links ]
Williams, B. B., Gidley, J. L. and Schechter, R. S., "Acidizing Fundamentals", Monograph Volume 8 SPE, Henry Doherty Series. [ Links ]

