


Services on Demand
Journal
Article
 English (pdf)
 Article in xml format
 Article references
 Send this article by e-mail
Indicators
-
 Cited by SciELO
 -
 Access statistics
Related links
-
 Cited by Google
 -
 Similars in
SciELO
Similars in
SciELO -
 Similars in Google
Share

 Permalink
CT&F - Ciencia, Tecnología y Futuro
Print version ISSN 0122-5383On-line version ISSN 2382-4581
C.T.F Cienc. Tecnol. Futuro vol.2 no.1 Bucaramanga Jan./Dec. 2000
ABSTRACT
Ioannidis, et al., published a statistical methodology for analyzing of porous microstructure to estimate permeability in the Journal of Petroleum Science & Engineering. The method is based on the calculation of the autocorrelation function from binary images of porous space. This paper presents a systematic application of the methodology applied to twenty-three sandstone samples from a Colombian oil bearing formation. Images of porosity were acquired under different detection conditions in order to carry out a comparative evaluation of the results at different resolutions. It was found that the adjustment parameters for the autocorrelation function, as well as its derivative and integral, dependent strongly upon the conditions of image detection. Under conditions of maximum resolution, permeability was estimated within the same order of magnitude of the value measured experimentally, with an accuracy that varies from 1.6% to 24%.
Key words: autocorrelation, length of correlation, permeability, pore geometry.
RESUMEN
Ioannidis, et al., publicaron en el Journal of Petrolum Science & Engineering, una metodología estadística de análisis de microestructuras porosas, desarrollada para estimación de permeabilidad. El método se basa en el cálculo de la función de autocorrelación de imagenes binarias de porosidad. Se presenta una aplicación sistemática de la metodología a 23 muestras de areniscas pertenecientes a una formación hidrocarburífera Colombiana. Se adquirieron imágenes de porosidad a condiciones de detección variables, con el fin de hacer la evaluación comparativa de los resultados a diferente resolución. Se encontró que los parametros de ajuste de la función de autocorrelación, así como su derivada e integral, son fuertemente dependientes de las condiciones de detección de las imágenes. En las condiciones de máxima resolución se logró calcular la permeabilidad dentro del mismo orden de magnitud del valor medido experimentalmente, con un margen de precisión que varía entre el 1,6% y el 24%.
Key words: autocorrelación, longitud de correlación, permeabilidad, geometría de los poros.
One of the most important variables in oil production, if not the most important, is permeability. Any attempt to understand the behavior of this variable contributes significantly to the petrophysical interpretation of oil reservoirs and the definition of hydraulic areas and flow units (Gunter et al., 1997). Permeability, the constant of proportionality in the Darcy's equation, stands for the displacement rate of a fluid in a medium subjected to a differential pressure. Permeability depends on the characteristics of the medium, as well as on the phenomena of the fluid's interaction with it. Reservoir rocks have heterogeneous porous systems with geometric characteristics defined by the conditions of deposition, the particles and the diagenetic activities that modified the system after deposition Nelson (1995).
Despite the numerous factors that determine the geometric configuration of porous media in rocks, most models interpret the system by means of simple geometry, defined by the form, size, and distribution of the particles (Panda and Lake, 1994). Consequently, common models are based on specific characteristics, such as distribution of pore size, specific surface or average particle size. An example is the Carman-Kozeny equation or the version proposed by Mavko and Nur (1997), in which the effect of a fraction of porosity derived from the concept of the percolation threshold is included. Other widely used models of permeability based on the mercury porosimetry (Thomeer 1960, Swamson 1980, Shouxiang and Morrow 1996, and Widland's plots - Gunter et al., 1997) involve a throat size measured at specific points on the curve of capillary injection. These models, as well as that of Mavo and Nur mentioned above share the concept that: 1) total porosity does not define permeability and 2) the affect of geometric structure is important for the interpretation of this variable.
Researchers such as Ehrlich (1991), and Li-Ping (1990), among others, characterized the pore geometry by statistically analyzing two-dimensional images of porosity. They also demonstrated that geometric characteristics of the porous medium influence the quality of reservoir rocks. Ehrlich, et al., (1991), used erosion. dilation techniques on binary images to interpret pore systems by means of artificial pore types, and (Erlich, et al., 1997) showed that specific pore types correlate better with core permeability and mercury porosimetry, than other ones which may be related with residual oil or different fluid saturation.
The geometric characteristics of pore systems also seems to play an important role to the way fluids resides in within the porous medium. (Prince et al., 1995, 1999) suggested the existence of two main components of porosity which they termed the Closed Packed component and the Expanded. The first component is related with short wavelengths while the second one with longer wavelengths of the power spectrum in the Fourier transform of a porosity image. Filtering the image and doing inverse transform (Prince et al., 1995, 1999) have shown the features of the pore system geometry corresponding to each component. According to them, the first component determines the saturation of irreducible water, and the second, the saturation of residual oil.
Regarding to reservoir quality, (Davies et al., 1999) have shown the importance of pore geometry for determination of flow units by applying pore geometry data to the process of rock typing in the early stages of reservoir characterization. Their procedure has been successfully applied since ten years ago, both to carbonate and clastic reservoirs (Davies 1991).
Ioannidis et al., (1996) introduced a methodology for estimating permeability of rock samples, based on calculation the autocorrelation function of binary images of porous space. They applied the methodology to a set of forty-one (41) samples from wide variety rock types. The set of samples analyzed by Ioannidis included the samples previously used by Coskun and Warladw (1993) to perform empirical explanations of permeability variations, their m del was based on the measurement of the diameter of the largest circles inscribed in the pores. For the Coskun and Warladw samples Ioannidis got very good fit between measured and predicted permeability, with 0.98 correlation coefficient (r2) or a confidence level of 99.9%. Keehm et al., (1999) from the rock physics group of the University of Stanford applied autocorrelation method to estimate permeability on a set of seven rock samples, getting a wide margin of error when estimated values are compared with the measured.
Ioannidis results and the aim of establish a methodology to predict permeability, when only small sample fractions are available or permeability measurements are difficult to perform, guided this project to perform a systematic application of the autocorrelation and the corresponding permeability calculation. The methodology, tested using Colombian reservoir samples, will be helpful for reservoir characterizations even if calculated permeability is not very accurate because we sometimes lack of enough core samples and we may dispose of porosity images.
My approach was to acquire porous space images at different resolutions for the purpose of 1) Establish the most adequate conditions of image acquisition for permeability prediction. 2) Perform a comparative study of the autocorrelation as function of image resolution. And 3) analyze the behavior of autocorrelation adjustment parameters at different scales. The image acquisition conditions were designed to match the objective of modeling the geometric feature of pore space that reflect permeability aim. These characteristics correspond to size or shape of the pore forms that are measurable over the image.
BACKGROUND
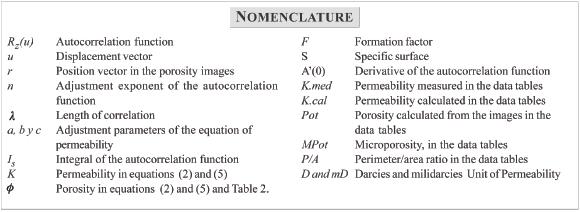
The autocorrelation of binary images yields an exponential function that is adjusted by two parameters, λ the length of the correlation and n the power of the function's exponent (equation1).
Ioannidis et al., (1996) used the following equation for the calculation of permeability:

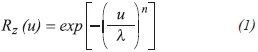
Where,
is the integral of the autocorrelation function (1) and ø is the fractional porosity obtained from the images.
This methodology also provides for an estimate of specific pore surface using the following equation (Berryman and Blair, 1987):

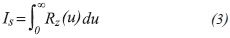
Where: A' (0) represents the derivative of the autocorrelation function at zero point. Specific surface also provides an equation to calculate permeability (5):
Where formations factor "F" and constant "B" are known.
METHOD AND PROCEDURE
A systematic evaluation of the methodology mentioned was carried out by analyzing the behavior of n, λ, Is, S and estimated permeability for different conditions of image acquisition. The petrographic characteristics of the samples, such as grain size and sorting, the ave. rage value of perimeter/area ratio and microporosity were considered in the analysis.
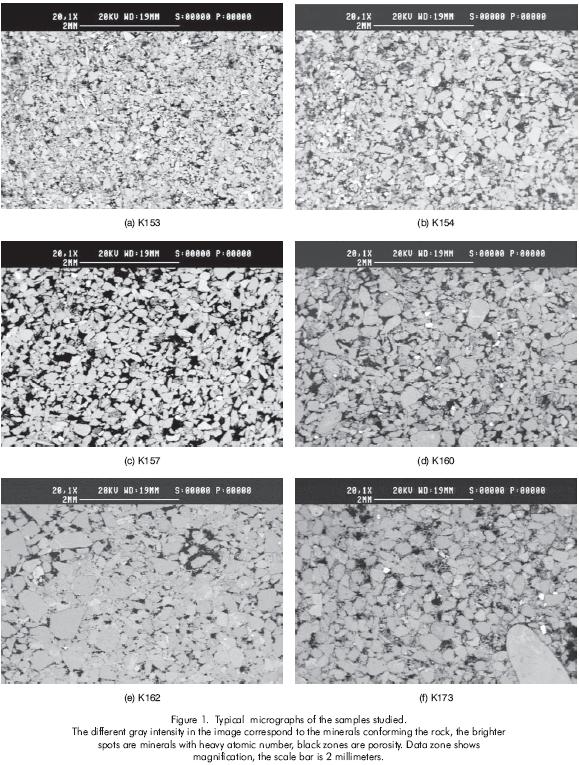
The samples in this paper are from an oil-bearing sandstone formation in the Upper Magdalena Valley in Colombia. The samples have different textures, most of which are medium- to fine- sands, some of them with conglomeratic features, with a variable content of smectitic clays. This clays are aggregates of particles or clasts localized as part of the framework, in the form that Dewan (1983) describes as structural shale fragments (Figure 1).
Procedure
- Acquire gray scale images and go through the binarization process, to get the images of pore space.
- Process the binary images to obtain porosity.
- Calculate the autocorrelation function of binary images.
- Calculate permeability and analyze the model.
Image Acquisition
The process of image acquisition uses backscattered electron images (BSEI) from a scanning electron microscope (SEM) and a dedicated image processing system. The samples, taken from the end part of one and a half inch diameter, plug were impregnated with epoxy resin, then polished and coated with carbon.
Although, some guidelines for the acquisition of images for porosity characterization from thin section images and BSEI have been published (Ehrlich et al., 1984, Nadeau and Hurst 1991), few rules exist for optimizing acquisition of images with the purpose of predicting permeability. For this reason, I applied the outlined procedure to individual series of images, acquired to accomplish the following criteria.
- Analyze the role of large pore forms, covering areas having one millimeter of order of magnitude. At 20-times magnification, using four images.
- Analyze the average behavior of the whole sample. At 50-times magnification, using twelve images, approximately the 15% of the sample area is covered, the resolution of small characteristics is enhanced and some of the large features are still recorded on the image.
- Analyze the behavior of smallest pore space features. At 100-times magnification, using 20 images to cover a representative area, the resolution is notoriously enhanced.
The three postulated detection conditions were worked as individual experiments. The digitalization system and the electron microscope's resolution determine one detection threshold for each detection condition (Table 1).
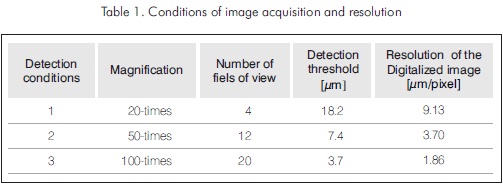
Images analyzed under the three conditions contain a representative number of larger pores and the detection threshold affects only the smaller components of pore space. Therefore the part of porosity that mainly affects permeability at 20-times, 50-times and 100-times magnification would be detected. If permeability was preferentially defined by larger pores its predicted value for images at 50-times magnification would be the most accurate calculation.
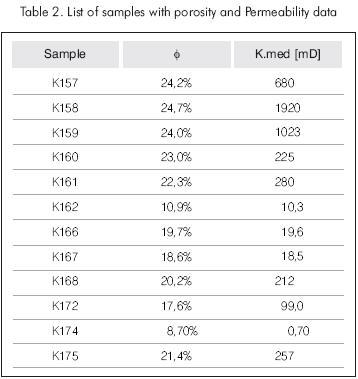
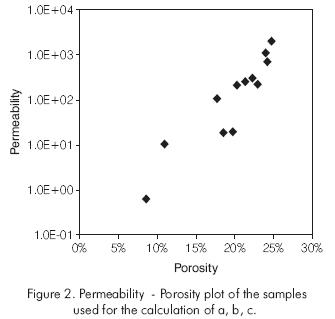
Twenty-three samples were studied at 1st and 2nd detection conditions. Twelve samples from this group have porosity and permeability measurements acquired from the CMS200 system at ICP laboratory following the API RP40 procedure (Table 2, Figure 2). The permeability values provide the data to calculate the constants a, b and c, from the equation (2), and to optimize the model for predicting permeability for the rest of the samples.
I selected nine samples for the analysis at 100-times magnification. Eight samples have similar petrographic characteristics. Four of the eight samples have porosity and permeability measurements. Depending on the measured permeability, the constants a, b and c take different values for each set of samples. Therefore, a, b and c were recalculated at 20-times and 50-times magnification for this smaller set.
ANALYSIS AND DISCUSSION
Considering the heterogeneous character of most sedimentary rocks, the determination of permeability and porosity depends strongly on sample size and how well the sample reflects general volumetric and flow characteristics of the unit from which the sample came. Porosity determination also depends on the applied method, measurements using gas will detect the total free volume of the rock. But, the total volume of the rock is not full-filled with epoxy resin because of rock- resin wetting characteristics. Therefore porosity estimation by BSEI will not correspond to total volume, it will correspond to connected pore space reached by the epoxy resin.
The key for developing useful permeability models is finding the characteristics of pore space that control flow. Finding these characteristics is the only way to explain why samples with the same porosity have different values of permeability. Therefore, the permeability in this study is interpreted as defined by two primary characteristics: 1) The part of the porosity that contributes to flow and 2) The configuration of pore space. The first one is inferred as the fraction of the image which is occupied by pores, the pores filled with the epoxy resin used as contrast media for BSEI. The latter characteristic is described by both the adjustment parameters of the autocorrelation function and specific surface, and it is captured mainly from large area images (20 and 50 times magnification).
Analysis at 20-times magnification and 50-times magnification
The results at 50-times magnification (Tables 3, 4) includes the values of average pore size in µm2 and the percentage of microporosity, which corresponds to the fraction of porosity of pores from 11 µm2 to 100 µm2.
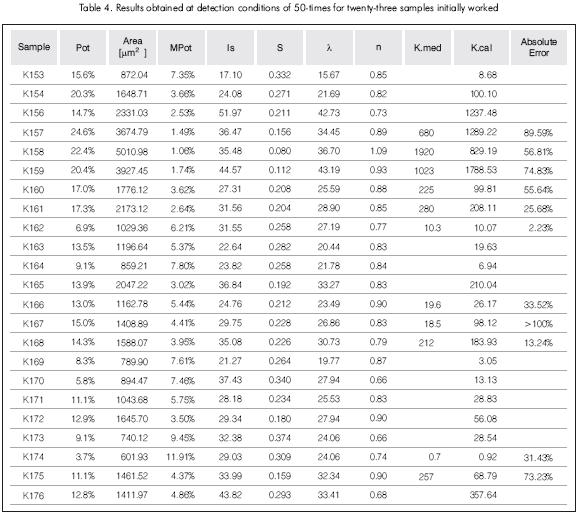
As expected, net porosity measured at 20-times magnification is lower than that detected at 50-times. This variance is due to the detection threshold at each magnification. Magnification at 20-times detects the large pores but misses some of the smaller pores that contribute to porosity. At increased magnification, the images detect more of the smaller pores. The differences in porosity are less evident in samples K157, K158 and K159, which differences in porosity are lower and which have the lowest microporosity value.
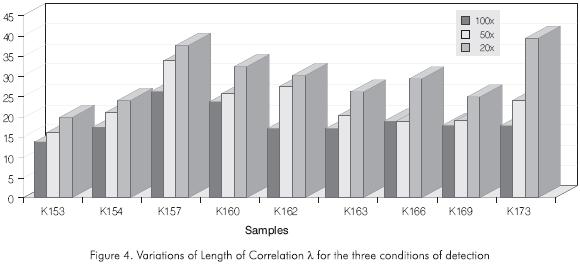
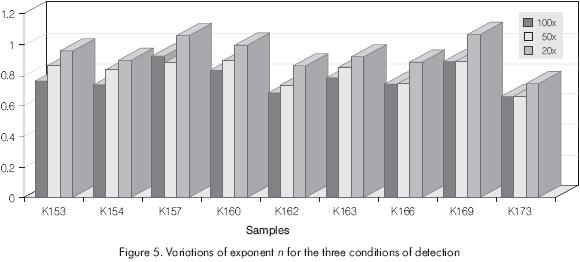
The length of correlation produces lower values at 50-times magnification, than those observed at 20-times. This result is because λ accounts for the predominant scale of the pores detected on the image. In general, pore space features are larger at 20-times than at 50-times magnification. The exponent n also got smaller values at 50-times, I have noticed that n accounts for micro-features of pore space. The more micro-features on the image the smaller the n value. The joint effect of the λ and n parameters is most evident in the integral Is and in the specific surface S.
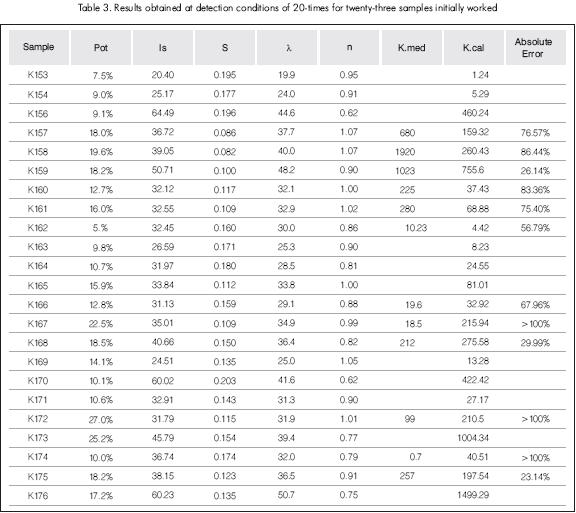
At the two condition of detection, the calculated permeability for the samples, where the actual values are known, does not behave in the same way. As an example, predicted permeability at 20-times for sample k157 is underestimated and at 50-times is overestimated, while predicted values for K168 behaves in opposite way. On the other hand the values obtained for permeability cover a range greater than the experimental range. The absolute error of estimated permeability at 20-times is greater than the absolute error of estimated permeability at 50-times (Tables 3, 4).
Analysis at 100-times magnification, 50-times magnification and 20-times magnification
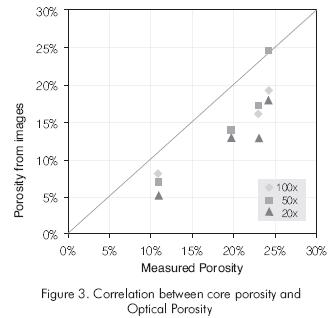
Not surprisingly, porosity measured by images at 100-times magnification is still lower than that measured with helium. Porosity values at 100-times and 50-times magnification in most of the samples, are similar because the process accounts for essentially the same area in both cases (Figure 3, Tables 5, 6, 7). The results demonstrate that differences due to detection threshold are minor where resolution is acceptable. The differences between porosity measured at 50-times and at 20-times are more relevant in K153, K154, and K157, which are samples having finer texture and, in K173, which includes rounded particles that affect large areas of the pore space Figure: 1-f.
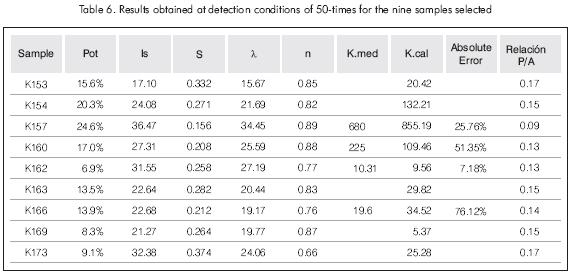
Parameters λ and n, measured for the nine samples studied at 20-times, 50-times and 100-times magnification, have values strongly dependent on image resolution (Tables 5, 6, 7, Figures 4, and 5). The length of correlation has the greatest relative variation, while the exponent has the smallest variation. However, the affect of the exponent on the autocorrelation function is evident from the analysis of the integral Is and the derivative or the specific surface S. These two statistical variables reflect the average behavior of the detected pore space (Figures 6 and 7). Sample K173 is different from the other because it includes rounded particles having dimensions of approximately one millimeter. These particles produces particular geometric characteristics like big porosity free zones, which are more notorious at low magnification. In spite of the other petrographic characteristics, such as grain size and clay type, are similar, the affect of the mentioned geometric feature strongly effects the autocorrelation function and consequently the calculation of permeability (Table 7).
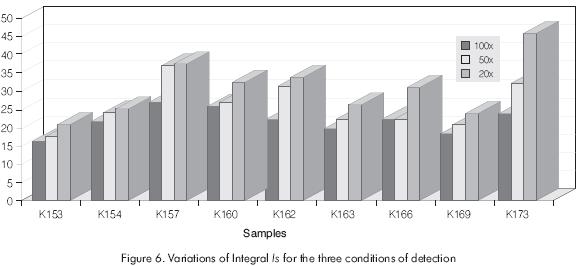
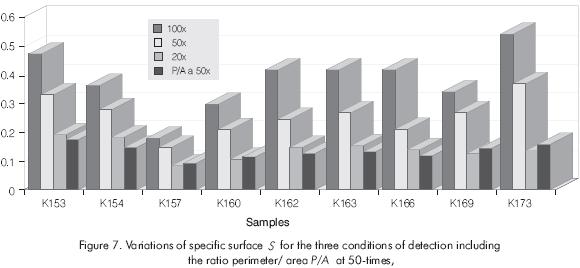
On the other hand, for the three different conditions of detection, the variation of Is in all the nine samples is in direct proportion with the resolution of the image. The larger the resolution the greater the integral (Figure 6). Likewise, S varies in direct proportion with the pixel size. With the purpose of figure out the physical meaning of the parameter S, the calculation of the average value of perimeter/area ratio was done. Perimeter and area were measured by counting pixels in the pores. It is worth mentioning that the specific surface area calculated with equation 4, and the average value of perimeter/area ratio has the same functional form, because they correspond to the same geometric concept. Additionally, the S value obtained at 2/50-times magnification is the one that coincides most closely with the value of this ratio (Figure 7). This result show that at 50-times magnification the pore space on the images is very well described by pixel counting.
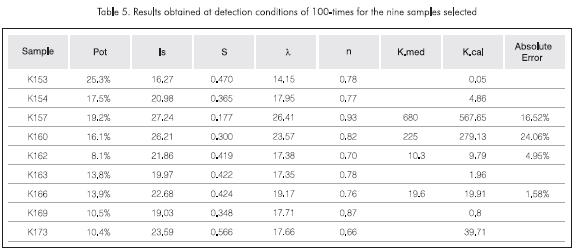
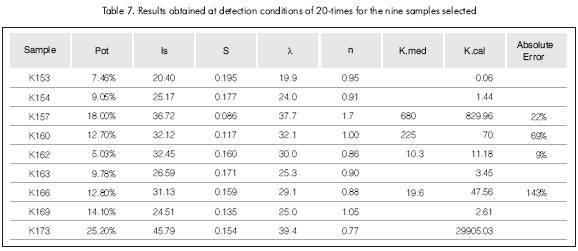
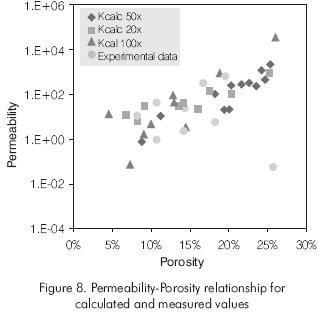
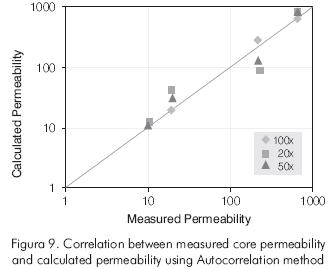
Permeability predicted from the nine samples studied at 20-times magnification shows a variable relationship to measured permeability. The primary reason for this variable relationship is due to decreasing the number of samples, which increases the probability of random error (Figure 8, 9). Permeability at 20-times magnification has greater random behavior when compare with the entire data set. Calculated permeability is beyond the measured range. The values covers six orders -of - magnitude, from 0.06 [mD] for sample K153, to 29 [D] for sample K173 (Table 7) and, the absolute error for the samples of known permeability reach up to 143% (sample K166). The range of variation in permeability prediction decreases, at 50-times magnification, and the absolute error for the known samples decreases in comparison to those acquired at 20-times magnification (Table 6). Also, at 50-times magnification the porosity-permeability relationship for calculated values covers the experimental range (Figure 8). At 100-times magnification, the absolute error falls between 24% and 1.6% and the range of variation covers the range of experimental measurements (Table 5).
CONCLUSIONS
-
The method published by Ioannidis et al., (1996) for the estimation of permeability requires selecting the appropriate detection conditions prior to acquisition. The conditions depend on the type of rock and its textural characteristics.
-
The same criteria used in the analysis of porosity using image processing should be considered in the selection of detection conditions. In our case the more precise permeability calculation was for 100-times, which means that in regard to permeability all the geometric features that affect pore space must be recorded on the images.
-
In the type of rocks used in this study, the presence of smectitic clay is responsible for the changes in specific surface and due to that, permeability calculation resulted sensible to image resolution.
-
The greatest precision in our ability to estimate permeability values occurred where samples have variable amount of microporosity as well as geometric features in different scales (i.e. specific surface). Therefore, making permeability prediction using porosity images requires taking into account all the geometric characteristics that affects both specific surface and influence the path of the fluid flow.
-
This method for estimating permeability averages the behavior of the pore space, over both the individual samples, and the set as a whole. The method therefore works, with a variable but acceptable margin of error, for the estimation of permeability, as long as the samples have similar petrographic characteristics.
ACKNOWLEDGEMENTS
This paper was made possible thanks to the confidence and technical and financial support that the GAM and GYA branches of ECOPETROL have deposited in the KEX division of the ICP. The author thanks the employees at the Basic Petrophysics Laboratory of the ICP and NUMERICA Ltda., who provided the data and the software, used for this
INTRODUCTION
research.
REFERENCES
Berryman, J.C., Blair, S.C., 1987. "Kozeny-Carman relationns and image processing methods for estimating Darcy's constant", J. Appl Phys, 62 (6) 2221 - 2228. [ Links ]
Coskun, S. B., Wardlaw, N. C., 1993. "Estimation of permeability from image analysis of reservoir sandstones" Jour. of Petrol. Scie. and Eng. 10. [ Links ]
Davies, D. K., Vessell, R. K. and Auman, J. B., 1999 "Improved Prediction of Reservoir Behavior Through Integration of Quantitative Geological and Petrophysical Data" SPE Reservoir Eval. & Eng. 2 (2) pg 149 - 160. [ Links ]
Davies, D. K., 1990. "Image Analysis of Reservoir Pore Systems: State of the Art in Solving Problems Related to Reservoir Quality". SPE 19407, 73 - 82. [ Links ]
Dewan, J. T., 1983. "Modern Open-Hole Log Interpretation". PennWell Books. Tulsa. Pp 230-235. [ Links ]
Ehrlich, R., Cobaleda, G. and Ferm, J. B., 1997. "Relationship between Petrographic Pore Types and Core Measurements in Sandstones of the Monserrate Formation, Upper Magdalena Valley, Colombia". Ciencia, Tecnologia y Futuro 1, 3, 5 -17. [ Links ]
Ehrlich, R., Crabtree, S. J., Horkowitz, K. O. and Horkowitz, J. P., 1991. "Petrography and reservoir Physics I: Objective Classification of Reservoir Porosity". AAPG Bull 75. 10. 1574 -1562. [ Links ]
Ehrlich, R., Kennedy, S. K., Cannon, R. L. and Crabtree, S. J., 1984. "Petrographic Image Analysis, I. Analysis of Reservoir Complexes" J. of Sed Pet. 54, 4: 1365-1378. [ Links ]
Gunter, G. W., Finneran, J. M., Hartmann, D. J. and Miller, J. D., 1997. "Early Determination of Reservoir Flow Units Using an Integrated Petrophysical Method" SPE 38679. [ Links ]
Ioannidis, M. A., Kwiecien, M. J. and Chatzis, I. F., 1996. "Statistical analysis of porous microstructure as a method for estimating reservoir permeability" Jour. Pet Sci & Eng 16: 251- 261. [ Links ]
Keehm, Y., Mukerji, T., Dvorkin, J., Prasad, M., Mavko, G. and Nur, A., 1999. "Permeability estimation by numerical flow simulation 3-d porous media extended from thin sections" Stanford Rock Physics Laboratory, Annual report. [ Links ]
Li-Ping, Y., 1990. "Pore Image Characterization and its Relationship to Permeability" SCA Conference paper number 90002. [ Links ]
Mavko, G., Nur, A., 1997. "The effect of a Percolation Threshold in the Kozeny - Carman relation". Geophysics 62 1480 - 1482. [ Links ]
Nadeau, P. H., Hurst, A., 1991. "Application of Back-Scattered Electron Microscopy to the Quantification of Clay Mineral Microscopy in Sandstone" Jour. of Sed. Petrology. 61. 6. 921- 925. [ Links ]
Nelson, P. H., 1995. "Permeability-Porosity Relationships in Sedimentary Rocks". U.S. Geological Survey, Denver Colorado. [ Links ]
Panda, M. N., Lake, L.W. , 1994. "Estimation of Single-Phase Permeability from Parameters of Particle size Distribution" AAPG Bulletin V 78. N° 7, p.1028-1039. [ Links ]
Prince, C. M., 1999. "Textural and Diagenetic Controls on Sandstone Permeability". Submitted to GCAGS Annual Mtg Sept 1999, Lafayette, LA. [ Links ]
Prince, C. M., Ehrlich, R. and Anguy, Y., 1995. "Analysis of Spatial order in Sandstones II: Grain Clusters, Packing Flaws, and the Small-Scale Structure of Sandstones". Jour. of Sed. Research. A65. 1. 13-28. [ Links ]
Shouxiang, M., Morrow, N. R., 1996. "Relationships Between Porosity and Permeability for Porous Rocks" SCA Conference paper Number 9610. [ Links ]
Swamsom, B. F., 1981. "A Simple Correlation Between permeabilities and Mercury Capillary Pressure". J. Pet Tech 2488 - 2504. [ Links ]
Thomeer, J., 1960. "Introduction of a Pore Geometrical Factor Defined by the Capillary Pressure Curve". Shell Development Co.T.N. 2057. [ Links ]

