


Services on Demand
Journal
Article
 English (pdf)
 Article in xml format
 Article references
 Send this article by e-mail
Indicators
-
 Cited by SciELO
 -
 Access statistics
Related links
-
 Cited by Google
 -
 Similars in
SciELO
Similars in
SciELO -
 Similars in Google
Share

 Permalink
CT&F - Ciencia, Tecnología y Futuro
Print version ISSN 0122-5383On-line version ISSN 2382-4581
C.T.F Cienc. Tecnol. Futuro vol.2 no.2 Bucaramanga Jan./Dec. 2001
2*Ecopetrol - Instituto Colombiano del Petróleo, A.A. 4185 Bucaramanga, Santander, Colombia
ABSTRACT
Large amounts of oil reserves are contained in naturally fractured reservoirs. Most of these hydrocarbon volumes have been left behind because of the poor knowledge and/or description methodology of those reservoirs. This lack of knowledge has lead to the nonexistence of good quantitative models for this complicated type of reservoirs. The complexity of naturally fractured reservoirs causes the need for integration of all existing information at all scales (drilling, well logging, seismic, well testing, etc.) to provide a reservoir description for such reservoirs. This paper presents an overview of recent advances in naturally fractured reservoir modeling, which were developed to characterize the dual porosity system and to improve hydrocarbon recovery. Two techniques, material balance and numerical simulation, are shown to be supportive of one another. The material balance technique is a good tool for history matching of production performance and defining the system, which is then used as input in the numerical model. However, material balance has significant disadvantages when it comes to prediction, which is the domain of numerical simulation modeling. We present the application of a recently introduced material balance equation based on a dual-system approach. In numerical simulation, the mathematical model to predict fluid flow in anisotropic media is enhanced by using permeability tensors. We also discuss a technique to construct permeability tensors from seismic, well log and well test analysis.
Keywords: naturally fractured reservoirs, MBE, permeability tensor.
RESUMEN
Existen considerables reservas de hidrocarburos que están contenidas en yacimientos naturalmente fracturados. La extracción de la mayoría de estos volúmenes han sido abandonadas debido al pobre conocimiento y/o metodología de descripción de estos depósitos de hidrocarburos. Esta falta de conocimiento ha conllevado a la carencia de buenos modelos cuantitativos usados en simuladores numéricos para este tipo no-convencional de yacimientos. Debido a la complejidad de los yacimientos naturalmente fracturados se hace necesario la integración de toda la información de diferentes fuentes (perforación, registros de pozo, sísmica, pruebas de presión, etc) para dar una descripción integral del mismo. Este artículo presenta un resumen de los recientes avances en el modelamiento de los yacimientos naturalmente fracturados, los cuales fueron desarrollados para caracterizar el sistema de doble porosidad y para mejorar el recobro de hidrocarburos. Dos técnicas: la de balance de materiales y la simulación numérica, son mostradas como soporte una de la otra. La técnica de balance de materiales es una buena herramienta para el ajuste histórico del comportamiento de la producción y para definir el sistema, el cual es usado como dato de entrada en el modelo numérico. Sin embargo, el balance de materiales tiene significativas desventajas cuando se realizan predicciones, ya que este es el dominio del modelo de simulación numérica. Además se presenta la aplicación de la ecuación de balance de materiales que tiene en cuenta un sistema dual. En cuanto a la simulación numérica, el modelo matemático que predice el flujo de fluidos en un medio anisotrópico, es mejorado en el presente artículo usando tensor de permeabilidad. Se discute una técnica para construir el tensor de permeabilidad a partir de datos sísmicos, registro de pozos y análisis de prueba de presión.
Palabras clave: yacimientos naturalmente fracturados, MBE, tensor de permeabilidad.
INTRODUCTION
A naturally fractured reservoir is a hydrocarbon-bearing formation that contains fractures (planar discontinuities) created by nature, due to diastrophism (folding and faulting) and volume shrinkage (Aguilera, 1980), distributed as a consistent network of various degrees of fracturing throughout the reservoir (Chilingarian, et al, 1996).
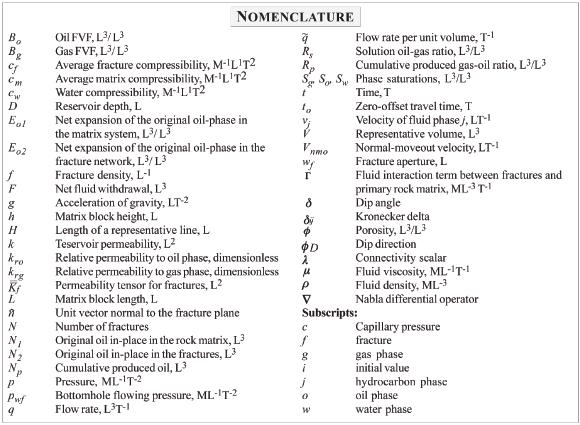
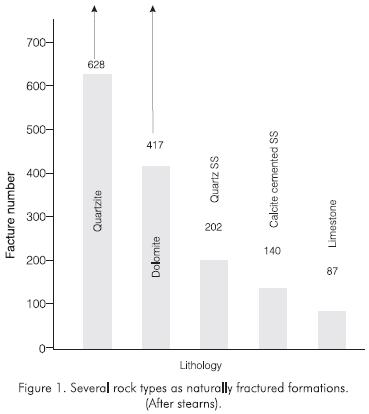
Important fractured reservoirs may be found in cherts, shales, limestones, siltstones, sandstones, igneous. andmetamorphic rocks (Aguilera, 1980). Figure 1 shows the average fracture number for several common rock types naturally deformed in the same physical environment (Steams, 1967; Steams and Friedman, 1972). Since fractures are more effective in low matrix permeability reservoirs such as carbonates; limestone and dolomite formations are usually thought as truly naturally fractured reservoirs.
Geologic aspects of naturally fractured formations
The void space between grains of the rock matrix occupied by fluids is called porosity. There are two types of porosities. The porosity associated with the process of deposition of sediments that forms the rock matrix is called primary porosity. In contrast, secondary porosity, called induced porosity, is associated with the presence of fractures and other openings such as vugs and joints caused by geological and chemical processes (Aguilera, 1988).
The determination, modeling and handling of secondary porosity have historically been of great difficulty for all researchers. Part of this complication is because secondary porosity is a strong scale-dependent property. This means that its magnitude is dependent on the volume of rock sample taken for its determination. However, it is well known that the uniqueness, complexity, and scale-dependent characteristics of this type of reservoir require several other parameters, such as fracture orientation, width, length and intensity, in order to fully characterize the system.
Natural fractures, which are part of the secondary porosity, can be classified as tectonic, regional, and diagenetic (Aguilera, 1988).
Fluid flow capacity evaluation
Reservoir capacity and future performance can be studied through a combined use of material balance, pressure transient analysis, declines curves, and numerical reservoir simulation.
Material balance equation (MBE)
An equation for improved modeling naturally fractured reservoirs by considering the compressibility difference between fractured and matrix systems was recently proposed (Zemanek et al, 1969). This equation allows the reservoir engineer to estimate of original oil in-place both in the matrix and in the fracture system simulatneuosly. This approach will help reservoir and production engineers to decide on exploitation strategies for these complex reservoirs.
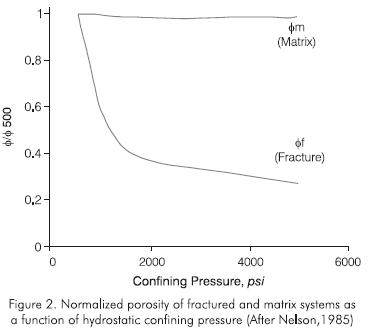
One of the basic assumptions of conventional MBE is that rock properties, such as porosity and compressibility, are uniform throughout the reservoir. For dual-porosity media, as encountered in some naturally fractured reservoirs (NFR), this assumption is no longer valid. Fracture and matrix porosity values exhibit different behavior with pressure since fractures are highly compressible compared to the matrix (Figure 2).
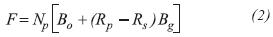
This compressibility difference may be used to determine the quatities of hydrocarbon by a material balance calculation. It was shown that the general form of the MBE for NFR is (Nelson, 1985):
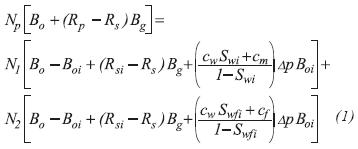
Where N1 is the original oil in-place in the rock matrix and N2 is the original oil in-place in the fractures, Np is the cumulative produced oil and R is the cumulative produced gas-oil ratio, cm is the average matrix compressibility and Cf the average fracture compressibility. Definitions of the remaining variables are given in the nomenclature.
Graphical solution of the material balance equation
A useful solution method of the MBE was presented by Havalena and Odeh (1963). This method, known as the straight-line method, consists of rearranging the MBE to obtain variable groups that are plotted to result in a straight line.
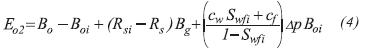
If the following variables are defined:
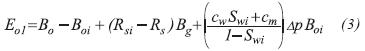
Equation 1 can be expressed in compact form:

Where Eo1 represents the net expansion of the original oil-phase in the matrix system and Eo2 is the net expansion of the original oil-phase in the fracture network.
Diagnostic plots can be constructed as Havalena and Odeh (1963) proposed, and the rearranged MBE can be written as follows:
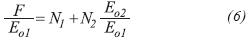
Therefore, a plot of  should result in a straight line with slope N2 and γ-intercept N1. Such a diagnostic plot is presented in Figure 3.
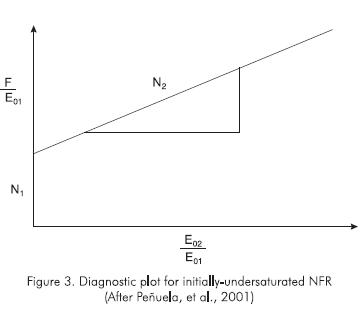
The significance of this approach is that through a simple plot with production data, a rapid estimate of fracture porosity could be obtained. Note that the ratio of N2/N1 is directly proportional to the porosity ratios, and therefore, from the known laboratory values of matrix porosity, an estimate of average fracture porosity would be available. Similarly, volumetric estimates of initial hydrocarbons in numerical simulation could be compared with those obtained from the MBE. However, because of some limitations of the MBE, including efficient mass transfer and no fluid segregation, reservoir engineer should be careful in its use.
Numerical reservoir simulation
Numerical modeling is the most important reservoir engineering tool available for evaluating reservoir capacity and future performance of naturally fractured reservoirs. Aguilera (1998) discusses some of the most significant models available in the literature.
Commonly, fracture and matrix systems are modeled with a single partial differential equation (governing equation), convenient initial and boundary conditions and appropriate auxiliary equations. The governing equation regularly simulates fluid flow through either the fracture system (Aguilera, 1980; Lefebvre and Bossie, 1975), through an equivalent fracture-matrix system, or through fracture and matrix systems (Warrent and Root, 1963; Kazemi, et al., 1976).
The mathematical model proposed by Evans (1982) describes the behavior of naturally fractured reservoirs by using two sets of partial differential equations. One set of equations models multiphase fluid flow through the primary rock matrix, and the other simulates flow through the fracture network.
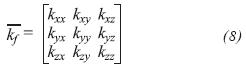
The diffusivity equation that describes oil phase flow through the fracture system is given by the following expression:
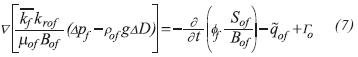
Where the fracture permeability tensor is given by:
Permeability tensor of fractured media
Oda (1985) presented a statistical approach to describe the elastic deformation and flow behavior of fluids in a fractured medium. In that approach permeability anisotropy is related to fracture geometry through tensors according to the mathematical expression given by Snow (1969).
Peñuela (2000) developed a method wherein fracture orientation is used to construct the permeability tensor in a deterministic manner. A mathematical model of parallel plates (Snow, 1969) was employed to derive an expression that can be evaluated if appropriate data from seismic, well log and well testing are available (Avila et al., 2000).
The permeability tensor can be expressed as:
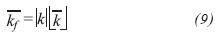
Derivation of Equation 9 is available elsewhere (Avila et al., 2000). Equation 9 states that the permeability tensor for fracture media, called Snow tensor, is composed of two parts. The directional permeability tensor  accounts solely for the directionality in the fluid flow due to the existence of a fracture (or set of fractures) in the medium. The permeability scalar
  accounts for the total resistant to fluid flow of fractures in porous media.
Directional permeability tensor
The directional permeability tensor is defined in a compact form as:
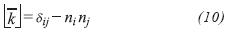
Where i and j stand for the orthogonal reference axes x, y, and z; ij is the Kronecker delta, and ni is the component of the unit vector normal to the fracture plane,  , projected to the axis i (Figure 4).
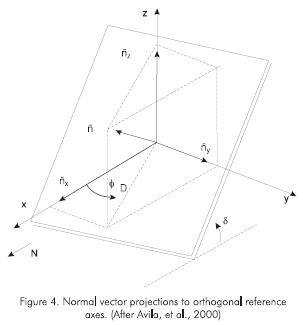
Normal vector components are defined by:
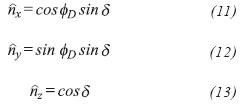
where øD is the dip direction of the fracture plane, defined as the angle measured from the x-axis to the projection of the unit normal vector in the x-y plane, and δ is the dip angle of the fracture, measured from the x-y plane to the fracture plane. According to these definitions, fracture strike is perpendicular to dip direction. In this particular application, the x-axis was aligned in direction of north.
Permeability scalar
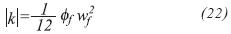
The permeability scalar can be defined as:
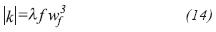
Where wƒ is the fracture aperture, measured as the average distance between matrix blocks. The dimensionless constant λ varies from 0 to 1/12, approaching the upper limiting value, 1/12, as the fracture system behaves more like parallel plate conduits, and the lower limiting value, 0, when there are no flow conduits in the system (closed fractures) as shown by Oda (1985).
The fracture density (or frequency),ƒ is defined by:
Where N represents the number of fractures existing in a sample volume, and H is the length of a representative line length (Figure 5).
The final result (Equation 14) will be a permeability tensor that can be used for fluid flow modeling in a reservoir simulator developed according to Evans' formulation in a grid-by-grid basis.
Subtituting Equation 15 into Equation 14 for a case of an infinite smooth fracture in a homogenous rock matrix, yields the following expression is for the permeability scalar:
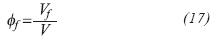
Consider a model composed of a representative volume, equivalent to a "grid-block" in numerical simulation that contains a set of N fractures that are vertical, parallel and open. By the expression open, we assume that fractures have not undergone any crystallization processes that produce negative effects in fluid flow (Havlena and Odeh, 1963). However, a partial crystallization is required to keep the fracture open in the presence of in-situ stresses. In this representative volume, fractures also have a uniform fracture aperture that can be quantified by an average value.
If we consider a single a fracture the in representative volume (Figure 5), we can define fracture porosity as the relative volume occupied by the fracture with respect to the sample volume:
Where Vƒ is the volume of the fracture and V is the bulk volume, defined respectively as:
and
For equally-distributed fractures, the fracture frequency H* is given by:
Substituting Equation 18 through Equation 20 into Equation 17, yields:
By incorporating Equation 21 into Equation 16, we can write the fracture permeability scalar can be written as a function of fracture porosity:
Using a parallel plate model (Murray, 1968) also presented an expression for fracture permeability as a function of porosity in fractures with triangular crosssectional area. Moreover, he showed that, under certain conditions, fracture porosity is related to the structural second derivative as follows:
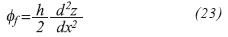
Where z is measured in the vertical direction and x-z plane is perpedicular to the layer surface. Substitution of Equation 23 into Equation 22 yields:
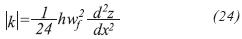
The coefficient 1/24 this equation can be replaced by a variable that ranges from 0 to 1/24. The lower limit represents fractures either totally crystallized or isolated, while the upper limit represents the case where ideal conditions prevail: in parallel, smooth, and interconected fractures.
Well test analysis
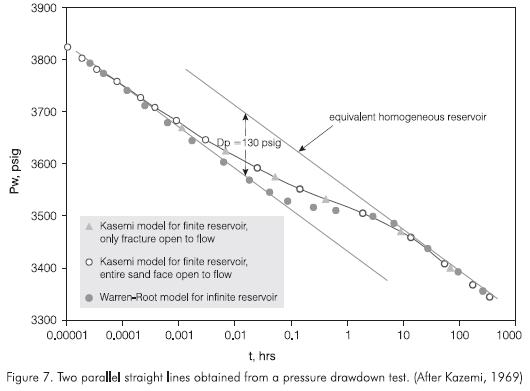
Some of parameters required to evaluate Equation 24 can be obtained from pressure transient tests. Since all naturally fractured reservoirs are not the same, several techniques have been developed and analized with field data. Reservoir models proposed by Pollard (1959), Pirson and Pirson (1961), Warren and Root (1963), Kazemi (1969), and De Swaan (1976) are the basis for single-well test analysis, such as those presented by Cinco Ley and Samaniego-V (1981), and Gringarten (1984). Multi-well test (pressure interference) analysis is used to determine fracture orientation based on methods proposed by Elkins and Skov (1960), and Kazemi et al, 1969.
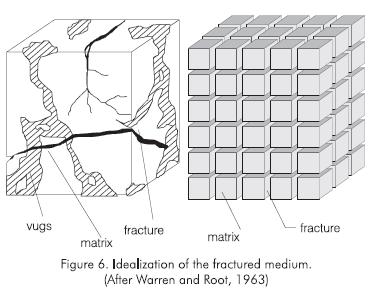
The most representative its physical approach and proposed solution is the Warren and Root method (Warren and Root,1963). This method uses a simplified representation of a fractured reservoir by idealized systems, in which single matrix blocks are identical regular parallelepipeds separated by an orthogonal network of fractures (Figure 6). Flow toward the wellbore is considered to occur only in the fractured system, whereas the expanded fluid contained in the single matrix block will feed the fractured system.
Kazemi's and Warren and Root's methods yield similar results both for pressure buildup and drawdown tests. Figure 7 shows the typical two parallel straight lines obtained for the pressure drawdown case.
Seismic data
Another source of information is given by seismic data interpretation. Sound waves are influenced by details of fracturing while traveling across fracture media. Attend seismic characteristics may be used to detect fractured zones, and fracture intensity, and to estimate fracture direction. Most of the time qualitatively information is obtained from seismic data depending on the type of data set that are available. In the following, techniques to quantitatively estimate fracture orientation. review. They may be divided into P-wave, P-S converted wave, and S-wave studies of multicomponent seismic data analysis (Pérez et al, 1999).
P-wave data interpretation
Compressional wave data are the most commonly acquired seismic data. Information about the P-wave velocity vp of rock beds detected by seismic surveys is importantfor two main reasons. First, it is essential for the conversion of seismic wave travel times into depth to obtain structural imaging of the subsurface. Second, it provides an indication of the lithology of a rock or, in some cases, the nature of the pore fluids contained within it (Kearey and Brooks, 1984). Compared to shear wave recording, P-wave recording is less costly and more robust (Li and Muller, 1997).
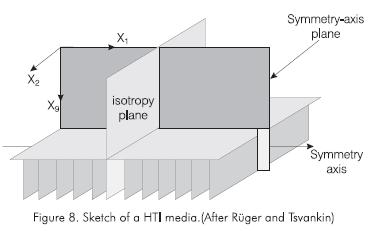
However, anisotropy in P-wave data often small and difficult to detect. Rüger and Tsvankin (1997) discussed the influence of azimuthal anisotropy on .P-wave propagation using a transversly isotropic model with a horizontal axis of symmetry (HTI medium). Atypical HTI model is a homogeneous isotropic matrix with aligned vertical fractures embedded in it (Figure 8). Two vertical symmetry planes can be identified. The symmetry-axis plane is a vertical plane that perpendicularly intersects the crack set, and therefore, it is parallel to the fracture orientation. The isotropy plane is normal to the fracture strike.
P-wave propagation in the vertical plane containing the symmetry axis is illustrated in Figure 9. The continuos white line marks the point of equal P-wave travel-time on the seismic rays (wavefront), while the dashed white circle represents the reference isotropic wave front. The continuous white wavefront falls behind the corresponding isotropic (dashed) wavefront as the ray deviates from vertical, indicating that the P-wave velocity near vertical decreases with angle. Consequently, the isotropic wavefront travels faster than the anisotropic in the horizontal direction.
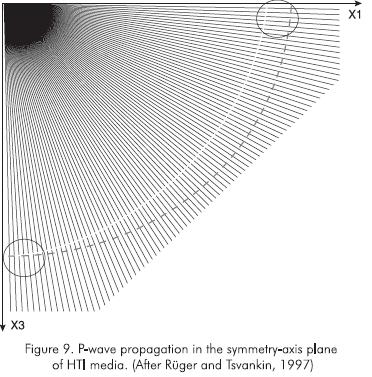
In contrast, waves confined to the isotropic plane do not experience any angular velocity variation. For all other vertical planes, as seen in the symmetry-axis plane, velocity does change with angle from vertical as well as with azimuth.
The anisotropic behavior of P-waves has been need in two techniques to estimate fracture orientation, the amplitude-variation-with-offset (AVO) response of P-waves can be by the presence of fractures depending on the relative orientation of the fractures and the recording line. Another technique based on P-wave recordings is normal-moveout (NMO) analysis of multiazimuth P-wave data.
Fracture orientation using AVO analysis.
AVO analysis is based on the variation of reflection and transmission coefficients with incidence angle and corresponding increasing offset (Castagna, 1993). However, because conventional AVO analysis is based on analytic expressions for P-wave reflection coefficients in isotropic media, the AVO technique needs to be modified if anisotropy is present on either side of the reflecting boundary (Ruger, 1997).
If a source-receiver line is placed parallel to fracture orientation, the fractures will have minimal influence on the reflection properties, despite of the angle of incidence. This is because the P-wave particle movement will always be parallel to the thin fractures. However, if the line is oriented oblique to the fracture, at large angles of incidence, the reflection coefficients will change strongly. At large angles of incidence, the P-wave velocity is expected to be influenced by the acoustic properties of the fluid filling the fractures when the wave propagation is perpendicular to the fractures, while it is less influenced when wave propagation is parallel to the fractures.
If no azimuthal anisotropy exist, the AVO response will be the same in all directions, while in the presence of anisotropy the AVO response will vary depending on the source-receiver azimuth.
In a field case (Pérez et al, 1999). AVO analysis was performed for each shot lines, and the AVO gradient and intercept were obtained. An AVO anomaly with high positive gradients for the lines perpendicular to the fractures was found for the base of the fractured formation. This AVO anomaly is not present in lines parallel to the fracture orientation.
From model studies, this difference increases with the increase in gas content in the fluid filling the fracture is also larger. The azimuthal difference in AVO gradient can be explained by a low vp/vs for the lines perpendicular to the fracture caused by the influence of the filling fluid in the fractures, resulting in a high positive contrast in Poison's ratio with the lower layer, and a strong positive AVO gradient anomaly.
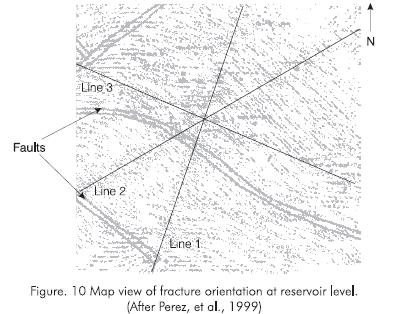
Pérez et al, (1999) presented the results of AVO analysis of 2-D and 3-D P-wave field data. They found that conclusions from the AVO analysis are consistent with the results obtained in a previous study with the same field data using P-S converted waves. Figure 10 shows a map view of the fracture orientation obtained from the P-S data validated through AVO analysis.
Fracture orientation using NMO analysis.
Azimuthal NMO velocity analysis is now often used in industry to identify fracture orientation (Li, 1999).
NMO at an offset distance x is the difference in travel time ΔT between reflected arrivals at x and zero offset (Figure 11).
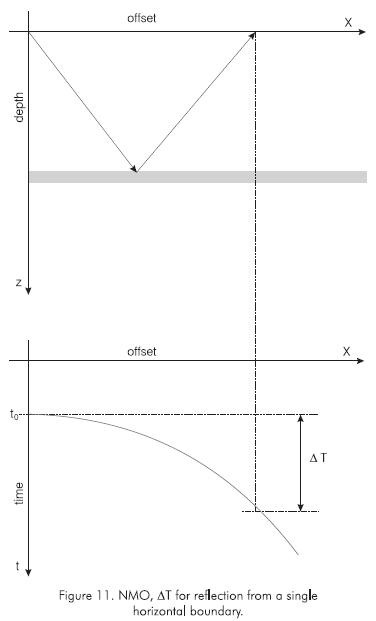
For the simple case of a single horizontal boundary between two isotropic layers, the reflection time can be approximated by the hyperbolic equation (Kearey and Brooks, 1984; Grechka and Tsvankin, 1999):
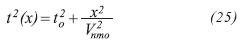
Where x is the source-receiver offset, t0 is the zero-offset traveltime, and Vnmo is the normal-moveout velocity.
For this simple case, NMO is given approximated by:
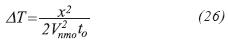
Equation 26 can be used to calculate Vnmo from NMO. The magnitude of Vnmo should be theoretically the same regardless of the azimuth, therefore a plot of Vnmo as function of azimuth should give a circle.
However, for anisotropic medium, azimuthal variations of Vnmo for pure (nonconverted) modes are described by an ellipse in the horizontal plane. Therefore, Equation 25 is written as (Grechka and Tsvankin, 1999):
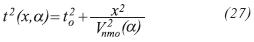
Where α is the azimuth of the common-midpoint line.
The fracture orientation is estimated from NMO analysis by fitting the best horizontal ellipse of the NMO velocities for all azimuths.
The mayor axis that corresponds to the maximum NMO velocity, is expected to coincide with fracture strike.
Pérez et al, (1999) presented results of 2-D and 3-D NMO analysis. They found that 2-D results agree with PS converted waves and AVO analyses, but the NMO ellipticity analysis of 3-D data produced results different from those produced by other methods. Some reasons given for such differences include near-surface azimuthal anisotropy and complications caused by overburden effects that could not be removed.
Interpretation of P-S converted wave data
The rotational analysis of P-S converted waves is an alternative method that has several advantages over those method previously mentioned. P-S waves are believed to contain the same information as shear waves by using compressional sources and therefore, their acquisition is less expensive.
S-waves produced by P-wave conversion at an azimuthal anisotropic interface undergo the same birefringence phenomenon that S-waves experience (Atta and Michelena, 1995). Rüger (1997) stated that a plane P-wave, incident on an HTI medium outside the symmetry-axis and isotropic plane, generates three plane waves with mutually orthogonal polarization directions in the lower medium:
-
A P-wave polarized along its propagation direction.
-
A shear wave polarized within the isotropy plane (parallel to fracture strike), referred as S"-wave, which propagates at the velocity of the unfractured rock (fast mode).
-
A shear wave polarized in the plane formed by the slowness vector and the symmetry axis (perpendicular to fracture strike), called the S -wave, which propagates at the velocity of the fractured rock (the slow mode in the vertical direction).
Data analysis is based on surface recording of reflected S" and S⊥-waves.
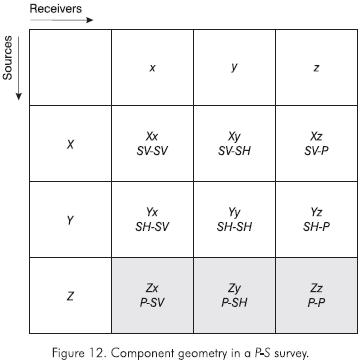
P-S converted wave survey consists of one vertical component source, as in conventional P-wave surveys, and three-component receivers to yield three distinct observations (vertical, radial and transverse). Figure 12 illustrates such components as a function of source-receiver polarization. The shaded area is the three-component geometry in a P-S survey.
After the three observations are acquired, data are processed as usual. The processing scheme, designed to preserve relative amplitude, maximizes frequency band, and optimizes the velocity and static solutions for all components.
Then, a rotational analysis is performed with the two components available (Zx and Zy). This step determines the angle that aligns observed data with the principal axes of symmetry and maximizes traveltime differences between S" and S⊥-waves. Fracture orientation is obtained by adding this angle to the azimuth angle of the reference line.
Cross-correlation and energy ratio between S" and S⊥-waves have been suggested as diagnostics to check the validity of the rotational angle (Atta and Michelena, 1995).
Finally, an anisotropy analysis is performed by comparing traveltimes and amplitudes of the rotated data. Traveltime differences are a low-resolution measure of anisotropy, while their relative amplitude differences are a high-resolution measure of local anisotropy caused by a fracture system. In thin layers, amplitude variations may be the only diagnostic of highly fractured rocks.
S-wave data interpretation
Shear wave studies take into account the effect of splitting experienced by a shear wave that propagates through an anisotropic medium (Li and Muller, 1997). Even though multicomponent surveys have been verified to be effective in delineating fracture dip direction, high acquisition and processing cost, limited availability of S-wave sources, and volume/quality of S-waves restrict their applicability.
A full multicomponent survey consists of three sources (vertical, inline, and crossline) and three receivers (vertical, radial and transverse) which yield nine different observations.
In Figure 13, the shaded area is the geometry for four-component S-wave data recording.
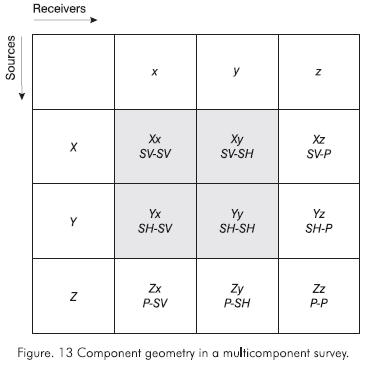
S-wave data processing is very similar to P-S converted wave data evaluation. The purpose of processing multicomponent shear wave data is to preserve and recover the three major attributes (polarization, time delay, and reflectivity). Then, a rotation algorithm ((Atta and Michelena, 1995) that numerically rotates the source and receiver axes is applied to minimize the energy in the off-diagonal elements (Xy and Yx components). Rotated S" and S⊥-waves data are analyzed as much as in P-S survey analysis.
Discussion and summary
-
Naturally fractured reservoirs are complex hydrocarbon accumulations where no single tool or discipline can provide of all the information needed for their full description. A detailed reservoir characterization is accomplished by the integration of geological, geophysical, petrophysical, drilling and reservoir simulation concepts.
-
Traditional techniques such well test analysis and well logging interpretation are still very useful. Combination of old concepts with new technology make data analysis a science.
-
Material balance techniques provide independent values of initial hydrocarbon volumes that may be use to calibrate volumetric estimates performed by reservoir simulators. The MBE that takes into account the compressibility differences between media further improves reservoir modeling by giving reservoir and production engineers simultaneous estimates of hydrocarbons in-place.
-
Emerging techniques based on seismic data can be used in estimation of important reservoir parameters such as the fracture permeability tensor by providing the orientation of the fracture trend. Once the orientation is available directional permeability is computed. Finally, the permeability tensor is estimated by history match of well test data. However, the non-uniqueness of seismic responses make data analysis almost an art.
-
A successful reservoir characterization and numerical simulation will maximize recovery by improving strategies of production, minimizing drilling of unnecessary wells, improving prediction of future reservoir performance, designing EOR projects, among others factors.
ACKNOWLEDGMENTS
The authors gratefully acknowledge the financial support from the Empresa Colombiana de Petróleos -Instituto Colombiano del Petróleo (ECOPETROL-ICP) during the course of this work.
REFERENCES
Aguilera, R., "Naturally Fractured Reservoirs". PennWell Publishing Company (First Edition). [ Links ]
Aguilera, R., 1998. "Geologic Aspects of Naturally Fractured Reservoirs," The Leading Edge, 17(12):1667 -1670. [ Links ]
Atta, E., and Michelena, R. J, 1995. "Mapping Distribution of Fractures in a Reservoir with P-S Converted Waves," The Leading Edge, 12: 664-76. [ Links ]
Avila, R., Peñuela, G. and Gupta, A., 2000. "An Integrated Approach to the Determination of Permeability Tensors for Naturally Fractured Reservoirs," paper 2000-47 selected for presentation at the Canadian International Petroleum Conference of the Petroleum Society in Calgary, 4 - 8 June. [ Links ]
Chilingarian, G.V., Mazzullo, S.J. and Rieke, H.H., 1996. "Carbonate Reservoir Characterization: A Geologic -Engineering Analysis, Part II". Elsevier Science B. [ Links ]
Cinco Ley, H., and Samaniego V, F, 1981. "Transient Pressure Analysis for Fractured Wells," JPT. Sep., 1749 - 66. [ Links ]
Castagna, J. P., 1993. "AVO Analysis-Tutorial and Review: in Offset-Dependent Reflectivity". Theory and Practice of AVO Analysis, 8-36. [ Links ]
De Swaan, A.O., 1976. "Analytic Solutions for Determining Naturally Fractured Reservoir Properties by Well Testing," SPEJ. June., 117-22. [ Links ]
Elkin, L.F., and Skov, A.M., 1960. "Determination of Fracture Orientation from Pressure Interference," Trans. AIME 219., 301-304. [ Links ]
Evans, R.D., 1982. "A Proposed Model for Multiphase Flow Through Naturally Fractured Reservoirs," SPEJ Oct., 669 -80. [ Links ]
Grechka, V., and Tsvankin, I., 1999. "3D Moveout Inversion in Azimuthally Anisotropic Media with Lateral Velocity Variation, Theory and Case Study". Geophysics, 64 (4): 1202-18. [ Links ]
Gringarten, A.C., 1984. "Interpretation of Tests in Fissured and Multilayered Reservoirs with Double-Porosity Behavior: Theory and Practice," JPT. April., 549-64. [ Links ]
Havlena, D., and Odeh, A.S., 1963. "The Material Balance as an Equation of a Straight-Line". JPT, Aug. 896-900, Trans. AIME 228. [ Links ]
Kazemi, H. et al, 1976. "Numerical Simulation of Water-Oil Flow in Naturally Fractured Reservoirs," paper SPE 5719 presented at the 4th Simposium of Numerical Simulation of Reservoir Performance, SPE of AIME, Los Angeles, Feb. [ Links ]
Kazemi, H., 1969. "Pressure Transient Analysis of Naturally Fractured Reservoirs with Uniform Fractured Distribution," SPEJ. Dec, 451-62. [ Links ]
Kazemi, H., Seth, M.S. and Thomas, G.W., 1969. "The Interpretation of Interference Tests in Naturally Fractured Reservoirs with Uniform Fracture Distribution," SPEJ. Dec, 463-72. [ Links ]
Kearey, P., and Brooks, M., 1984. "An Introduction to Geophysical Exploration. Geoscience texts, volume 4. Blackwell Scientific Publications. [ Links ]
Lefebvre du Prev, E.J. and Bossie-Codreanu, D.N. 1975., "Simulation Numerique de L'Exploitation des Reservoirs Fissures", Proceedings 9th World Petroleum Congress, Tokyo, panel discussion, 13 (5). [ Links ]
Li, X-Y., and Muller, M. C., 1997. "Carbonate Seismology. Chapter 14: Case Studies of Multicomponent Seismic Data for Fracture Characterization: Austin Chalk Examples". [ Links ]
Li, X-Y., 1999. "Fracture Detection using Azimuthal Variation of P-Wave Moveout from Orthogonal Seismic Survey Lines". Geophysics, 64 (4): 1193 -1201. [ Links ]
Murray, G.H., JR., 1968. "Quantitative Fracture Study -Sanish Pool, McKenzie County, North Dakota," Bulletin. AAPG, 52, Jan., 57-65. [ Links ]
Nelson, R.A., 1985. "Geologic Analysis of Naturally Fractured Reservoirs". Gulf Publishing Company, Houston. [ Links ]
Oda, M., 1985. "Permeability Tensor for Discontinuous Rock Masses," Geotechnique, 35:483 - 95. [ Links ]
Peñuela, G., Idrobo, A., Ordonez, A., Medina, C. and Meza, N., 2001. "A New Material-Balance Equationfor Naturally Fractured Reservoirs Using a Dual-System Approach", paper SPE 68831 Western Regional Meeting held in Bakersfield, California, 26 - 30 March. [ Links ]
Peñuela, G., 2000. "Unit Permeability Tensor in Fractured Media from Seismic Data," special project report, Seismic Reservoir Modeling Course, U. of Oklahoma. [ Links ]
Pirson, RS., and Pirson, S.J., 1961. "An Extension of the Pollard Analysis Method of Well Pressure Buildup and Drawdown Tests," paper SPE 101 presented at the 36th Annual Meeting of the SPE of AIME, Dallas. Oct. [ Links ]
Pollard, T., 1959. "Evaluation of Acid Treatment from Pressure Buildup Analysis," Trans. AIME 216: 38-43. [ Links ]
Pérez, M., Gibson, R. and Töksoz, N, 1999. "Detection of Fracture Orientation from Azimuthal Variation of P-wave AVO Responses". Geophysics, 64 (4): 1253-65. [ Links ]
Pérez, M., Grechka, V. and Michelena R., 1999. "Fracture Detection in a Carbonate Reservoir using a Variety of Seismic Methods". Geophysics, 64 (4): 1266-76. [ Links ]
Rüger, A., and Tsvankin, I., 1997. "Using AVO for Fracture Detection: Analytic Basis and Practical Solutions". The Leading Edge, 16: 1429-1434. [ Links ]
Rüger, A., 1997. "P-wave Reflection Coefficients for Transversely Isotropic Models with Vertical and Horizontal Axis of Symmetry". Geophysics, 62 (3): 713-22. [ Links ]
Snow, D.T., 1969. "Anisotropic Permeability of Fracture Media," Water Resources Research., 5 (6): 1273-89. [ Links ]
Stearns, D.W., 1967. "Certain Aspects of Fractures in Naturally Deformed Rocks," NSF Advanced Science Seminar in Rock Mechanics. R.E. Riccker ed. Bedford, Massachusets, 97-118. [ Links ]
Stearns, D.W. and Friedman, M., 1972. "Reservoirs in Fractured Rocks". AAPG Memoir, 82-106. [ Links ]
Warren, J.E. and Root, P. J., 1963. "The Behavior of Naturally Fractured Reservoirs," SPEJ Sep., 245-55. [ Links ]

