


Services on Demand
Journal
Article
 English (pdf)
 Article in xml format
 Article references
 Send this article by e-mail
Indicators
-
 Cited by SciELO
 -
 Access statistics
Related links
-
 Cited by Google
 -
 Similars in
SciELO
Similars in
SciELO -
 Similars in Google
Share

 Permalink
CT&F - Ciencia, Tecnología y Futuro
Print version ISSN 0122-5383On-line version ISSN 2382-4581
C.T.F Cienc. Tecnol. Futuro vol.2 no.3 Bucaramanga Jan./Dec. 2002
1Ecopetrol - Instituto Colombiano del Petróleo, A.A. 4185 Bucaramanga, Santander, Colombia
e-mail: lsguevara@ecopetrol.com.co
e-mail: carlos.piedrahita@ecopetrol.com.co
2Numérica Ltda, e-mail: earroyo@numerica.com.co
ABSTRACT
Current trends of computational tools in the upstream of the petroleum industry are presented herein. Several results and images obtained through commercial programs and through in-house software developments illustrate the topics discussed. They include several types of problems and programming paradigms. Emphasis is made on the future of parallel processing through the use of affordable, open systems, as the Linux system. This kind of technologies will likely make possible new research and industry applications, since quite advanced computational resources will be available to many people working in the area.
Keywords: Scientific computing, open systems, Linux, parallel computing, 3-D seismic method, visualization, soft computing, seismic exploration, finite difference method, ray tracing, reservoir characterization, fuzzy logic, neural networks.
RESUMEN
En este trabajo se presenta una perspectiva actualizada de las herramientas computacionales utilizadas en las tecnologías de las etapas de exploración y producción ("upstream") de la industria petrolera. Los tópicos discutidos se ilustran con varios resultados e imágenes, obtenidos a partir de programas de software comercial y de otros programas desarrollados internamente. Entre estos tópicos se incluyen varios tipos de problemas y paradigmas de programación. Se le da énfasis al futuro del procesamiento paralelo y a los sistema abiertos, como el sistema operacional Linux. Este tipo de sistemas harán factibles nuevas aplicaciones en la investigación y en la industria, al permitir que muchas personas y entidades vinculadas al área, tengan acceso a poderosos recursos computacionales.
Palabras clave: Ciencia de la computación, sistemas abiertos, Linux, procesamiento paralelo, 3-D método sísmico, visualización, software de computación, exploración sísmica, método de diferencias finitas, rayos trazadores, caracterización de yacimientos, lógica difusa, redes neurales.
INTRODUCTION
For a long time, seismic exploration and production have been activities where computers have had influence on the way people use, handle, or make decisions. The way people forecast, visualize data, or assess reservoirs or possible prospects is greatly influenced by new developments in computer hardware and software.
In this paper we show examples of techniques that are strongly influenced by computing technology: seismic modeling, visualization of 3-D seismic data and reservoir characterization. In addition, we suggest ways in which these techniques will be more valuable and accessible to people involved in exploration and production processes, as well as to groups that are involved in research and education efforts within these areas.
We have identified the following techniques that may be critical during the next decade:
-
Linux system and open environments: This technology empowers groups to have computational tools that otherwise would not be available to them. Linux specifically provides the versatility of the UNIX system, as well as a graphical environment to develop programming projects. Backing Linux is the open environment concept, which allows advanced users to modify codes in a way that is not possible with closed software.
-
Parallel processing is a computing approach that has been of interest to research and industry projects for almost three decades. Today, the possibility of assembling clusters of Linux machines enables a more affordable parallelism. As an example of the application of this idea, a group of such clusters could be installed in a large area shared by several working groups, which would use it to solve different type of problems and share this computing resource.
-
Visualization: Major decisions or interpretations in exploration and production activities are made through the use of some type of image. Therefore, free and open libraries like the VTK (Visualization Toolkit) software make this technology accessible to many people around the world.
-
Intelligent systems: Mathematical models have limitations and, frequently, experimental information appears as a collection of data, with no relationships among them. Intelligent systems, specially the so-called soft computing or hybrid systems (such as neural networks, fuzzy logic, and genetic algorithms), allow for unstructured data handling, in order to determine some type of relationship among such data.
COMPUTATIONAL TOOLS AND LANGUAGES
In hydrocarbons exploration and production, computers are used in activities such as modeling, simulation, data processing and prediction of physical properties of reservoirs. In these fields, as in many other technological fields, the available algorithms and the velocity and power of the hardware frequently limit the size of the problem to be solved and the accuracy of the result.
These petroleum industry activities can be identified as scientific computing, a technological field targeted to provide solutions to computationally demanding scientific and engineering problems (Golub and Ortega, 1993). Hardware and software developments are promising, so as to obtain more accurate and comprehensive solutions to scientific and engineering problems. Hardware is increasingly less expensive and more powerful, e.g. personal computers or PCs are becoming as powerful as older workstations, and software has advanced toward more efficient, easy-to-use and low-maintenance programs. Details of these topics are illustrated in the next section.
Parallel computing
In order to increase computer power, methods using simultaneously several processing units have been developed. The classical computer model, known as the Von Neumann Machine, includes a single processing unit, which performs all of the required operations. Since many computational problems can be splited into smaller parts, even into elementary operations, and a different processing unit can perform each one of them, using several processing units simultaneously increases computer efficiency. This is the basic principle of parallel and vector computers, generally known as high-performance computers. Theoretically, the efficiency of parallel computing compared with a single processor, could be increased by a number times equal to the number of processors available. In real life, this is the upper limit (except for cooperating sub-processes), because of delays related to message-forwarding and networking tasks.
High performance computers have been an area of interest for research and the industry, at least over the last 30 years. As early as the 70's vector and parallel prototype computers were developed, and in the following decades, parallel and vector computation has been applied to numerous problems, frequently through special purpose machines. Single-instruction multiple data, multiple-instruction-multiple data, distributed memory and vector units have been some of the features of these machines, including brand names as Cray, SGI and IBM. However more extended application has been prevented by a combination of the cost and specific design of these machines.
Software design is also an important aspect to be considered in parallel computing. An application can be transformed to parallelism if it is possible to identify parts of the program that can be executed independently and simultaneously on separate processors. Programs usually need to be adapted to this type of processing, in order to take advantage of parallel machines, which is not always a trivial task. There are programming tools to make easier this adaptation, for instance object-oriented programming techniques that support parallel programming.
Open systems
Generally speaking, software can be classified into two groups: propietary or open, depending on whether the code has an owner or not. Open software allows many people to take part in its development and testing, and the resulting products can be used by anyone. It makes possible to have high-quality products at a low price and create more standard products. The UNIX operating system illustrates this subject, since at the very beginning it was open and free, and only later it became proprietary. Unix was developed for powerful computers like workstations and has replaced many other proprietary operating systems.
Currently, an important example of this Open-systems philosophy is the GNU project (acronym for "GNU's Not Unix"), sponsored by the Free Software Foundation, which have allowed advanced users to modify codes at a higher level of complexity than closed software allows. The power of the Open-systems style has been increased by the widespread use of Internet. Thus, nowadays it is easy to find and use powerful, free, open-source, and multi-platform tools. These include programming languages (e. g., C, C++, Fortran), numerical computation tools (e. g., Octave, a scientific programming utility, and Lapack, a programs library driven by numerical algorithms), editing tools (e.g., Latex), the Linux operating system, and so on.
Linux and Beowulf networks
In the early 90's a Unix-type operating system, LINUX, was introduced as an open system specifically designed for Personal Computers or PC's. This operating system has become an increasingly popular and robust tool.
Lately, with new technological developments in networking, it became possible to join many interconnected Von Neumann-type machines into a large parallel machine. Thus, with the development of computer networks and the increasing capabilities of the general-purpose PC, a more affordable option was made available: to use PC processors in a network working on parallel programs. As an example of open software tools available for such purpose, two general-use parallel software tools are available for UNIX and Linux: PVM (Parallel Virtual Machine) and MPI (Message Passing Interface). Therefore, Linux has become an increasingly interesting option that enables the use of a group of heterogeneous Unix computers connected to a network that operates as a single machine that solves large problems.
There are developments that integrate hardware and free software developments, and can be used on these systems. One example is the technique known as Beowulf, which describes how to cluster Linux computers to form a parallel, virtual supercomputer that consists of the server node and one or more client nodes connected together via a network (http://www.linux.org).
Below are cases of computing techniques, applied to exploration and production, to illustrate the feasibility of method and result enhancements through the use of these technologies.
SEISMIC MODELING
Seismic Waves in exploration
Seismic waves are an important source of information about the geometrical and physical properties of rocks, required in hydrocarbon exploration. The technology that takes advantage of wave propagation to obtain geological information is known as the seismic method. To obtain seismic data, elastic waves are generated on the Earth's surface and later are detected there, after being reflected on the rock interfaces. This raw data needs processing in order to obtain seismic sections, which are interpreted subsequently to obtain geological models.
Sophisticated algorithms have been developed to process seismic data. Seismic migration is an important example of such processing techniques. In migration a wave propagation model is applied to the recorded wave field, to obtain the properties of geological interfaces (reflectors). On the other hand, seismic modeling is the numerical simulation of wave field propagation applied to a geological model. Seismic modeling is another useful tool of the seismic method, since it helps to understand the relationship between geological models and seismic images. Taking into account their basic principles, migration and modeling can be considered inverse processes from one another.
Migration and modeling background is the mathematical models of wave propagation. A variety of such models, with differences in accuracy and complexity have been used. An example is the acoustic model, the most commonly found in the seismic method, which only considers compressional waves (the only wave mode that propagates through fluids). Furthermore, the model can be 2-D or 3-D. Typically, isotropy and homogeneity of the medium are the basic hypothesis. The acoustic model is the basis of almost all the many migration algorithms currently used. The elastic model, besides compressional waves includes shear or secondary waves, typical of solids. Even though this model is much more difficult to implement, it is more accurate, and there is important research in that direction. Also, there is research to apply more complete mathematical models which include anisotropic and anelastic properties.
Despite the fact that the mathematical model of elastic wave propagation can encompass many subtleties, simplified versions are used in practical applications. The main reason for this limitation relies on the computer resources demand. Huge amounts of data are recorded in a typical seismic survey (for example, a 10x10 km 3-D seismic survey may require 200 GB of memory) and the processing algorithms are usually applied to a significant part of this data. For example, for modeling and migration, the wave field characteristics have to be calculated for each sampling time, along many space locations and probably many times. The more accurate the mathematical model is, the more comprehensive the information extracted from the data will be, but the more demanding on computer resources. Therefore a trade-off has to be made between the accuracy of the numerical algorithm and the computational requirements.
Modeling using the finite difference method
In this section we illustrate computer resources demand and its relation to the accuracy of solutions for seismic modeling and migration. Finite differences (FD) and ray-tracing, two modeling methods, are applied to that end. These two models define a range of seismic modeling and migration methods.
FD is a technique used to solve actual numerical problems represented by partial differential equations, substituting infinitesimal differentials with finite differences. The finite difference approximation, together with some numerical factors, defines the accuracy of the result. Through this method, it is possible to generate the complete wave-field, so as to enable studies that are hardly feasible through other methods such as to obtain the complete wave field, to establish complex geometrical settings, and to implement different wave equation approaches.
An example of FD modeling of the wave-equation is presented in the next section. It uses a 2-D elastic wave algorithm developed by Levander (1988). In this algorithm the medium is represented as a grid of squares, and the geological model is defined by its geometrical and elastic properties. Initial conditions are the source of energy and the boundary conditions. The entire wave-field is calculated sequentially throughout the geological model by time steps.
In FD the computational efficiency is very sensitive to the size of the space grid matrix and to the number of time steps. Simultaneously, these parameters are related to the accuracy of the result: if the grid size and sampling time are not fine enough for the velocity field, the calculations can become unstable; also, insufficient sampling of short wavelength components causes dispersion, a numerical noise. So, depending on the geological model, the computational cost increase with the physical accuracy.
Figure 1 illustrates the result of an example using FD modeling method. The geological model for this example includes a low-velocity near-surface layer, which implies a very fine grid. Notice the number of seismic events and the fine gradation in amplitudes and wave-shapes.
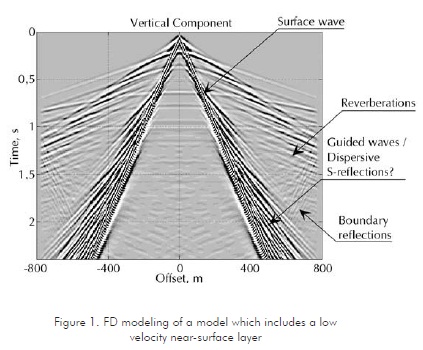
Compared to FD, ray tracing is a quite simple model of wave propagation, where the wave front, a real physical property, is represented by its normal, known as ray (Fagin, 1991). With this method it is possible to obtain the path and time of travel for any specific trajectory, as defined by source and receiver locations. However, other characteristics of the wave-field, such as amplitude and phase, result from independent calculations based on approximations. Figure 2 illustrates the results of a ray-tracing algorithm applied to the same model of Figure 1.
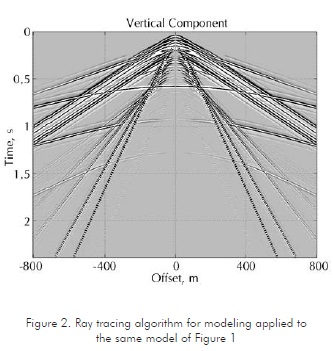
Comparing Figures 1 and 2, we can observe a more complete wave-field resulting from the FD method. Also the dynamic characteristics, such as amplitudes and waveforms, have more fidelity in this method. However, there is a large difference in computational efficiency since FD requires more than 4000 times the computer time of ray tracing for the same model, using a single processing unit. If the model were 3-D, probably one thousand times more machine resources would be required. Using parallel computers featuring one thousand processing units, the 3-D model would still require a couple of weeks to be fully processed.
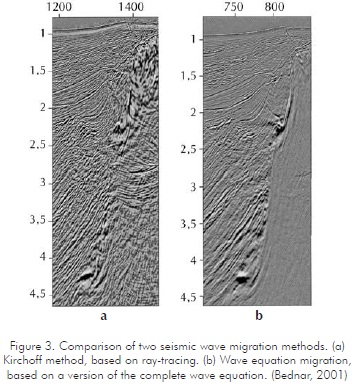
Migration methods also illustrate the limitations of ray-trace based algorithms. Figure 3 shows an example of two types of migration which are based on different wave propagation models. The first one, Figure 3a, is based on a ray trace based method known as Kirchhoff migration. Figure 3b corresponds to migration using a more complete model, based on the wave equation. The last solution is more demanding on computer resources and more accurate, as shown by the results. This type of solution is currently available due to simultaneous advances in computing and seismic processing methods.
As computer power is a limiting factor for the use of more comprehensive solutions, wave propagation simulation -and especially finite differences- has been an object of interest for parallel computers applications
for a while. For example, Fricke (1988) applies them to reverse time migration, and Myczkowski et al (1991) uses parallel computers for modeling purposes in a Connection Machine supercomputer. More recently, Villarreal and Scales (1997) developed algorithms for 3-D waves in acoustic media, using a network of Linux machines.
VISUALIZATION
In the next section, we will explain a case of open-software libraries applied to exploration. As shown therein, open-software tools are integrated with commercial software and standard formats to develop a practical application tool for visualization of 3-D seismic data.
What is visualization?
Visualization is the transformation of data into pictures. The picture can display the data directly, or can innovatively present its information content, which can give us an insight into its meaning (Schroeder et al., 1996).
Visualization is almost a mandatory tool, required to make sense out of the frequently overwhelming flood of information in today's world. An example is the information generated by the seismic method, especially in the case of 3D seismic data, which provides a complete image of earth volumes. As presented before, seismic data surveys are currently capable of absorbing hundreds of gigabytes in a few days, while seismic processing itself also produces lots of information. Without visualization, most of this data would remain unseen, on computer disks and tapes, with no meaning or sense. Through the introduction of this tool, it is possible to use the best of our abilities, the vision system, to understand and analyze information.
Common visualization tools
In the last few years, the software division of the company Numerica, has used free software programming tools to develop visualization software. This investigation led to the implementation of sophisticated visualization tools that easily satisfy industry demands. These tools have been tested at the geophysics lab and the reservoir characterization group of the ICP (Colombian Petroleum Institute).
It is difficult to categorize visualization tools because most of them have a variety of functions covering many different applications, and many have overlapping functions. However many commercial and free visualization software packages can be identified. Common visual programming systems include AVS/Express (http://www.avs.com), Iris Explorer (http://www.nag.co.uk/Welcome_IEC.html), IBM Data Explorer (http://www.ibm.com/dx), Khoros (http://www.khoral.com), and VTK (http://public.kitware.com/VTK). All of these are based on low-level graphics libraries, like OpenGL (http://www.opengl.org), Direct3D (http://www.microsoft.com), Phigs (http://www.gsi.de/computing/unix/primer/graphical_tools/subsection3.1.1.html), and GKS-3D (http://web.ansi.org). The most widely accepted and used is OpenGL.
Viewing Seismic Information and Structural maps using OpenGL
In exploration geophysics, most simple targets have now been found and depleted. New prospects are structurally complex, requiring 3-D retrieval and imaging. The need to effectively build a structural and velocity model for 3-D imaging, and to effectively analyse the resulting image, has led to the need for more sophisticated viewing software.
In the following section we will explain basic concepts of the OpenGL data model selected to represent the seismic information, as well as those models selected to represent the surfaces maps. An example is illustrated in Figure 4.
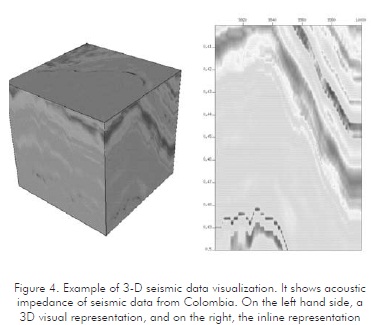
The data model consists of two parts: an organizing framework (such as shape or geometry), and information associated with each element in the structure (known as attribute data).
The organization structure consists of points or cells such as lines, polylines, triangles, squares, tetrahedral, hexahedron, etc. This information can also be also classified as regular or irregular (alternatively, structured or unstructured). Regular data has an inherent relationship between data points. For example, if we sample an evenly spaced set of points in 1D, we do not need to store all the point coordinates: only the beginning, the spacing between points, and the total number of points. This is extended naturally to 2D/3D seismic information.
For irregular data, there is no defined pattern between points or cells and, therefore, we can represent arbitrary structures; this is the case of the map's surfaces. A big advantage of irregular data is that we can represent information more densely where it changes quickly, and less densely where the change is not so significant.
Attribute data is associated to each point within the organization's structure and consists of scalar (which are single value functions, like trace amplitudes), vectors, normal, texture coordinates, tensors, etc.
Pipeline structure of the visualization tools
For the implementation, we used a pipeline structure, which means that information is sent from one program to another, in order to process the information and obtain the final best image.
For the libraries development, we first read the information, using a set of SU (Seismic Unix) and SEP (Stanford Exploration Project) functions to read SEG-Y data; also we can read the structure maps information from a GOCAD file.
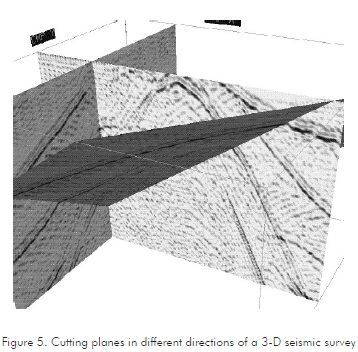
Afterward, we implement a set of filters or functions that help to construct the cutting planes (Figure 5), and the complete Cube. These functions intercept the planes with the seismic cube and interpolate the seismic amplitudes along the plane.
Currently, these libraries can easily switch between normal viewing and stereoscopic view. A 3D image is like an ordinary picture, but a stereo image gives a stronger sense of depth, which is generated by providing two slightly different images of the same object, one image to each eye. The user can switch between stereo images and normal images by simply pressing a key, and viewing the stereo images with inexpensive polarized glasses.
Parallel computing in visualization activities
Huge amounts of data, and similar processes applied to small sub-sets of these data make parallel computing very useful for visualization. A target to be met consists of visualization of large data sets and, probably, its handling in real time (Ahrens et al., 1999), which is the next step in the development of the visualization tool shown here.
RESERVOIR CHARACTERIZATION AND SOFT COMPUTING
While computers in exploration are targeted to produce an image of the sub-surface rocks, computer applications for hydrocarbon production are targeted to obtain information on properties that are useful for reservoir management. Characteristics such as porosity and permeability, related to fluids flow, are more important in this case than the identification of rock ages or geometry. From the reservoir characteristics, engineers carry out tasks such as computing oil and gas in place, predicting primary and secondary recoveries, determining where to drill, and computing oil and gas flow rates. However, these are not easy tasks, since most oil and gas reservoirs are in complex layered systems.
Drilled wells are the main source of information for reservoir management. Direct measurements are core laboratory analysis, and indirect measurements are electrical well logs. Core analysis, the most expensive source of information, shows the real properties of rocks for a few specific samples; well logs allow inferring characteristics from physical properties along the complete well. Well information is limited to a very short distance from the well; however, it can contribute to an overall picture accurate data. With the seismic method -especially with 3-D seismics data-, it is possible to obtain a complete picture of the reservoir, although with lesser resolution. Thus, these techniques can be considered complementary to each other, and while combining them it would be possible to obtain more useful reservoir information.
The degree of success of many oil and gas drilling, completion and production activities depends upon the accuracy of the models used in reservoir descriptions. Therefore, frequently, methods based on deterministic equations are not well suited to solve this type of problems. During the last decade, the application of so called soft computing techniques, such as neural networks, fuzzy logic and genetic algorithms, for the identification and handling of nonlinear systems, has shown success in applications (e.g. Arpat et al., 2001).
Soto et al.(2001) illustrates the application of such methods to the characterization of a field in Colombia, where porosity was a fundamental parameter for a successful field development. The laboratory results on cores were extrapolated to the wells and by doing this, it was possible to obtain continuous records of permeability and porosity for several places in a reservoir.
Furthermore, this information can be related to seismic data and, since 3-D seismic data can produce volume image of the complete reservoir, it would be possible to obtain a 3-D image of porosity and permeability. There is room for applications of high performance computing with demanding requirements from algorithms that integrate as many information pieces as possible to get a complete image of a reservoir.
CONCLUSIONS
The big picture of petroleum exploration and production technologies is pervaded by computer technology. The goal is to obtain an accurate image of the reservoir, which can be developed from microscopy images, from laboratory tests and well logs, and from seismic data. These images are translated by experts into knowledge, and used to solve a specific problem. High performance computing is mandatory to obtain and process such information, and hardware and software become increasingly powerful tools. As an example, 3-D seismic data has plenty of information, probably not fully used. Therefore, better information for field development could be obtained through high performance computers and the integration of many information sources.
Simultaneously, there is a trend toward the use of more affordable computer tools, resulting of open software systems. By this way, this resource of the human knowledge becomes more instrumental in the generation of solutions for the petroleum industry. Development of these computer tools therefore appears as a promising strategy for the industry.
ACKNOWLEDGMENTS
We express our sincere appreciation to the "Instituto Colombiano del Petróleo" of Ecopetrol for providing us with the necessary knowledge and computing resources required for this research effort.
REFERENCES
Ahrens, J., Law, Ch. and Papka, M., 1999. "A parallel approach for efficiently visualizing extremely large time-varying datasets". Los Alamos National Laboratory Technical Report: LAUR-00-1620. [ Links ]
Arpat, B. G., Caers, J. and Haas, A., 2001. "Characterization of West-Africa submarine channel reservoirs: a neural network based approach to integration of seismic data". SPE Annual Technical Conference and Exhibition Memories. [ Links ]
Bednar, J. B., 2001. "Seeing the invisible: the next generation in seismic depth imaging". The Leading Edge, 20, (5): 536-543. [ Links ]
Chen, J. X. and Frieder, O., 1999. "Application of computer graphics software tools". Computing in Science and Engineering, November/December. [ Links ]
Fagin, S. W., 1991, "Seismic modeling of geologic structures". SEG Geophysical Development Series. [ Links ]
Fricke, J. R., 1998. "Reverse time migration in parallel: a tutorial". Geophysics, 53, (9). [ Links ]
Golub, G. and Ortega, J. M., 1993. "Scientific computing: an introduction with parallel computing". Academic Press. [ Links ]
Larsen, S. and Grieger, J., 1998. "Elastic modeling initiative, part III: 3-D computational modeling". 68th Ann. Intl. Mtg. SEG Expanded Abstracts. [ Links ]
Levander, A., 1988, "Fourth-order finite difference P-SV seismograms". Geophysics, 53, 1425-1436. [ Links ]
Myczkowski, J., McCowan, D., and Mufti, I., 1991. "Finite-difference seismic modeling in real time". The Leading Edge, June, 49-52. [ Links ]
Schroeder, W. J., Martin, K. M., and Lorensen, W. E., 1996, "The Visualization Toolkit: an object oriented approach to 3D graphics". Prentice Hall. [ Links ]
Soto, R., Torres, F., and Arango, S., 2001. "Improved reservoir permeability modes from flow units and soft computing techniques: a case study, suria and reforma-libertad fields, Colombia, SPE 69625". Proceedings of the 2001 SPE Latin American and Caribbean Petroleum Engineering Conference, Buenos Aires, Argentina. [ Links ]
Stanford Exploration Project (SEP). 2001, Annual Report. [ Links ]
Villarreal, A. and Scales, J. A., 1997. "Distributed three-dimensional finite-difference modeling of wave propagation in acoustic media". Computers in Physics, 11, (4): 388-399. [ Links ]

