


Services on Demand
Journal
Article
 English (pdf)
 Article in xml format
 Article references
 Send this article by e-mail
Indicators
-
 Cited by SciELO
 -
 Access statistics
Related links
-
 Cited by Google
 -
 Similars in
SciELO
Similars in
SciELO -
 Similars in Google
Share

 Permalink
CT&F - Ciencia, Tecnología y Futuro
Print version ISSN 0122-5383On-line version ISSN 2382-4581
C.T.F Cienc. Tecnol. Futuro vol.2 no.5 Bucaramanga Jan./Dec. 2004
STUDY OF THE DESIGN VARIABLES FOR A WET-CHAMBER GAS METER PROTOTYPE (MGCH)
Carlos-Hernando Patiño*1, Luis-Said Romero*1 and Jabid Quiroga*2
1Ecopetrol S.A. - Gerencia Complejo Barrancabermeja, B/bermeja, Santander, Colombia
2Universidad Industrial de Santander, Bucaramanga, Santander, Colombia
e-mail: carlos.patino@ecopetrol.com.co e-mail: lsaid@latinmail.com e-mail: jabib@uis.edu.co
(Received 18 July 2003; Accepted 21 October 2004)
* To whom correspondence may be addressed
ABSTRACT
This paper established the most important variables and their correlation that affect design and operation of Wet-Chamber Gas Meter (MGCH), focused on the gas pressure difference along the meter and the sealing-liquid level. In order to study variable behavior a simulation was carried out based on computational systems
The mathematical model developed was built taking into account common features in present wet test gas meter as their internal configuration. Therefore, this work can be understood as a general analysis and its conclusions can be extended to whichever meter of this type.
A software was developed to facilitate the analysis of the variables involved in this physical process; besides the drum sizing was modeling using a CAD software.
As a result of this investigation, theoretical basis were established for the analyzing and designing of a MGCH meter, as a previous phase to the construction and evaluation of the prototype. Uncertainty analysis of each variable implicates in this model was beyond the scope of this study.
Keywords: gas meter, wet-chamber, design.
RESUMEN
En este documento se establecieron las variables más importantes y las correlaciones que afectan el diseño y la operación de Medidores de Cámara Húmeda (MGCH), el estudio se centra en la diferencia de presión a través del medidor y el nivel de líquido sellante. El estudio del comportamiento de las variables se efectuó a través de un simulador.
El modelo matemático fue desarrollado teniendo en cuenta las características comunes de los medidores de cámara húmeda como su configuración interna. Por lo tanto, este trabajo puede considerarse como un análisis general y sus conclusiones pueden ser extendidas a cualquier medidor de este tipo.
Se desarrolló un programa computacional para facilitar el análisis de las variables involucradas en este proceso físico; además el dimensionamiento del tambor fue modelado usando un programa CAD.
Como resultado de esta investigación, se establecieron las bases teóricas para el análisis y el diseño de un medidor de cámara húmeda. Como fase previa para la construcción y evaluación de un prototipo. El análisis de incertidumbre de las variables involucradas en este modelo no hacen parte del alcance de este estudio.
Palabras claves: medidor de gas, cámara húmeda, diseño.
INTRODUCTION
Gaseous fluid metrology is a necessity for the national industry, which based on this and other factors, intends to consolidate within a globalized and highly competitive market. Therefore, establishing technological elements that support this field becomes a leveraging factor for the Colombian industry, breaking away from technological dependency and broadening the competitive ability of our industry to face the current entrepreneurial environment.
This study is an experience that undertakes the technological study of wet test gas meter (MGCH, for its acronym in Spanish: Medidor de Gas Tipo Cámara Húmeda), widely used in laboratories and research institutes for gas meter calibration, and general gas measurement.
For all entities interested in managing a MGCH meter, this study enables them to break away from the concept of this being a "black box" in charge of measuring gas volumes. It is now possible to know and control different aspects relating to the meter's operation, and this document shall facilitate, at any given moment, the repair of such meters in Colombia, allowing for significant savings in both money and time, for these repairs are currently performed only in foreign countries such as United States, Japan, China, South Korea, and Germany
General data on a wet test gas meter
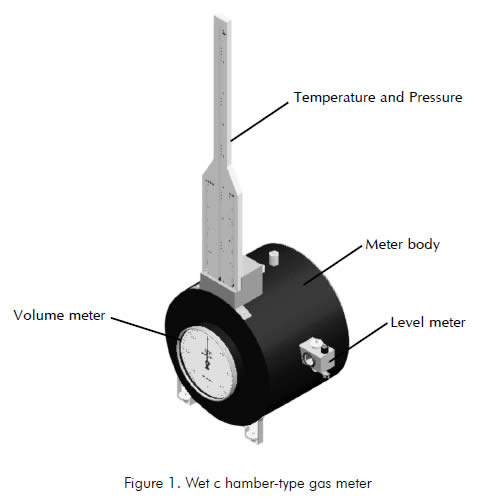
A wet test gas meter (Figure 1) is a positive displacement equipment used to measure gases with an accuracy of nearly +/- 0,5%.
A MGCH meter is made up of a drum, a mechanism to account for and register volumes, a sealing liquid, a carcass, and auxiliary instrumentation (manometer, thermometer, level indicator, and leveler or "bulls eye") (Figure 2).
The primary element is a drum made up of four identical internal plates, one cylindrical jacket that covers these plates, an entrance chamber and one shaft binding all these elements, on which the ensemble spins.
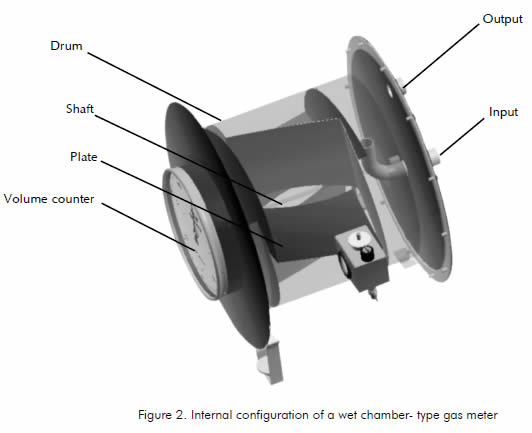
The internal plates divide the drum volume in chambers with characteristics that enable it, in a coordinate and consecutive way, fill and empty of gas each one of them according to the sealing liquid level. This achieves a spin proportional to the gas volume that runs through the meter.
Wet test gas meter operation
In operation, a pressure difference is originated inside the meter when gas passes through it, forcing the drum to spin. This rotation allows to fill the chamber open to the flux and to empty the chamber open to the exit port. The spin is converted into a gas volume measure, which is registered either by a counter or by an encoder. Additionally the drum is equipped with auxiliary instrumentation that allows monitoring of variables such as pressure, temperature, liquid level, equipment leveling, and measurement recording (Asme, 1971).
DESIGN VARIABLE ANALYSIS
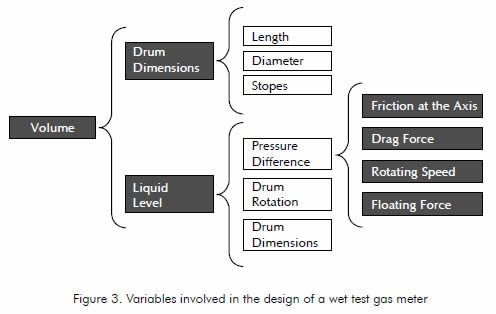
The most important variable in a MGCH meter design is the measurement volume. Figure 3 shows different variables that affect volume and its dependence.
Drum sizing
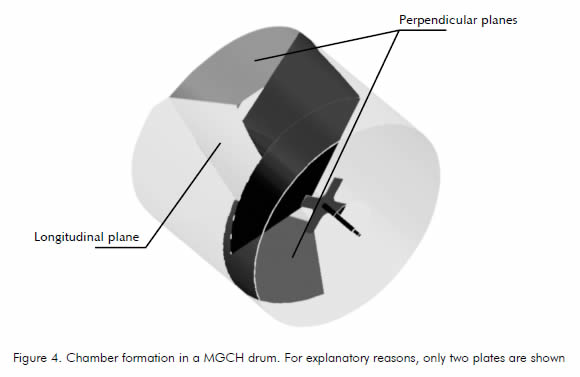
The gas volume registered in a complete drum spin is the number of chambers times the volume locked by one of them when the interference stage begins; that is, the instant in which no gas flux passes through the chamber because the entry port is completely closed, Figure 4.
The drum sizing depends on the different inclinations of the internal plates, the drum's effective length and diameter, as well as, the sealing liquid level. Configuration of the internal plates allows the formation of entry and exit ports; it also improves the hydrodynamic behavior, allowing for better operation capacities.
The method used to determine the chamber volume was modeling via a CAD tool known as Solid Edge Origin. Given the versatility this software provides to modify characteristic dimensions of the built model (drum), thus allowing to link each dimension to easily alterable variables which help to modify the model.
The criterion chosen to determine the drum's dimensions was that of the minimum quantity of sheet used for its construction, taking into account the established metrological and operational parameters.
Sealing-liquid level
Due to methodological reasons, it is convenient to initially perform a study focusing on the drum rotation and sizing factors (Figure 3). The pressure difference analysis is established in a particular way, given its complex interaction with the meter variables.
The sealing liquid level significatively affects the volume measured. This level is affected by the pressure difference between input and output ports. Thus, the pressure difference causes a level difference between each space inside the meter. This characteristic behavior can be modeled using the hydrostatic behavior of Pascal's vases, as shown in Figure 5.
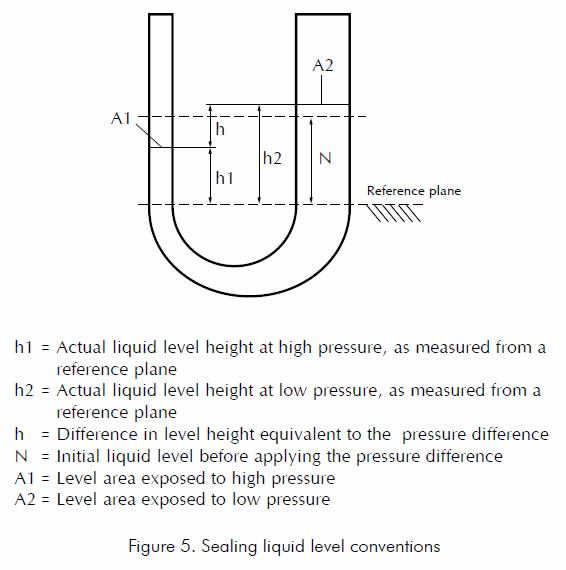
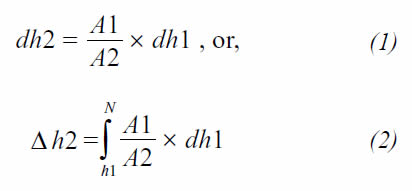
According to Figure 5, areas A1 and A2 may represent high and low pressure areas in the drum (Figure 6), while the U-shaped tube represents the hydraulic communication between the drum chambers through the sealing liquid. The difference in area between A1 and A2 causes the pressure column h to displace the liquid columns in asymmetrical form in regards to the initial level. Characterization of the level's behavior is shown below.
The volume displaced by the left column is equal to the one on the right column; therefore, dh1×A1 = dh2 × A2, clearing dh2 we have:
Equation 2 shows that the variation relationship for each level height at high and low pressure is influenced by the relationship of areas A1 and A2, which, due to the drum's geometry, will have the following values:
Therefore, it is necessary to know the high and low pressure areas behavior when the drum is subject to rotation, in order to determine the sealing liquid level behavior in each area. These areas result from the intersection of the surfaces that make up the drum and the sealing liquid level, which are characterized for being variable with rotation. To describe the internal plates in geometrical terms, the dimensional characteristics shown in Figure 7 are considered.
According to Figure 7, points 1-2-3 form the upper perpendicular plane, points 3-4-5 form the longitudinal plane, and points 4-5-6 form the lower perpendicular plane.
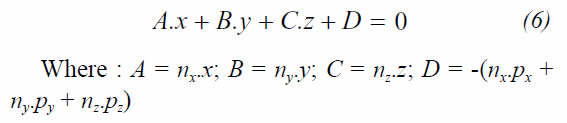
The plane's equation that passes through a point P = (px,py,pz) and has a normal vector N = (nx,ny,nz) is:


Taking Equation 5 and organizing its terms, the equation obtained for a plane has the following form:
With this last expression it is possible to know the coordinates of all the points that belong to the drum plate and to find the equation of each one of its planes for any position. The plane that forms the level is of the Y = Constant type, where the constant corresponds to the height of the level from the center of the drum.
Pressure difference inside the drum
For the drum to rotate inside the sealing liquid, certain amount of energy is needed to overcome the resistance to rotation presented by the liquid and the contact points at the support points. The only source of energy is the gas that is going to be measured. In the meter operation, energy supplied by the gas is through the difference in pressure between gas entry and exit at the meter. Since the gas measurement process is generally run at constant temperature, the gas energy difference between the entry and exit points of the meter is stated as a change in its density. It is convenient then, for this pressure difference to remain as low as possible, in order to maintain the device's accuracy.
The drum's movement is mainly affected by friction at the shaft supports, the effect of viscous friction on the drum's surface, the drag force upon the drum's internal plates inside the liquid, and the floating force. Next, our study is focused on determining the relation between this factors and the pressure difference inside of the meter.
Torque due to floating force
The volume of the submerged drum material produces a variable torque, both in direction and in magnitude; this variable torque results in a discontinuity in the drum's rotation velocity (Figure 8).
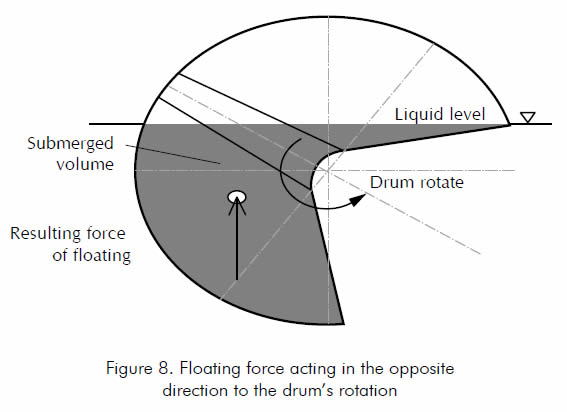
To determine this torque's value it is necessary to know the volume of the plate submerged in the sealing liquid and the application point of the floating force for each rotation angle. This is achieved through a differential analysis of the submerged solid material, considering the behavior for any of the drum's angular positions.
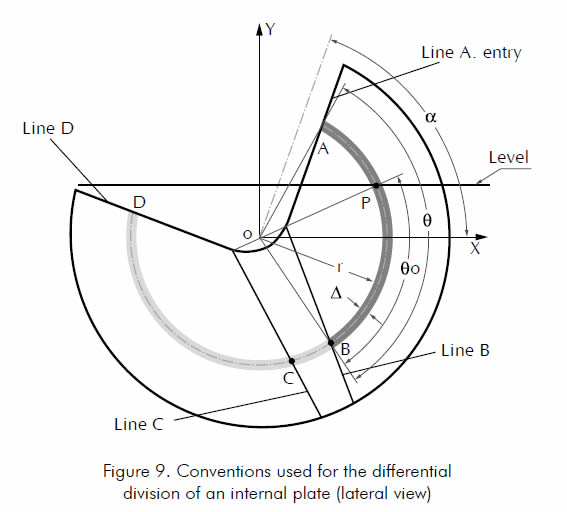
Figure 9 displays the conventions used for the differential division of an internal plate, where the shadowed area represents the differentials for each internal plate's plane, although projected on the XY plane.
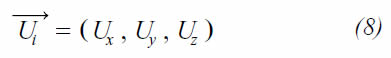
By definition, the area of any surface may be represented as a perpendicular vector to it; therefore, the area on the XY plane may be expressed through its components in X, Y and Z, as follows:
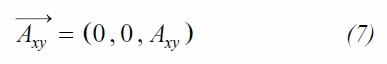
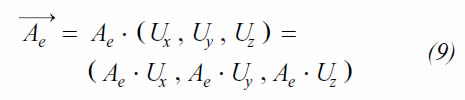
The effective area producing floating force will have a direction normal to the plane. Then, based on the vector normal to a plane I, its unitary vector may be defined as:
the effective area of the differential over the real plane will be:
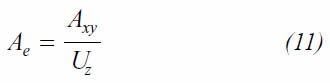
Since the area in the XY plane is the projection of the effective area on the XY plane, then vector Axy is the component of the Ae in Z direction; that is,
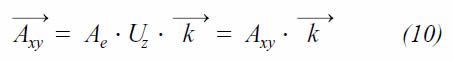
Then, the effective area that generates floating force is the following:
In this way, the floating force is calculated as follows:
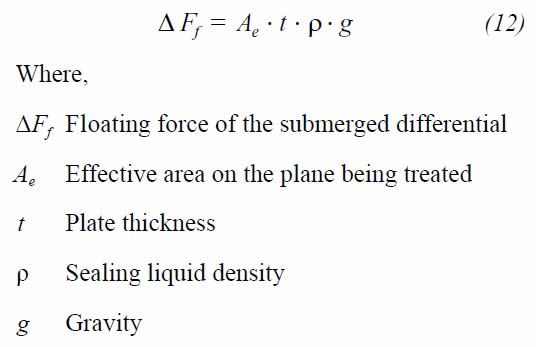
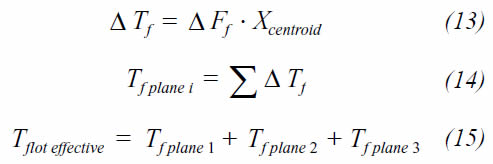
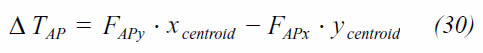
Because the form of a differential is regular, the centroid Xcentroide is located in the center of such portion. Then, the torque due to the floating force in a differential will be:
Torque due to drag forces
As long as there is a relative movement between a solid body and a fluid in which it is submerged, the body experiments a net force F, due to the fluid's action (Fox, 1997). The force F is composed of a component parallel to the fluid's relative movement, called drag force, and of a component perpendicular to the relative movement called sustentation. Due to the complexity of the physical phenomenon, these two components are not usually evaluated in an analytical way, so it is necessary to use experimental coefficients that allow to establish adequate relationships for their calculation.
In this case, the model assumes that for a given position of the drum, the fluid moves towards the plate in one single direction; that is, no turbulences, recirculations and other phenomena that interfere in the setting of the fluid's velocity profile, are taking into consideration. On the other hand, consider the area differential shown in Figure 10.
The differential's linear velocity will be:
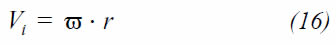
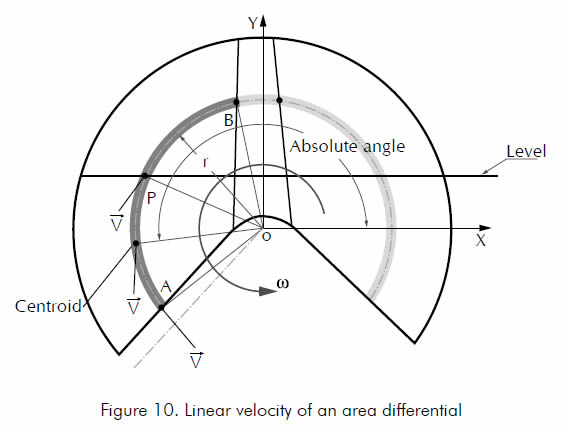
Additionally, assumption was made that the velocity with which the fluid approaches the plate is equal to the differential's linear velocity, but in the opposite direction, so as to obtain the resistance effect against the drum's rotation. The velocity vector will have a constant magnitude throughout the whole differential, but will vary in direction alongside it.
The linear velocity in the centroid of the differential's portion submerged in the liquid was established as the velocity's representative direction, since it facilitates the breakdown of the velocity's coordinates.
The model also considers that the fluid's approaching velocity V remains constant and in the same direction, throughout the whole differential.
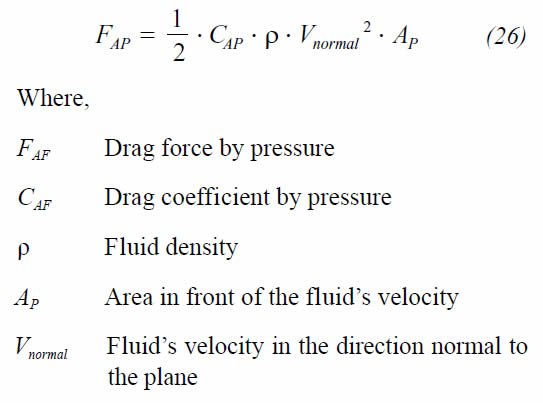
Due to the fact that each of the plate's planes will always have a defined inclination as related to the direction of velocity V, the determination of a differential's drag force will be divided in two: the drag force produced by the fluid's velocity normal to the differential, which shall be called drag force by pressure (Fox, 1997); and, the drag force caused by the fluid's velocity tangential to the plane, which shall be called drag force by friction (Fox, 1997).
The resulting lift force will be zero, since the flux distribution through the differential, considering all the aforementioned reasons, will be symmetrical with respect to it; therefore, no pressure gradients perpendicular to the flux direction exist such that they may generate it. In this way, the total force resulting from the fluid's drag will be the vectorial sum of the drag force by pressure plus the drag force by friction. The drag coefficient will be defined as (Fox, 1997):
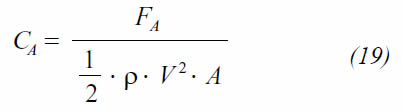
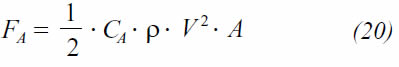
Where FA is the drag force (of any type), ρ is the fluid's density, V is the fluid's velocity, and A the surface area subject to the fluid's movement. The drag force is calculated as follows:
Depending on the drag force type, studies have been developed to determine the value of the drag coefficient.
Torque due to the drag force by friction
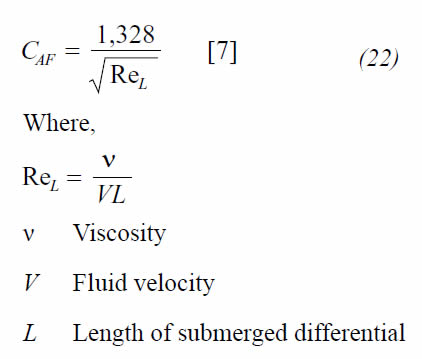
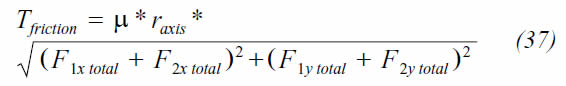
The drag force by friction is a function of the flux velocity tangential to the plane under study. The drag force by friction is calculated as follows:
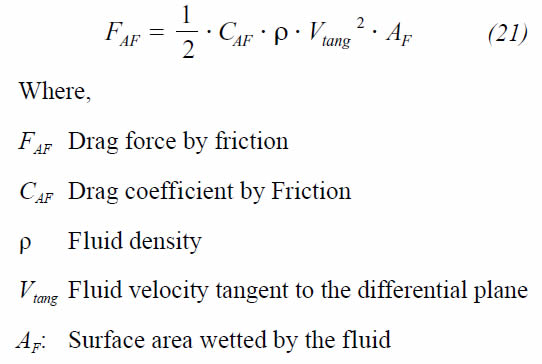
Due to the complexity associated to the movement of the sealing liquid, was difficult to evaluate analytically the Reynolds number. Therefore, the model assumes laminar flux (Re ≤ 5X10⁵) supported in the low rotational drum's velocity (approximately 5 rev/m) and the low tangential drum's velocity. For this reason, the drag coefficient by friction CAF is calculated as follows:
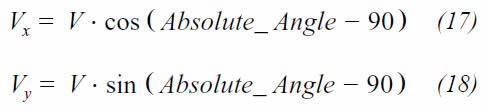
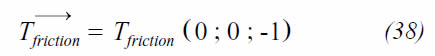
Finally, tangential velocity is defined as follows:
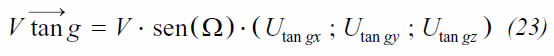
Where, (Utan gx ; Utan gy ; Utan gz ) is the unitary vector tangent to the differential plane, and Ω is the angle between fluid's velocity vector and the normal unitary vector.
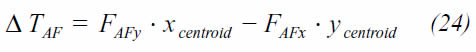
The drag force by friction will have a unitary vector with direction tangent to the plane and will be applied on the centroid of the portion of the area differential that is submerged in the liquid.
The only components of the drag force that generate torque contrary to rotation and that are of considerable magnitude, are those in the X and Y directions (Figure 10). Then, the torque against the rotation of an area differential is calculated as follows:
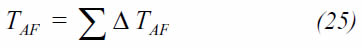
Once again, the total torque shall be the sum of all torques generated by the differentials; in other words,
Torque due to the drag force by pressure
Drag force by pressure is calculated according
to the following equation
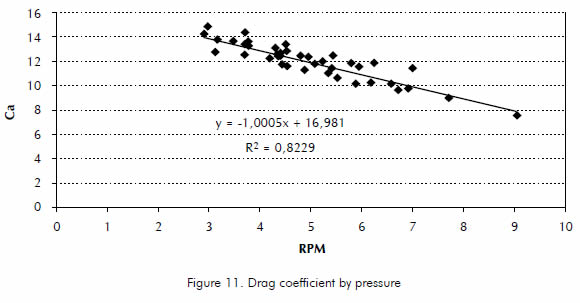
Calculation of the drag coefficient by pressure is essentially the same for sharp-border objects (characteristics of the meter's drum), as long as the Reynolds number is greater than 1000, and has an order between 1,5 and 2 (Fox, 1997). In the MGCH meter case, the Reynolds number is under 1000, due to low linear velocities. Unfortunately, no information was found for the analytical calculation of this coefficient at the aforementioned conditions; therefore, an experiment was designed to estimate it (Holman, 1996). The experiment consisted in simulating the drum behavior with a water-immersed rotor (a wheel with four rectangular palettes, featuring a form and dimension that allowed for overlooking of the effects due to the drag force by friction and the floating force), to which a constant and known torque was applied in way such that the drag force acting on the pallets counteracts the applied torque. On the other hand, the rotation velocity ω of the simulated drum was taken. Therefore, the drag coefficient may be calculated through the following equation:
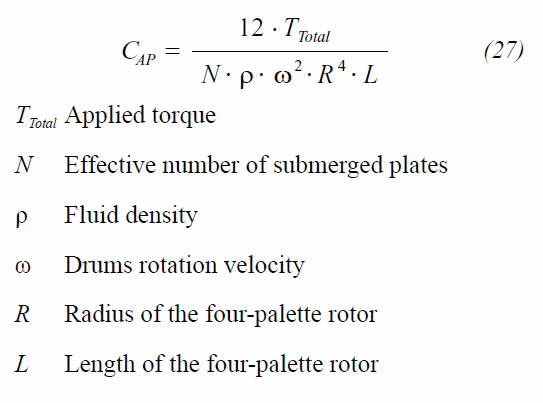
Evaluation of the results established a linear behavior for the drag coefficient against the rotation speed (Figure 11).
Once CAP has been established, velocity normal to the plane can be calculated with the following equation:
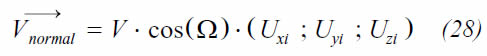
Where (Uxi ; Uyi ; Uzi) corresponds to the unitary vector normal to the differential plane of the internal plate.
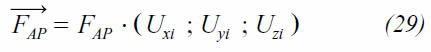
Finally, AP is the differential area normal to the fluid's velocity. In this manner, the drag force by pressure is vectorially defined as:
Similar to the drag torque by friction, the drag torque by pressure for a plate's differential is established through the following equation:
And, the total torque will be the sum of all torques generated by the differentials; that is,
Torque due to friction of the shaft's support points
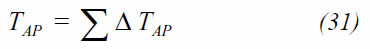
The shaft is supported by bearings at each end of it. The reaction forces caused by the action of drag forces, of floating forces, of gas pressure, and of the drum weight act upon the supporting points. The superposition method was used to find the total reactions in the supporting points. Therefore, the forces applied to the drum (except for weight) shall be considered as the sum of the forces calculated in area differentials (Figure 12).
The supporting points are symmetrically located at a distance M from each other. Forces were conventionally used to deduct the formulas, according to the directions shown in Figure 11.
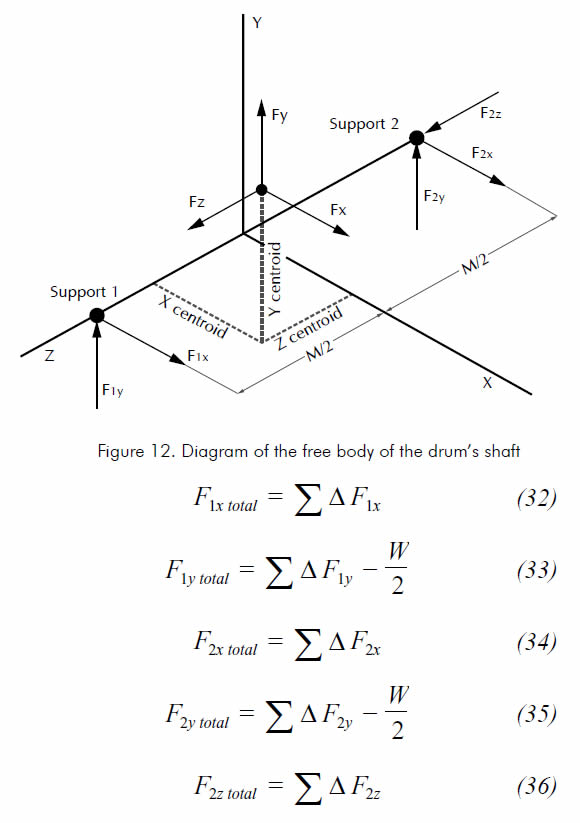
Sources Fx, Fy and Fz are the sum of the components of the drag forces by friction, drag forces by pressure, and floating forces that act on an differential area. Total reactions at the supporting points, while taking into account the drum's weight W, and the pressure force produced by the gas acting on the free surface of the drum, shall be the sum of the forces of all differentials; in other words, μ is defined as the friction coefficient between the bearings material and the shaft. Therefore, the torque due to the friction on the shaft is calculated as follows (Pytel et al., 1999):
The frictional torque has direction opposite to the drum's rotation:
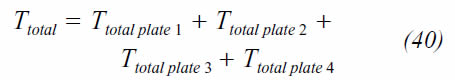
The torque opposing the plates rotation (or the one in the same direction, whichever the case may be) is calculated as follows:

This total torque corresponds only to a given position of the plate; in other words, to angle α. To take into consideration the effect the other three plates have, it is necessary to calculate the torque for the proper position of each plate, considering its relative position. It follows that,
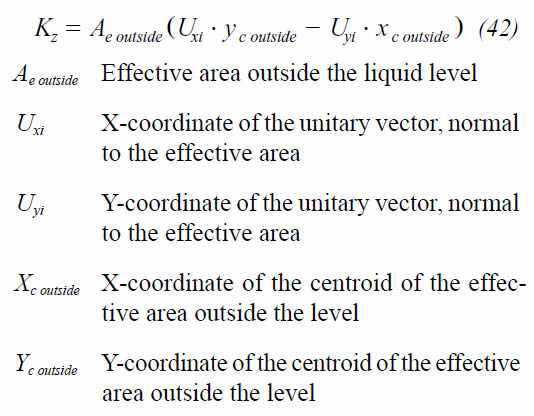
Therefore, the total torque must be equal to the torque generated by the pressure difference acting over the unbalanced plate, which is outside the liquid level. This pressure differential through the drum is represented by:
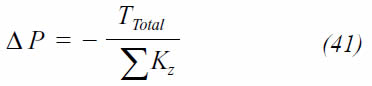
Where Kz is represented by the next equation, and is applicable to the four internal plates in any position.
Components of the differential force due to the pressure difference contribute to the reactions at the supporting points and to the torque due to friction on the shaft. This torque is needed in turn, to calculate the pressure differential. This implies that determining the pressure differential is an iterative process in which a pressure differential value is assumed; the total reactions, friction torque, and total-resistance torque are calculated; and, the pressure differential is recalculated until the assumed value matches the calculated value.
METER MODELING
The meter mathematical model is structured through the mathematical representation of its configuration and interaction with the sealing liquid; the application of characterizing relationships of the fluid's behavior; the analysis and calculation of the set's static interactions; and, the analytical integration of all those factors that will finally describe and allow determining the functional characteristics of the MGCH meter.
Due to the complex nature of the model, a program known as SDIMECH (Software para el Diseño de Medidores de Gas Tipo Cámara Húmeda) was developed for the authors to facilitate the analysis of the variables involved in the meter's design. This software provides a graphical display of the form of the high and low pressure areas, as generated by the intersection of the drum with the liquid level for any angle of rotation. The variation of the liquid level as a consequence of the change in the level of the area exposed to pressure; and, the behavior of the floating torque, the drag torque by pressure and the drag torque by friction, all applied either on a plate or on the set of plates that make up the drum throughout the rotation cycle. Likewise, it allows determining the pressure fall across the drum against its own rotation, thus becoming an indispensable tool for the projection of a MGCH meter.
Next, the results from the modeling applied to the design of a MGCH of 10 l/Rev are displayed.
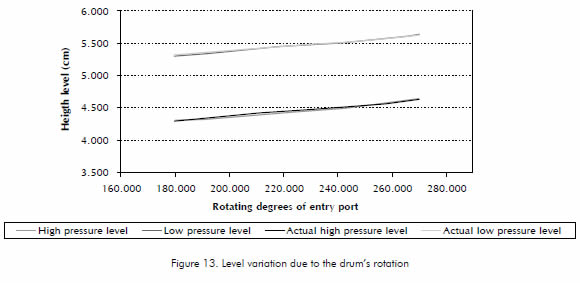
Level variation due to drum rotation
One of the parameters needed for the design of a meter is the knowledge of the behavior of high and low pressure levels, since depending on these levels the meter's volume shall be determined, as well as its influence on the equipment's operational errors. The modeling provides this information for all the rotation cycle, reflecting a height difference between the levels, which basically depends on the pressure fall across the meter (Figure 13).
The effect produces by the liquid which sticks to the surfaces of the chamber when no longer is submersed, was neglected not only for low flow rate, because low rotational velocities provide enough time to drain the adhered liquid, but also for high flow rate, because the liquid sticks to the surface is less significance in the error.
Likewise, the magnitude of these variations becomes visible, making the design's quantitative elements available.
Forces acting on the drum
It is possible to establish the forces that originate as a consequence of the drum's movement inside the sealing liquid, which may be analyzed independently for each of the plates that make up the drum. Alternatively, the total effect may also be analyzed.
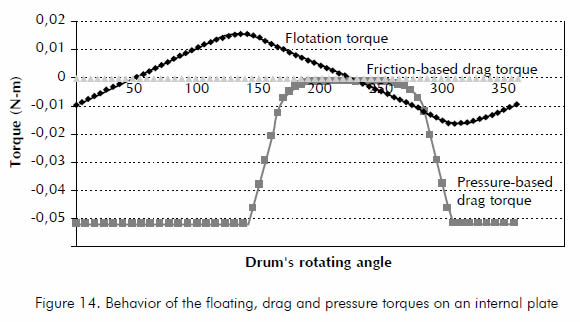
Figure 14 shows little incidence of the drag force by friction on the internal plate, which contrasts with the strong effect of the drag forces by pressure and the floating force. The latter is characterized for its changes in direction. On the other hand, the drag force by pressure, always heads into the opposite direction of the rotation. The analysis of these factors facilitates the adjustment of the drum's configuration, searching for a design with the most continuous characteristics possible in its rotation.
Figure 15 shows the total effect of drag and floating forces upon each of the plates when these are assembled to form the drum. It is natural for each one to have a similar curve; however 90 degrees off phase among them, obtaining a drum whose dynamic rotation characteristics are represented by a sinuous curve. This behavior is evident in the operation of this type of meters.
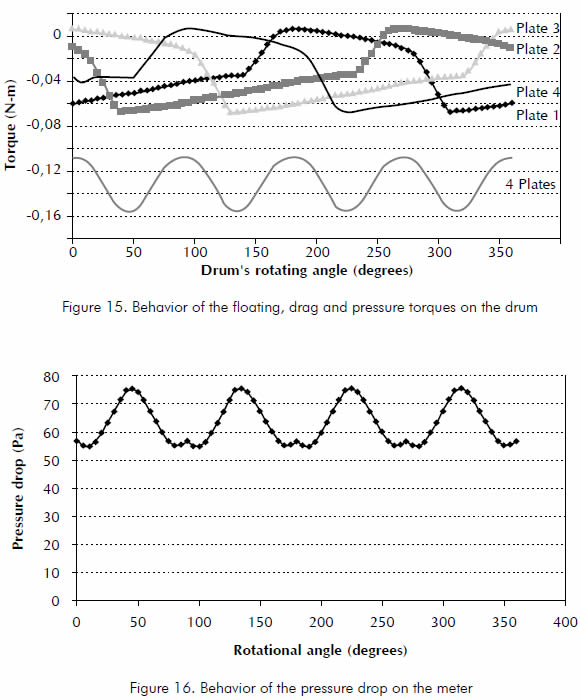
The aforementioned results may be related in terms of pressure falls across the meter. Figure 16 shows the equipment pressure variation; the sinusoidal behavior for this design is characterized by its low amplitude and, therefore, by its low incidence on the measurement process.
CONCLUSIONS
- The most important variables necessary for the design and analysis of a MGCH meter and the relation among them were established.
- Among the factors involved in pressure difference between input and output gas along the meter, the drag force by friction is the less significative and the drag force by pressure is the most significative.
- The behavior of the pressure difference inside the meter, represented by a sinuous curve, analytically established corresponds with the behavior experimentally observed when a MGCH is in operation.
ACKNOWLEDGEMENTS
Our deepest gratitude to the Trials and Measurements Lab of the Gas Technology Development Center at the Universidad Industrial de Santander – Bucaramanga, whose collaboration was of great importance for the achievement of the set objectives.
To Roberto Arias Romero, Engineer, Chief of the Fluids Metrology Division of Mexico's National Metrology Center, for his priceless technical recommendations.
BIBLIOGRAPHY
Asme, 1971. "Fluid meters, their theory and application". Asme, New York, 38 pp. [ Links ]
Fox, R. W., 1997. "Introducción a la mecánica de fluidos". McGraw Hill, México, 916 pp. [ Links ]
Holman, J. P., 1996. "Experimental methods for engineers". McGraw Hill, New York, 145pp. [ Links ]
Pytel, A. and Kiusalaas, J., 1999. "Ingeniería mecánica estática". 2nd Edition, Thomson, México. [ Links ]

