


Services on Demand
Journal
Article
 English (pdf)
 Article in xml format
 Article references
 Send this article by e-mail
Indicators
-
 Cited by SciELO
 -
 Access statistics
Related links
-
 Cited by Google
 -
 Similars in
SciELO
Similars in
SciELO -
 Similars in Google
Share

 Permalink
CT&F - Ciencia, Tecnología y Futuro
Print version ISSN 0122-5383On-line version ISSN 2382-4581
C.T.F Cienc. Tecnol. Futuro vol.3 no.2 Bucaramanga Jan./Dec. 2006
Oscar-Fernando Muñoz1, Freddy-Humberto Escobar2, and José-Humberto Cantillo3
1,2 Universidad Surcolombiana, Programa de Ingeniería de Petróleos, Grupo de Investigación en Pruebas de Pozos, Neiva, Huila, Colombia. e-mail: fescobar@usco.edu.co
3 Ecopetrol S.A.- Instituto Colombiano del Petróleo, A.A. 4185 Bucaramanga, Santander, Colombia. e-mail: jose.cantillo@ecopetrol.com.co
(Received Jul. 24, 2006; Accepted Oct. 19, 2006)
ABSTRACT. The state-of-the-art of gas condensate well tests for pressures below the dewpoint are basically based upon a two-zone composite radial model, which consists of a near-wellbore region having liquid condensation and a monophasic flow zone with no gas condensate saturation.
Information obtained from laboratory tests suggests the presence of three zones having different fluid mobilities: (1) a far region from the well with initial liquid condensate saturation of zero, (2) a near wellbore zone having an increased condensate saturation and a reduced gas mobility, and (3) an intermediate zone from the well with both high capillary and increasing gas relative permeability which leads to gas mobility restoring due to condensate blocking. The gas condensate saturation is higher than its critical value, then the condensate phase is mobile.
In this study, both the rapid flow and capillary number effects on gas condensate reservoirs from well pressure test data are dealt with. We observed that the nondarcy effect originates additional pressure drop which is proportional to the flow rate while, the capillary number causes a reduction of condensate saturation in the near wellbore area and the reservoir providing a negative skin factor which contributes to fluid mobility, and therefore, production. Besides that, we also included the possitive coupled effect, defined here as the simoultaneous action of nondarcy flow and capillary number; which is more relevant at relatively low gas rates. We found out that the capillary number dominates the nondarcy effect leading to a reduction in condensate saturation.
Keywords: nondarcy flow, interfacial tension, capillary phenomenon, gas condensate reservoir.
RESUMEN. Los trabajos publicados para el análisis de pruebas de presión en yacimientos de gas condensado cuando la presión cae por debajo de la presión de rocío son basados fundamentalmente en un modelo radial compuesto de dos zonas, el cual representa la región de formación de líquido alrededor del pozo y una zona de flujo monofásico con saturación de líquido condensado igual a cero.
Los experimentos de laboratorio sugieren que existen tres zonas con diferente movilidad: 1) una zona lejana al pozo, con saturación inicial de líquido condensado, 2) una zona cercana al pozo, en donde se incrementa la saturación de condensado y disminuye la movilidad del gas y 3) una zona inmediata a la vecindad del pozo con alto número capilar e incremento en la permeabilidad relativa al gas, resultando en una recuperación de la movilidad del gas debido al bloqueo por condensado. La fase de condensado es móvil, la saturación de condensado es mayor que la saturación crítica de condensado.
En este trabajo se investigan los efectos de flujo no darcy y número Capilar en yacimientos de gas condensado a partir de pruebas de presión. Se determinó que el efecto de flujo turbulento causa una caída de presión adicional proporcional al caudal de flujo; el efecto de número capilar reduce la saturación de condensado alrededor del pozo y en el yacimiento. Adicionalmente se analiza el efecto positivo acoplado (Flujo no darcy y número Capilar) el cual es más relevante cuando se tienen caudales relativamente bajos de gas, el efecto de número capilar domina el efecto de flujo no darcy reduciendo la saturación de condensado.
Palabras clave: flujo no darcy, tensión interfacial, fenómenos capilares, yacimientos de gas condensado.
INTRODUCTION
The existence of the two-phase system leads to a complex behavior of gas condensate reservoirs (Xu & Lee, 1999a; Xu & Lee, 1999b; Raghavan et al., 1995; Gringarten et al., 2000). Besides, three markly different regions possessing a defined contrast of fluid mobilities are formed in this type of systems when liquid formation takes place once reservoir pressure falls below the dewpoint pressure as sketched in Figure 1. The farthest region from the well presents an initial liquid saturation. A sharp change in liquid saturation, although still immobile, with a consequent gas relative permeability reduction is presented in the intermediate region. In the near wellbore region, both liquid and gas phases flow simultaneosly with constant composition since the critical liquid saturation is reached. These three regions can be identified from a well test as three zones with different permeabilities.
During a well test interpretation for condensate reservoirs, the rapid flow effect is closely related to the high flow velocities in the near-wellbore zone, where the highest pressure drop takes place originating nondarcy flow which causes an additional pressure drop, reflected as a skin factor. Capillary forces control the behavior of the condensed fluid around the wellbore. Low interfacial tensions originate an increment in the amount of oil recovered and a decrement of oil saturation, even below the critical value. Therefore, capillary number controls relative permeability, at least, in the range of saturation where the relative permeability is low.
This paper deals with the effect of both nondarcy flow and capillary number effects on well test interpretation for gas condensate reservoirs. We present a synthetic example generated with a compositional commercial simulator to verify the existence of the three zones with different fluid mobilities as described in previous works (Fevang & Whitson, 1995; Li & Engler, 2001) by pressure transient analysis considering the identification of the relative permeability behavior in the near wellbore area.
RAPID FLOW EFFECTS
Nondarcy flow effect is represented as a rate-dependent pseudoskin, in conventional analysis, defined by Jokhio (2002):
SnD = D * q (1)
Being D a constant known as nondarcy flow coefficient, given by Jokhio ( 2002):
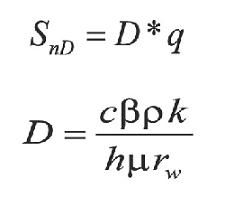 (2)
(2)
The total skin, S, takes into account the mechanical skin plus the apparent skin factor, such as (Jokhio, 2002):
S´ = S + D * q (3)
Where S and D have to be estimated from two different flow tests. In cases of existing only a single pressure test, ß is estimated by means of empirical correlations (Li & Engler, 2001) and the nondarcy flow coefficient is found from Equation 2. Finally, pseudoskin is calculated using Equation 3.
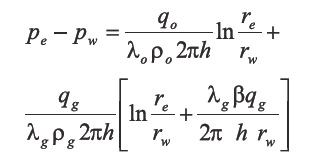
Applying Forchheimer´s Equation to flow of a condensate gas with nondarcy effect, the resulting relationship is:
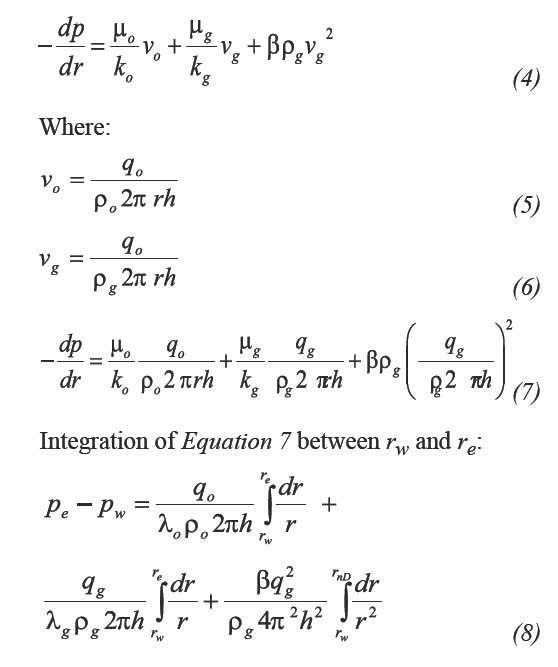
The last right-hand side term in Equation 8 is integrated between rw and rnD (nondarcy flow radius) because this region is affected by rapid flow effects. Then, Equation 8 becomes:
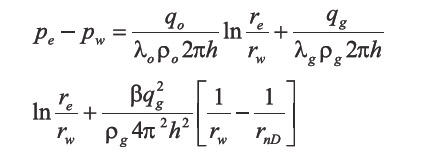 (9)
(9)
Since rnD >> rw, then, Equation 9 reduces to:
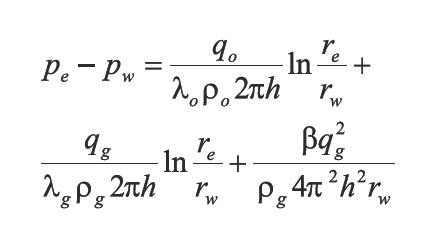 (10)
(10)
By an analogy with the application of Darcy’s law, it is posible to observe that the last term on the right-hand side of Equation10 represents an additional pressure drop caused by rapid flow.
 (11)
(11)
The nondarcy flow coefficient can be expressed as:
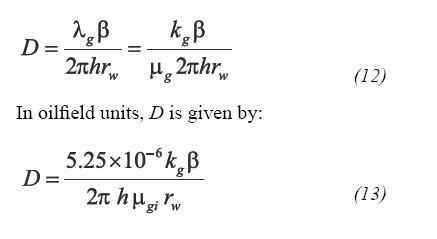 (12)
(12)
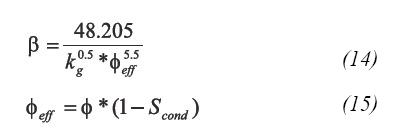
Being Scond the condensate saturation.
Capillary number effect
Relative permeability of a given phase flowing through a porous medium is a function of its saturation, capillary number, wettability and pore structure. Besides, relative permeability and critical saturation are sensitive to both flow rate and interfacial tension (Jokhio, 2002). High interfacial tension causes a decreasing in relative permeability with an increasing in fluid saturation.
The capillary number relates fluid velocity and viscosity (viscous forces) to interfacial forces, according to:
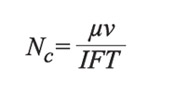 (16)
(16)
Relevant capillary numbers on well deliverability are dependent of flow rate, fluid type, and well-flowing pressure, Pwf. Typical capillary numbers range from 10-6 to 10-3.
The flow rate dependence with relative permeability can be explained based upon the relationship between capillary and viscous forces. Wells with higher pressure drop drain more condensate.
Another capillary number definition can be obtained from the rock properties as:
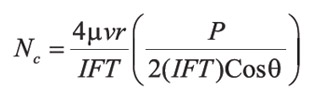 (17)
(17)
Being P an experimental threshold pressure for fluid invading the porous medium and r is the drainage radius. High capillary number values, Nc > 1, is an indication of viscous forces dominating the flow.
RESULTS OF THE COMPOSITIONAL SIMULATION STUDY
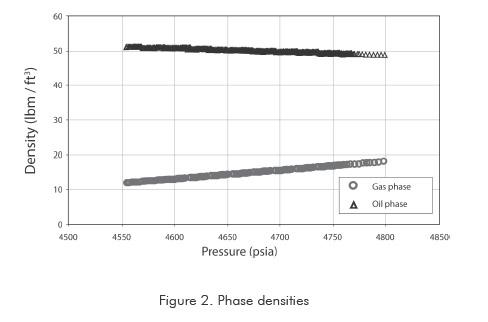
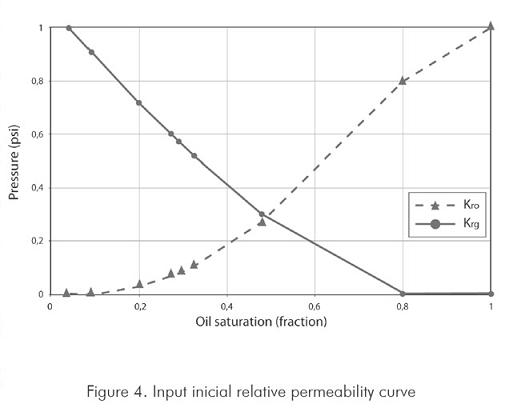
Here, a synthetic example generated by a compositional simulation model is presented to both verify the existence of three zones with different mobilities as described by previous researchers (Fevang & Whitson, 1995; Li & Engler, 2001) and predict the pressure derivative behavior expected from a transient pressure well test. To achieve this goal, the commercial simulator generates PVT properties (Figures 2 and 3) using the Peng-Robinson Equation of State (EOS). Additionally, the variation of the gas and liquid relative permeabilities as a function of rapid flow and capillary number is included. The initial set of relative permeability curves is provided in Figure 4.

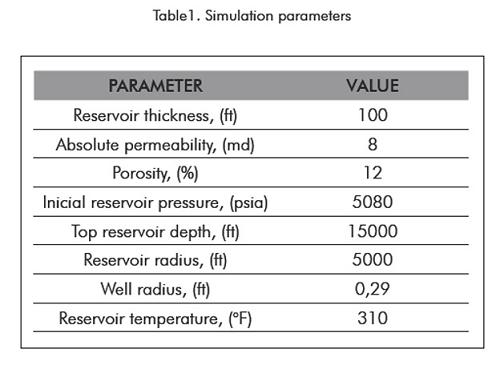
The simulation model consists of a single vertical well located at the center of a radial, homogeneous reservoir which characteristics are provided in Table 1. The model possesses 150 logarithmic cells with a 5000 ft reservoir radius to reduce the boundary effects on the well pressure behavior. A local grid refinement was applied in the near-wellbore region to precisely capture the liquid formation. The model does not consider neither wellbore storage nor skin effects.
The simulation runs were designed to observe the reservoir behavior under different flow conditions (Figure 5). For all cases, the initial reservoir pressure is higher than the dewpoint pressure to guarantee the existence of a monophasic flow zone (region III). It can be observed there that the pressure drop is directly proportional to the flow rate. A possitive effect of the capillary number on the pressure can be seen in Figure 6; a low pressure drop is obtained.
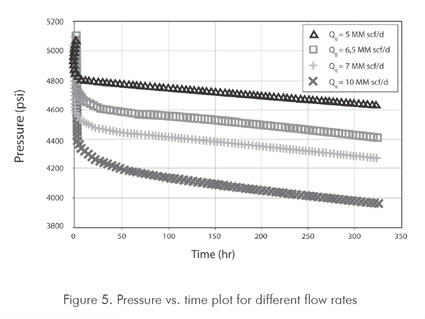
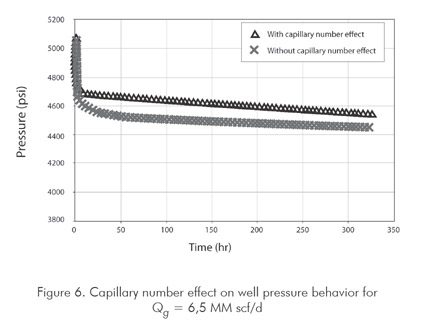
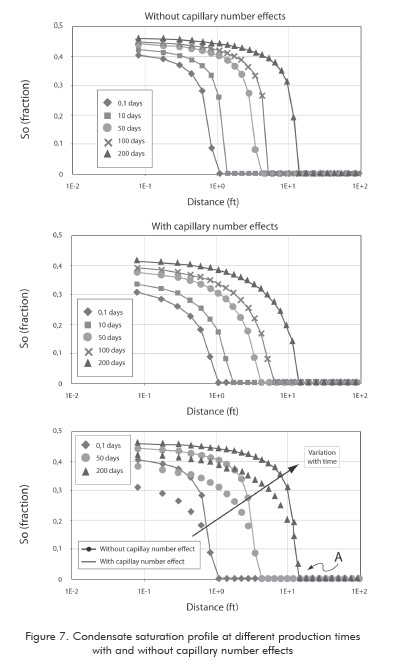
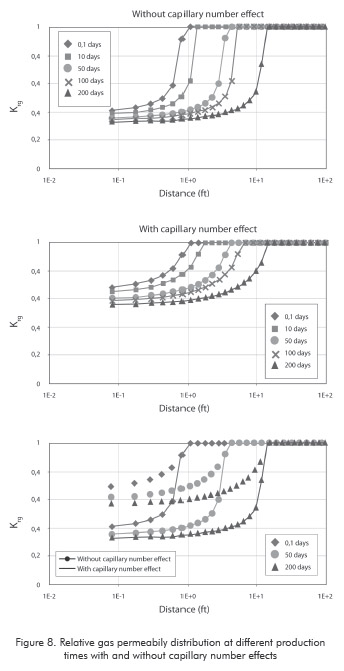
Figure 7 shows the liquid accumulation around the well as a function of oil saturation with and without capillary number effects. Condensate saturation around the well and the reservoir is reduced by the capillary number effect. The same dewpoint pressure is obtained for each time level no matters the effect of capillary number. As production time increases, the condensate bank also increases and the saturation forms a ring-shaped zone around the well. At point A, pressure is equal to dewpoint pressure and the gas condensate saturation has a zero value. The respective gas relative permeability is shown in Figure 8, where the maximum value (krg=1) corresponds to the monophasic flow zone. It is also observed in this plot that relative gas permeability decreases as production time increases. The capillary number effect leads to an increase of the gas relative permeability around the well and the whole reservoir, as well.
The pressure and pressure derivative curves obtained from the simulation are provided in Figure 8 in terms of two-phase pseudopressure with and without capillary number effect. As expected, after the liquid reaches its critical saturation value and gas and liquid flow simoultaneously with constant composition, mobility decreases when the capillary number effect is not taken into account.
For high capillary number, the pseudopressure derivative displays three stabilization periods. In the provided example, differences among the stabilizations are very small as a consequence of the high flow capacity (kh); low capacity values are represented by high stabilization contrasts. The first stabilization period is observed at early times and corresponds to monophasic flow (zone III). The tiny pseudopressure derivative increment corresponds to region II where condensate saturation increases. At late times, the last stabilization, region I, is observed in which both gas and liquid phases are unmobile (Figure 9).
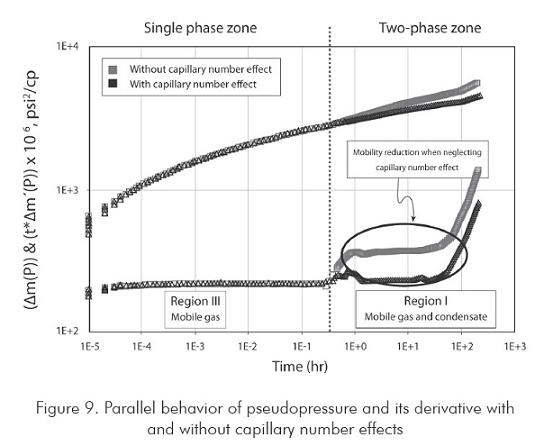
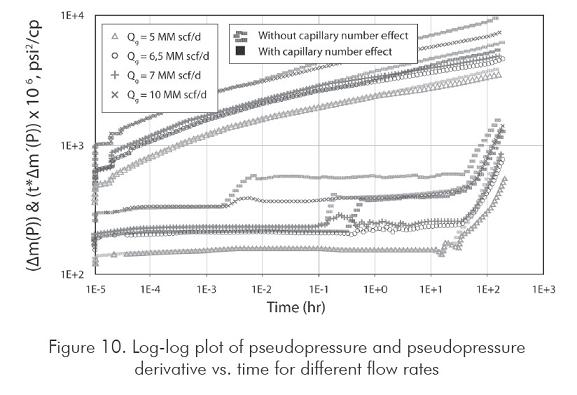
Figure 10 compares pseudopressure and pseudopressure derivative curves for different simulated flow rates. It can be observed that the higher the production rate, the lower the monophasic radial flow regime. Besides this, at low flow rates (5 MMscf/day, for the current example) reservoir pressure lies always above the dewpoint pressure, therefore, no liquid condensation takes place.
Possitive coupled effect
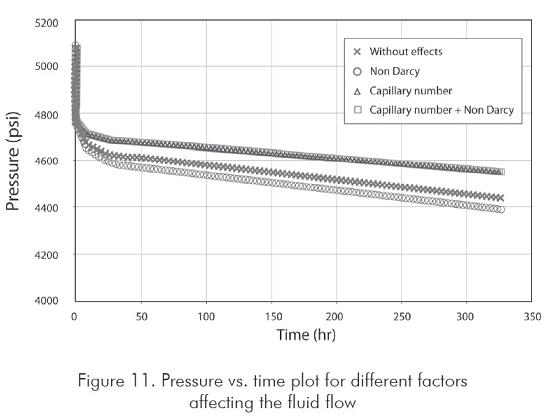
For the last simulation runs the model was modified to include the comingle effect of both capillary number and nondarcy flow. Figure 11 displays the pressure vs. time data for these two effects. There can be observed how the additional pressure drop caused by rapid flow effects is compensated by the capillary number effect. In this plot, a small variation among the curves with capillary number and coupled possitive effect (Capillary number + nondarcy) can be noted.
The coupled flow effect due to high flow velocities is represented by the liquid saturation profile of Figure 12 and the gas relative permeability curve of Figure 13. As a result of the high flow velocity, the condensate saturation is reduced in the near-wellbore region. This effect is overestimated when the capillary number effect is neglected.


The simulated example demonstrates the gas relative permeability dependence on the combined capillary and rapid flow effects. The gas mobility substantially improves when the capillary number effect is considered as can be seen in Figure 13.
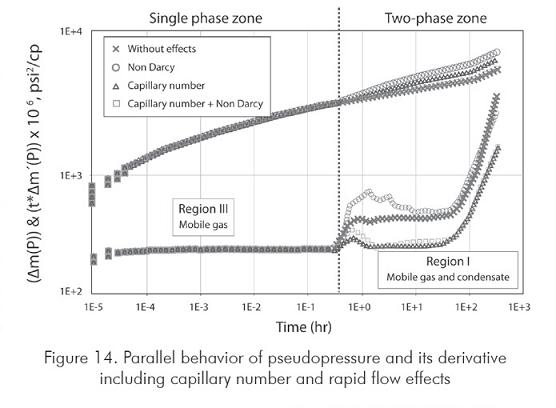
Finally, Figure 14 allows for a comparison of pseudopressure and pseudopressure derivative considering nondarcy flow, capillary and coupled effects. As observed there, the capillary number effect compensates the negative effect on phase mobility associated with nondarcy (rapid) flow effects. The combination of these two effects generates a reservoir productivity balance which is reflected in the pseudopressure derivative curve.
CONCLUSIONS
• A reduction of condensate saturation around the wellbore and the whole reservoir is caused by the capillary number effect. As production time increases, the condensate bank decreases and the saturation takes a ring-shaped form around the well.
• Gas relative permeability depends upon the commingled effects of capillary number and rapid (nondarcy) flow.
• In gas condensate reservoirs, the formed liquid bank around the well as the pressure falls below the dewpoint pressure creates three reservoir zones with different condensate saturation. High condensate saturation causes a reduction of effective gas permeability resulting in a severe production decline which can be also reduced by either producing at high flow rates and/or having low capillary forces. Low condensate saturations in the near-wellbore region causes an increase of gas relative permeability (effect of capillary number). On the other hand, high gas flow rates induce inertial effects which also reduce well productivity. The combination of both effects (rapid flow + capillary number) has been called here as “Possitive Coupled Effect”.
• The synthetic example presents three different-mobility stabilization regions as displayed on the pseudopressure derivative curve, as follows: a) a monophasic flow zone with Scond=0, b) a near wellbore zone where condensate saturation increases and gas mobility decreases, and, c) an intermediate zone around the wellbore with high capillary number and increased gas relative permeability causing gas mobility restoration by condensate blocking. The observed differences among the stabilization zones are a function of the flow capacity, kh. Low flow capacities are represented by high stabilization contrasts.
ACKNOWLEDGMENTS
The authors gratefully acknowledge the financial support of the Instituto Colombiano del Petrsleo (ICP), under the mutual agreement Number 008-2003 signed between this institution and Universidad Surcolombiana (Neiva, Huila, Colombia).
REFERENCES
Fevang, O., & Whitson, C. H. (1995). Modeling gas condensate well deliverability. SPE Annual Technical Conference and Exhibition, Dallas, Texas, Oct. 22-25. SPE 30714. [ Links ]
Gringarten, A. C., Al-Lamki, A., Daungkaew, S., Mott, R., & Whittle, T.M. (2000). Well test analysis in gas-condensate reservoirs. SPE Annual Technical Conference and Exhibition, Dallas, Texas, Oct. 1–4. SPE 62920. [ Links ]
Jokhio, S. A. (2002). Production performance of horizontal wells in gas-condensate reservoirs. Ph.D. Dissertation, The University of Oklahoma, Norman, Oklahoma, USA. [ Links ]
Li, D., & Engler, T. W. (2001). Literature review on correlations of the nondarcy coefficient. SPE Permian Basin Oil and Gas Recovery Conference, Midland, Texas, May 15–16. SPE 70015. [ Links ]
Raghavan, R., Wei-Chun, Ch., & Jones, J.R. (1995). Practical considerations in the analysis of gas-condensate well tests. SPE Annual Technical Conference and Exhibition, Dallas, Texas, Oct. 22-25. SPE 30576.
Xu, S., & Lee, W. J. (1999a). Gas condensate well test analysis using a single-phase analogy. SPE Western Regional Meeting, Anchorage, Alaska, May 26–28. SPE 55992. [ Links ]
Xu, S., & Lee W. J. (1999b). Two-phase well test analysis of gas condensate reservoirs. SPE Annual Technical Conference and Exhibition, Houston, Texas, Oct. 3–6. SPE 56483. [ Links ]

