


Services on Demand
Journal
Article
 English (pdf)
 Article in xml format
 Article references
 Send this article by e-mail
Indicators
-
 Cited by SciELO
 -
 Access statistics
Related links
-
 Cited by Google
 -
 Similars in
SciELO
Similars in
SciELO -
 Similars in Google
Share

 Permalink
CT&F - Ciencia, Tecnología y Futuro
Print version ISSN 0122-5383On-line version ISSN 2382-4581
C.T.F Cienc. Tecnol. Futuro vol.3 no.2 Bucaramanga Jan./Dec. 2006
Carlos-A. Baldrich Ferrer1 and Luz-Ángela Novoa Mantilla1
1 Ecopetrol S.A. – Instituto Colombiano del Petróleo, A.A. 4185 Bucaramanga, Santander, Colombia. e-mail: Carlos.Baldrich@ecopetrol.com.co
(Received May 26, 2006; Accepted Nov. 22, 2006)
ABSTRACT. It is described an analytical method to characterize a diesel sample in a three minutes period using a portable infrared analyzer. The new models incorporated in the equipment were developed using the software of the equipment and analytical data generated in Instituto Colombiano del Petróleo (ICP), Ecopetrol S.A. labs. Based on this technique it is possible to obtain information about total aromatic content, sulphur content, polynuclear aromatic content and distillation temperatures in a diesel fuel sample. According to the validation results that showed some error bigger than the reproducibility of the original methods, it is recommended to use the proposed method as a semi quantitative one.
Keywords: chemometrics, analyzer, infrared spectroscopy, property.
RESUMEN. Se describe un método analítico que utiliza un analizador infrarrojo portátil para caracterizar una muestra de diesel en tres minutos. Los nuevos modelos incorporados en el equipo fueron desarrollados utilizando el software de éste a partir de muestras caracterizadas en los laboratorios del Instituto Colombiano del Petróleo (ICP), Ecopetrol S.A. Mediante esta técnica es posible obtener información sobre el contenido de aromáticos totales y aromáticos polinucleares, el contenido de azufre y la curva de destilación de una muestra de diesel. Dado que los errores observados en la validación superan en algunos casos la reproducibilidad de los métodos de origen, se recomienda el uso de la técnica a nivel semicuantitativo.
Palabras clave: quimiometría, analizadores, espectroscopía infrarroja, propiedades.
INTRODUCTION
The main application of infrared spectrophotometry in product characterization of petroleum is related to light and medium fractions, although also applications for heavy and residual fractions are reported. (Lysaght, Jeffrey, & Callis, 1993; ZaNier et al., 1999; Fodor & Kohl, 1993).
In the market diverse types of infrared process analyzers exist, that allow to determine properties of gasoline, diesel fuel and heavy fractions. Typically these are Fourier transform spectrophotometers that operate in the region of the near infrared and uses optical fiber to send the exciting beam to the cell of process where the sample is contained and to collect the signal coming from it.
There are different types of infrared process analyzers in the market that allow the determining of properties of gasolines, diesel and heavy fractions. The cost of these type of equipments is high and because of that their use is not generalized.
Additionally are portable analyzers that operate with filters which allow the analysis in a fast form of certain products. As a general rule, each instrument has a specific application and the models are developed in the factory but must be updated with fuels of the region where the analyzer is going to be used in order to get accurate data. This type of equipment is less expensive and is provided with software that allows the developing of new applications.
The present study evaluates the development of new applications for diesel fuel characterization with a portable analyzer. Properties different to the typical ones included in this type of analyzers like sulphur and light cycle oil content, flash point and distillation curve are modelled.
THEORETICAL
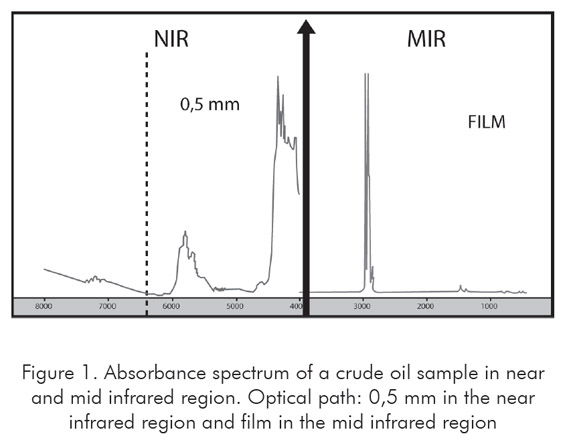
In the region of the near infrared that covers interval 12800 to 4000 cm-1 appear the absorption bands corresponding to overtones and combinations of vibrations of bonds C - H, Or - H and N - H. A spectrum in the region of the near infrared is much less intense and with smaller number of absorption bands than a conventional spectrum in the region of the mid infrared (4000-400 cm-1). Given the high intensity of the absorption bands in the mid infrared, the thickness of the cells in equipment that operates in this region, it is much smaller than the used one in analyzers of the near infrared (Pasquini, 2003).
In Figure 1 the infrared spectrum of a crude oil sample in the mid infrared region appears at the right side and the one in the near infrared region appears at the left side. Although the spectrum in the near infrared region was taken in a cell with an optical path 50 times longer than the one used for taking the spectrum in the mid infrared region, the most important bands appearing in the near region are lower in intensity than the most important bands showing up in the mid region. Also, the peaks in the mid region are sharper than those of the near region.
The detailed characterization of the diesel fuel involves the accomplishment of multiple analyses which imply the use of an expensive infrastructure of equipment, require of specialized personnel and use a considerable volume of sample.
The use of chemometric techniques based on the analysis of the infrared spectrum constitutes an interesting alternative that allows predicting several properties in fast and simultaneous form, using a volume of sample as small as 10 ml. Given the economic potential of this technology, all the developments of predictive models are protected by patents and they have not become methods standard available (see US Patent 5475612, 3693071).
A wide variety of infrared analyzers that operate predominantly in the region of the near infrared where great amount of predictive models of properties for diverse types of petroleum fractions has been developed. There are applications with Fourier Transform (FTIR) and filters equipments. The filter instruments are of low cost and allow the development of robust applications for laboratory and field. The Fourier transform equipments are the recommended ones when investigations are made and where transferences of calibrations are required (Fearn, 2001).
In the market several options of portable analyzers are offered that allow the fast characterization of light and middle distillates. The most used are the filter equipments that are developed for dedicated applications. Between these it could be mentioned the Zeltex analyzer of gasolines that has 14 interference filters and 14 emitting diodes of signal in the region of the Near Infrared (NIR) (Pasquini, 2003) and the Petrospec analyzer (Croudace, 2001). The Zeltex analyzer does not have thermal control thus, to avoid the effect of the changes of temperature on the signal (shifts of position and relative intensity of the bands), it is necessary that the calibration with standards be made at several temperatures to model the effect of this variable on the predictive models (Blanco, 2004).
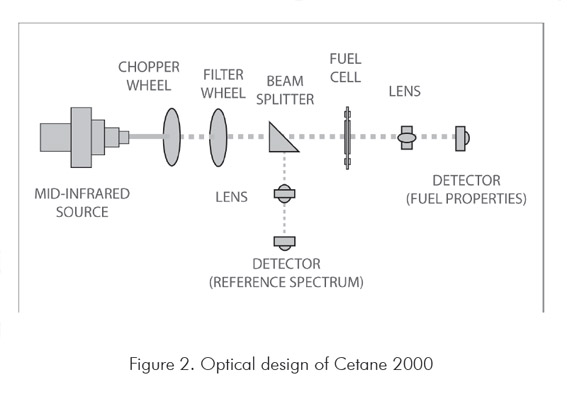
The Petrospec analyzer Cetane 2000 that is used in the present study is an analyzer of 14 filters most of them located in the region of the mid infrared. The thickness of the cell of sample is of 200 microns. The optical bank is thermostated to 38ºC (311,15 K) eliminating changes of temperature effects on the models. The wavelengths of the light that allows passing each one of the filters are an industrial secret of the manufacturer but it is known that some of them allow the passage of energy of the region of the near infrared and others of the mid infrared.
The optical design of the analyzer appears in Figure 2. The filters are in a wheel that is turned through chopper. The signal is sent later to a beam splitter that sends part of ray to the reference detector and part crosses the cell with sample and goes to the detector. The absorbance in a given filter is obtained comparing the signals of both detectors.
The machine uses the Petrospec R software that allows developing all the calibration models. The fundamental principles of operation of this software were described previously by Baldrich and Novoa (2005). The calibration models are calculated using the mathematical procedure called Multi-Linear Regression (MLR) analysis. The models have the form:
Px = M0 + M1*F1 + M2*F2 + … + Mz*Fz (1)
Where:
Px is the component concentration or value for property x
Fz is the absorbance value obtained from filter z
Mz is the parameter estimate for filter z calculated using MLR analysis.
M0 is the intercept for the model.
The Mz and M0 values constitute the calibration model used for predicting the parameter Px for a sample using the absorbance data Fz. To calculate the calibration model, an equation is written for each sample in the calibration set by substituting the component concentration or property value for Px (the dependent variable) and the absorbance values for Fx (the independent variables). The MLR analysis is used to calculate the values for Mz and M0 that represent the best solution for the set of calibration equations. The best solution is obtained by minimizing the difference between the Px values obtained using standard methods (observed value) and the Px values obtained by substituting the Mz, M0, and Fz values into Equation 1 and solving for Px (estimated value).
A calibration model is used to transform spectroscopic data acquired from a sample into a prediction of a physical property value or component concentration for the sample.
In the present study are shown the developments made in the Spectroscopy laboratory of Ecopetrol S.A - ICP in the extension of predictive models included in an analyzer Cetane 2000, that allow to predict in a diesel fuel the sulphur content, the distillation curve, the flash point, the total aromatic and the poliaromatic contents.
EXPERIMENTAL PART
Used samples. For the development of the predictive models for total aromatic and polyaromatic content there were selected the following types of samples obtained in the atmospheric distillation units of the Crude Oil distillation and Evaluation laboratory of Ecopetrol S.A. – ICP following the ASTM D2892 standard procedure:
- Kerosene (171 – 248 °C) (444,15 – 521,15 K)
- Light Diesel (248 – 315 °C) (521,15 - 588,15 K)
- Heavy Diesel (315 – 371°C) (588,15 - 644,15 K)
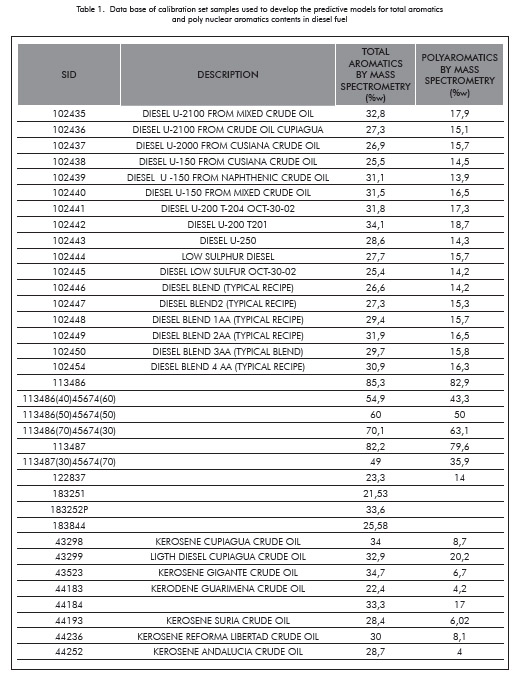
The aromatic content in each one of these samples was determined by high resolution mass spectrometry coupled to gas chromatography following a method developed in Ecopetrol S.A. – ICP Spectroscopy laboratory that uses the matrix of developed by Fisher and Fisher (1974). The total aromatic contents that are reported correspond to the sum of mono, di, tri and tetra aromatic; the poly aromatic contents corresponds to the sum of di and more complex aromatics. Table 1 summarizes the data base used for the generation of the predictive models of total aromatic and poly nuclear aromatics. The Sample Identification (SID) corresponds to the record for the identification of each sample.
For the preparation of samples of diesel fuel similar to those fuels produced in the Barrancabermeja Ecopetrol S.A. refinery the different streams making part of the pool of diesel fuel were sampled and blended following typical recipes. These streams are identified in this table with the crude oil distillation unit where it was obtained (U2000, U150, U200, U250) and the number of the process tower (T201, T204).
The development of predictive models of distillation, sulphur content and flash point was made with samples of finished fuel and streams making part of the pool of diesel fuel, coming from the refinery of Ecopetrol S.A. in Barrancabermeja.
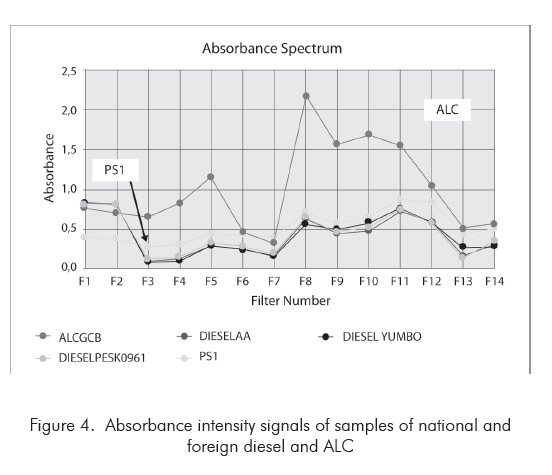
For the development of the predictive model of the Light Cycle Oil (ALC - stands for Aceite Liviano de Ciclo) content in the diesel fuel there were prepared standards of known ALC content using different samples of straight run diesel fuel in order to reduce possible matrix effect interferences. The reading of these samples was made the day after its preparation to avoid possible changes in the diesel fuel by effect of the ALC.
For the development of the models all the selected samples were read as standards in the analyzer Cetane 2000 and the models were generated with aid of software Petrospec R. This software use a multiple linear regression to generate the models.
The models were validated later using fuel samples of well-known properties that had not been including in the calibration of the equipment.
EXPERIMENTAL RESULTS
Figure 3 shows the type of absorbance intensities at the different filters obtained with some samples of diesel fuel. In order to obtain the predictive models of certain property, the absorbance data of all or some of the filters selected via the software of the equipment, is related with this property through a program of multiple linear regression with residuals analysis. The measured property is then related to the property predicted through graphs. When the relationship between the predicted and measured values follows a straight line, a consistent model is generated.
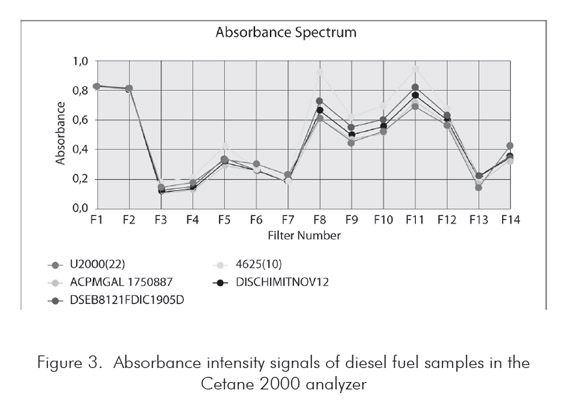
Figure 4 displays absorbance intensities of national diesel, diesel fuel included in the original data base of equipment (PS1) and ALC. Based on the observed differences between the absorbance signals of ALC and the diesel fuel it was decided to develop the predictive model of ALC in diesel engine.
Generation of models.
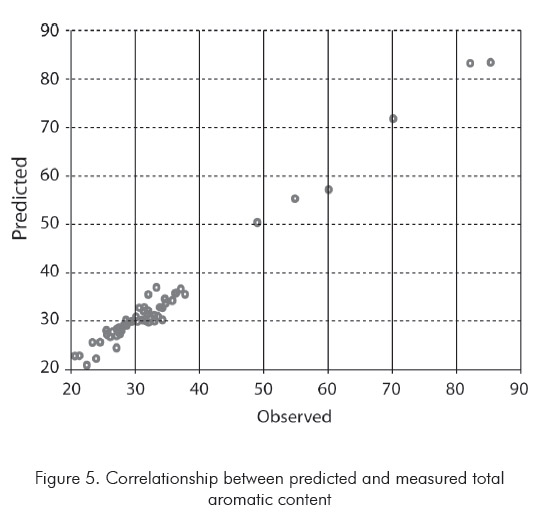
Figure 5 allows infer that the used technique can be applied to the prediction of the total aromatic content of the diesel engine. The correlation between the real value and the predicted value is linear in a wide range of measurement. The extreme samples of high aromatic content correspond to light cycle oil (ALC) that is a highly aromatic fraction that is obtained in the cracking catalytic process.
In Figure 6 it is possible to be observed that a linear relationship between the predicted and measured content of polynuclear aromatics exists.
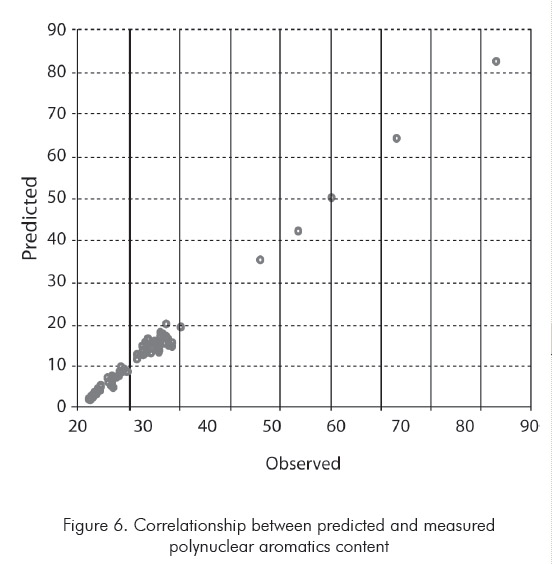
A very similar graph is obtained in the modelling of the content of ALC in diesel fuel.
Figure 7 displays the correlation obtained in the sulphur analysis in diesel fuel. Although this property normally is not included in the models offered by the factory, the linear relationship is very good.
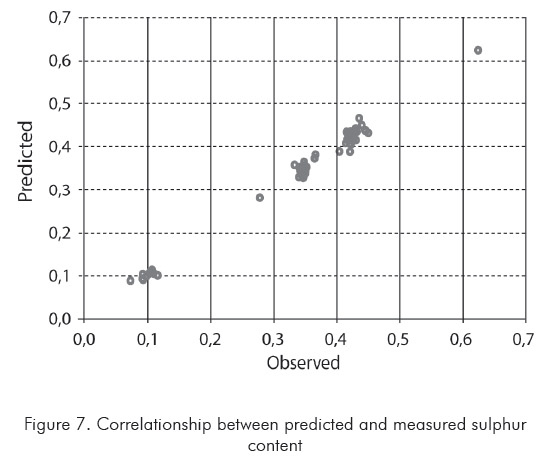
Table 2 summarizes the statistics parameters of the different predictive models generated for the analysis of diesel fuel and Table 3 shows the correlation coefficient between the properties and the filters of the analyzer.
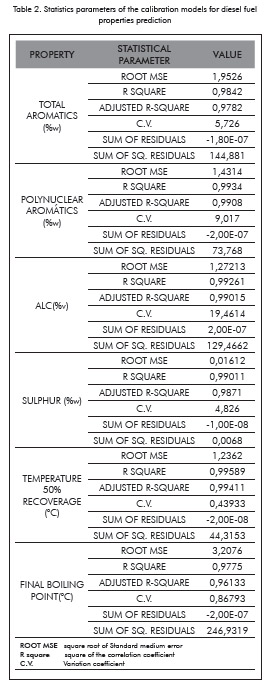
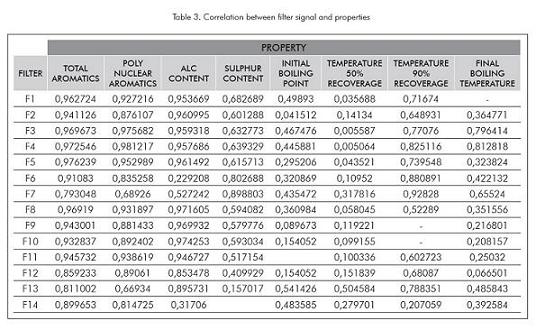
Aromatics are highly correlated with all the filters. ALC content is highly correlated with most of the filters and sulphur is highly correlated with filter 7 but most of the other filters are also correlated with this property. The correlations of the distillation data are lower than those obtained with the properties before mentioned being the temperature of 90% of recovery the one with better relationship with the absorbance intensities of the filters.
Models validation
Table 4 presents the comparative results of total aromatics and polynuclear aromatics contents of diesel fuel obtained by hydrocarbon type analysis by high resolution mass spectrometry and the proposed infrared method. The results demonstrate that the developed models allow predicting with good approach the content of aromatics (totals and polynuclear) of the samples used for the validation of these models. Nevertheless, the methodology could be used just a decision technique to control in a fast way the production process but could not be used as a standard test method to establish the quality of a product.
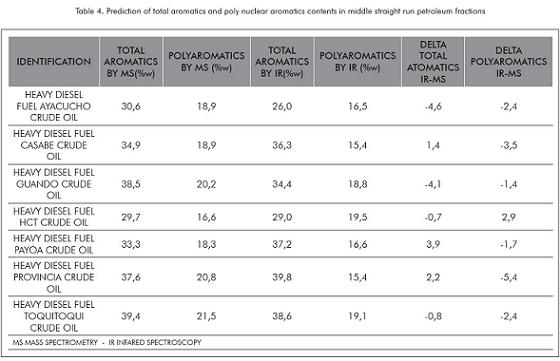
Table 5 shows the validation results of ALC content prediction in diesel fuel samples.
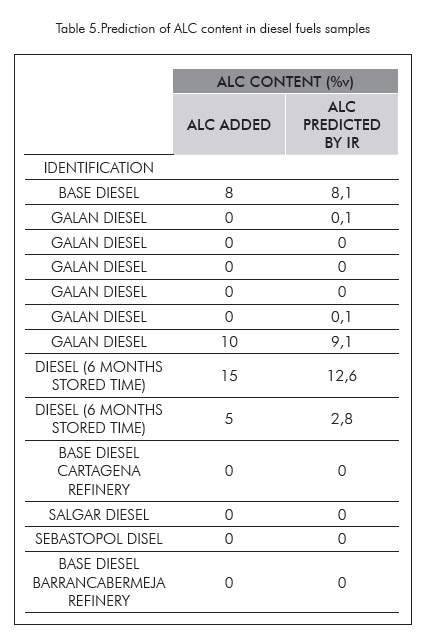
From the obtained results the good accuracy of the method for determining the content of ALC in diesel fuel can be observed. The model is very little sensible to the matrix since the prediction is good independent if the diesel fuel comes from the refinery of Barrancabermeja (GCB) or from the refinery of Cartagena (GRC).
The results of prediction on samples with long storage time indicate that the degradation of the ALC is slow and that the method can also be applied to samples with times of storage as long as six months. This method constitutes an interesting alternative to establish the origin of a fuel. The methodology is very simple and it is made on a sample without previous treatment showing great advantage on the analyses that involves extraction by column chromatography and later colorimetric analysis of the extract (Solly, 1990) or by more sophisticated methodologies like gas chromatography coupled to mass spectrometry. The times of analysis in these cases are longer and their costs are higher.
Table 6 summarizes the results obtained in the validation of the models of prediction of distillation curve and sulphur content in 9 samples of diesel fuel of coming from the Barrancabermeja Ecopetrol S.A. refinery.
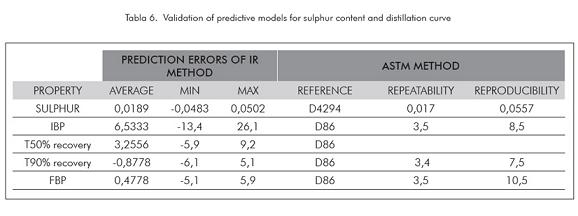
The referenced tabulated values indicate that the results obtained in the sulphur analysis in the diesel fuel produced by Ecopetrol S.A., are within the rank of reproducibility given in the ASTM D4294 standard.
The results of the distillation curve indicate that the results of IBP are far from the reproducibility of the ASTM method and because of that the results of this predicted parameter are just informative. The results indicate that the models fulfil the interval of reproducibility of final boiling point and temperature of 90% recovery.
CONCLUSIONS
• The results of the present study indicate that there is a high correlation between the content of aromatics and the signal that arrives to the detector in the used portable analyzer. The developed predictive models can be used to predict in fast way the aromatics content of diesel fuel samples.
• The results demonstrate that the technique is applicable to quickly establishment of the distillation curve of the diesel fuel.
• The technique can be used to establish the approximated sulphur content in the diesel fuel but to improve the precision of the prediction more samples in the calibration set must to be included.
• The use of these applications allows reducing substantially both time and cost of analysis of the diesel fuel thus the technique is suitable for controlling the quality of this product in refineries. In spite of that the proposed method could be used as a screening technique and not as a standard procedure of analysis to be use in product quality certification.
ACKNOWLEGMENTS
The authors thank to Technical Services Area of Ecopetrol S.A. – ICP for the supply of the characterized samples and for allowing the free access to the Spectroscopy lab for performing this study.
BIBLIOGRAPHY
Baldrich, C., & Novoa, L. A. (2005). Infrared spectrophotometry, a rapid and effective tool for characterization of direct distillation naphthas. CT&F - Ciencia, Tecnología y Futuro, 3 (1), 27-28. [ Links ]
Blanco, M. (2004). Influence of temperature on the predictive ability of near infrared spectroscopy models. J. Near Infrared Spectrosc., 12: 121-126. [ Links ]
Croudace, M. C. (2001). Analysis and Technologies for the 21st century. World Refining, 1-4. [ Links ]
Fearn, T. (2001). Standarization and calibration transfer for near infrared instruments: a review. J. Near Infrared Spectrosopy, 9: 229-244. [ Links ]
Fisher, I. P., & Fisher, P. (1974). Analysis of High boiling petroleum sterams by High resolution mass spectrometry. Talanta, 21 (8), 867 - 875. [ Links ]
Fodor, G. E., & Kohl, K. B. (1993). Analysis of middle distillate fuels by midband infrared spectroscopy. Energy and Fuels, 7: 598-601. [ Links ]
Lysaght, M. J., Jeffrey, J. K., & Callis, J. B. (1993). Rapid spectroscopic determination of per cent aromatics, per cent saturates and freezing point of JP-4 aviation fuel. Fuel, 72 (5), 623-631. [ Links ]
Pasquini, C. (2003). Near infrared spectroscopy: fundamentals, practical aspects and analytical applications. J. Braz. Chem. Soc., 14 (2), 12. [ Links ]
Solly, R. K. (1990). The use of simple rapid colorimetric techniques for measurement of light cycle oil content and relative storage stability of distillate fuels. Preprints ACS, 35 (4), 1215. [ Links ]
ZaNier-Szylowski, N., Quignard, A., Baco, D. F., Biguerd, H., Carpot, L., & Wahl F. (1999). Control of refining processes on mid-distilates by near infrared spectroscopy. Oil & Gas Science and Technology – Rev. IFP, 54 (4), 463-472. [ Links ]
US Patent 5475612. Method for the direct determination of physical properties of hydrocarbon products. [ Links ]
US Patent 3693071. Method for determining octane ratings for gasolines. [ Links ]

