


Services on Demand
Journal
Article
 English (pdf)
 Article in xml format
 Article references
 Send this article by e-mail
Indicators
-
 Cited by SciELO
 -
 Access statistics
Related links
-
 Cited by Google
 -
 Similars in
SciELO
Similars in
SciELO -
 Similars in Google
Share

 Permalink
CT&F - Ciencia, Tecnología y Futuro
Print version ISSN 0122-5383On-line version ISSN 2382-4581
C.T.F Cienc. Tecnol. Futuro vol.3 no.3 Bucaramanga Jan./Dec. 2007
PRESSURE AND PRESSURE DERIVATIVE ANALYSIS FOR VERTICAL GAS AND OIL WELLS IN STRESS SENSITIVE HOMOGENEOUS AND NATURALLY FRACTURED FORMATIONS WITHOUT TYPE-CURVE MATCHING
Analisis de la presión y derivada de presión para pozos verticales de gas y petróleo en formaciones homogéneas y naturalmente fracturadas sensibles a los esfuerzos
Freddy-Humberto Escobar1, José-Humberto Cantillo2 , and Matilde Montealegre-M.3
1,3Universidad Surcolombiana, Programa de Ingeniería de Petróleos, Grupo de Investigación en Pruebas de Pozos, Neiva, Huila, Colombia e-mail: fescobar@usco.edu.co e-mail: matildemm@usco.edu.co
2Ecopetrol S.A. - Instituto Colombiano del Petróleo, A.A. 4185 Bucaramanga, Santander, Colombia e-mail: jose.cantillo@ecopetrol.com.co
Currently, rock mechanics plays an important role in the oil industry. Effects of reservoir subsidence, compaction and dilation are being taken into account in modern reservoir management of complex systems. On the other hand, pressure well tests run in stress sensitive formations ought to be interpreted with non conventional techniques.
During the last three decades, several studies relating transient pressure analysis for characterization of stress sensitive reservoirs have been introduced in the literature. Some of them deal with type curves and/or automated history matching. However, due to the nature of the problem, it does not exist a definitive study focused on the adequate characterization of reservoirs which permeability changes as fluid withdrawal advances.
In this paper, the permeability modulus concept introduced by Pedrosa (1986) is taken as the starting basis. A great number of type curves were generated to study the behavior of the above mentioned formations under stress influence. It was found that permeability modulus, therefore permeability changes, can be correlated with the slope of the pressure derivative trend during the radial flow regime when the reservoir suffers compaction. It is also worth to mention that the time at which the minimum characteristic point of a naturally fractured formation (or the inflection point of a semilog plot) found on the pressure derivative plot is practically the same for formations without stress influence. This contributes to the extension of the TDS technique, Tiab (1993), so a new methodology to characterize this kind of reservoirs is proposed here. This was verified by the solution of synthetic problems.
Keywords: TDS technique, mathematical model, radial flow, pressure, reservoir, vertical well, stress, permeability
Actualmente la mecánica de rocas juega un papel importante en la industria del petróleo. Los efectos de subsidencia, compactación y dilatación del yacimiento se están tomando en cuenta para la administración adecuada de yacimientos complejos. Por otro lado, las pruebas de presión corridas en formaciones sensibles a esfuerzos deben interpretarse con técnicas no convencionales.
Durante las últimas tres décadas, numerosos estudios relacionados con el análisis del transiente de presión para la caracterización de los yacimientos sensibles a esfuerzos han sido introducidos en la literatura. Algunos de ellos tratados con curvas tipo y/o por ajuste histórico. Sin embargo, debido a la naturaleza del problema, no existe un estudio definitivo enfocado a la caracterización adecuada de yacimientos de permeabilidad variable.
En este artículo, el concepto de módulo de permeabilidad introducido por Pedrosa (1986) se toma como base de arranque. Se generó un gran número de curvas para estudiar el comportamiento de las formaciones que están bajo la influencia de esfuerzos. Se encontró que el módulo de permeabilidad, por consiguiente el cambio de la permeabilidad, se puede correlacionar con la pendiente que exhibe la curva de la derivada de presión durante el régimen de flujo radial cuando el yacimiento sufre compactación. También vale la pena mencionar que el tiempo al cual se presenta el punto característico de las formaciones naturalmente fracturadas (punto de inflexión de la gráfica semilogarítmica) encontrado en las gráficas de la derivada de presión es prácticamente el mismo para formaciones sin influencia de esfuerzos. Esto contribuye a la extensión de la técnica TDS, Tiab (1993), así que aquí se propone una nueva metodología para caracterizar este tipo de yacimientos. Esto se verificó mediante la solución de problemas sintéticos.
Palabras clave: yacimientos, pozos verticales, esfuerzo, permeabilidad, flujo radial, presión, técnica TDS, modelos matemáticos.
INTRODUCTION
Vairogs and Rhoades (1973), and Pedrosa (1986) have been recognized as the pioneers in well test interpretation of stress sensitive formations. Very recently, Moreno and Naranjo (2005) developed a simulator to perform history matching to gas well pressure test data based on the Pedrosa's (1986) permeability modulus. Our analysis starts analyzing the dependency of reservoir permeability on permeability modulus, which is directly related to pressure changes, for both homogeneous and heterogeneous reservoirs. Then, pressure and pressure derivative data of stress sensitive naturally formations were studied to come out with an interpretation technique following the TDS technique philosophy, Tiab (1993), for gas and oil vertical wells.
MATHEMATICAL FORMULATION
Homogeneous reservoirs
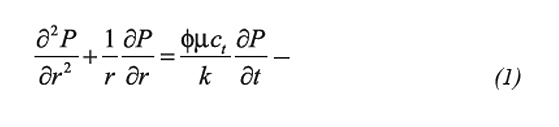
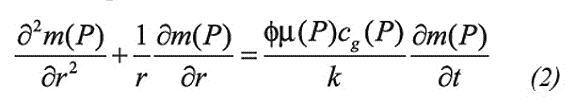
The governing equation for the flow of a slightly compressible and constant viscosity fluid through a homogeneous and isotropic porous material is given by:
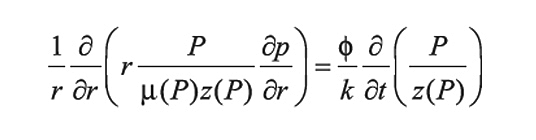
For compressible fluids (gases), the real gas law, Darcy's law and continuity equation are combined to yield:
Al-Hussainy (1966) introduced the pseudopressure concept, defined as:
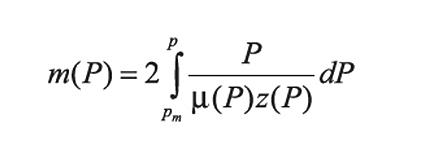
Being Pm a low base pressure. In terms of pseudopressure, Equation 1 becomes:
The dimensional solutions to Equation 1 and Equation 2, including wellbore storage and skin factor, in the laplacian space, are:
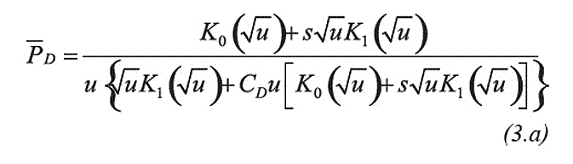
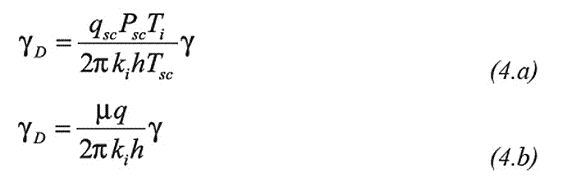
For the constant-rate case, the dimensional permeability modulus for gas and oil, respectively, are expressed by Equation 4.a and Equation 4.b:
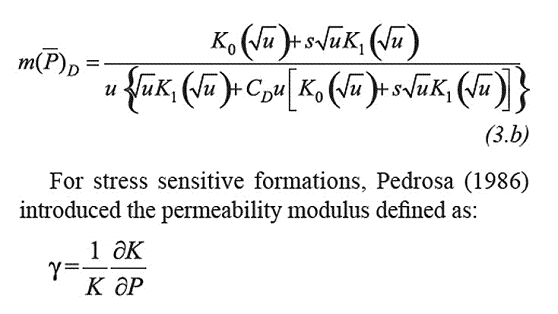
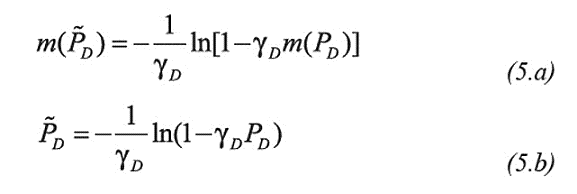
Using the perturbation technique, Pedrosa (1986) provided the solution to the diffusivity equation including permeability changes as:
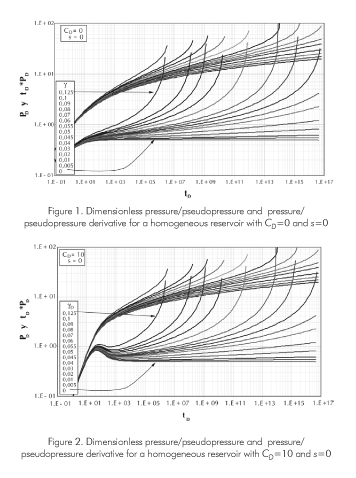
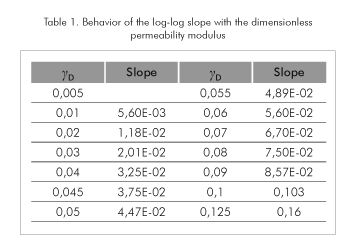
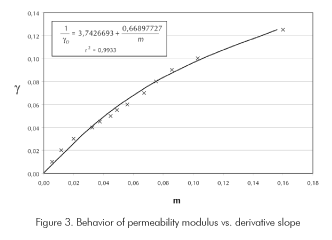
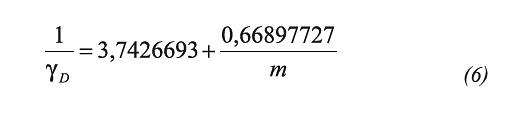
The results of the combinations of Equation 3.a with Equation 5.a (and Equation 3.b with Equation 5.b, for the gas case) are reported in Figures 1 and 2 where we observe an increase of the pressure derivative (permeability reduction) as pressure increases as a consequence of permeability reduction due to an increase of drawdown. At early times, the change of the derivative trend is linear, but at late times it becomes curved. The late behavior may not be observed on an actual pressure test. As the permeability modulus increases the slope is more pronounced. Table 1 contains the values of the observed slopes for each of the studied permeability modulus (0,125 ≤ γD ≥ 0,0). This behavior is plotted in Figure 3. From regression analysis we obtained:
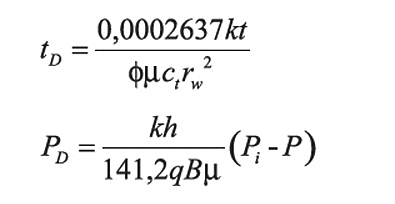
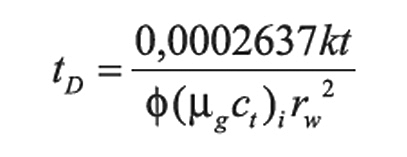
The dimensionless time and pseudopressure for liquid gas are:
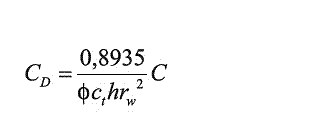
The dimensionless wellbore storage coefficient for liquid and gas cases are:
Step-by-step procedure for interpretation of liquid pressure tests
Step 1. Plot pressure and pressure derivative in a log-log paper.
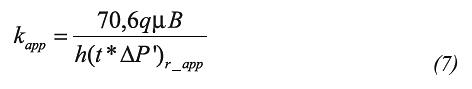
Step 2. Define the apparent radial flow region (the flattest region) and read the apparent pressure derivative during radial, (t*ΔP')r_app. Estimate the apparent permeability using Equation 7 which results from Tiab (1993):
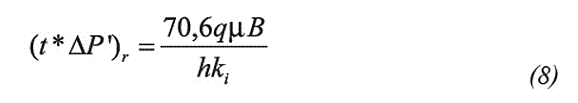
Step 3. If the true or initial permeability, ki, is known, find the pressure derivative corresponding to radial flow from Equation 8:
Step 4. Estimate the slope of the pressure derivative using your best criterion and find the dimensionless permeability modulus using Equation 6.
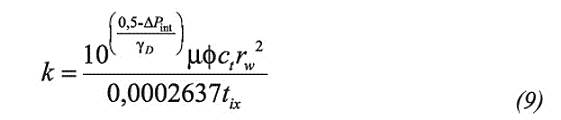
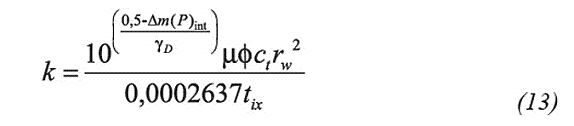
Step 5. For verification purposes, draw an horizontal line corresponding to radial flow, throughout the radial flow pressure derivative value, (t*ΔP')r. Read the intersection point of this line with the linear trend established in step 4, tix. Read also the intercept of the trend line when t = 0, ΔPint. Verify the initial permeability value with Equation 9:
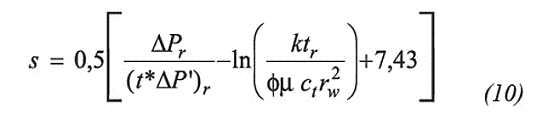
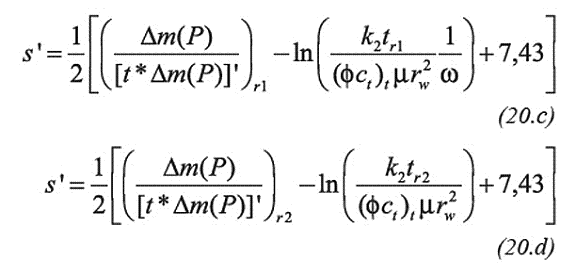
Step 6. Find skin factor by reading the pressure and pressure derivative values [ΔP'r and (t*ΔP')r] at any representative time tr during radial flow. Notice that as the pressure derivative increases, so does the skin factor, then the reading point has to be significant. Find skin factor using Equation 10 taken from Tiab (1993):
Step-by-step procedure for interpretation of gas pressure tests
Step 1. Same as case 1 of liquid case, but plot pseudopressure, instead.
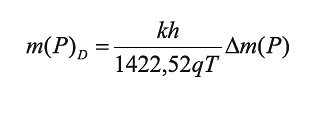
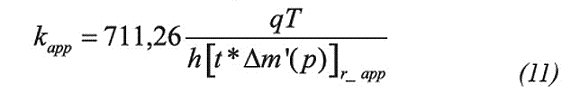
Step 2. Same as case 2 of liquid case, but read (t*Δm(P)')r_app, instead. Calculate apparent reservoir permeability using Equation 11 adapted from Nuñez, Tiab, & Escobar (2003):
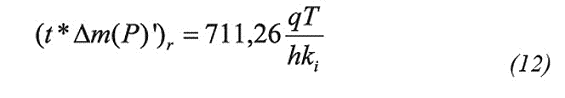
Step 3. If the true or initial permeability, ki, is known, find the pseudopressure derivative corresponding to radial flow from using Equation 12 (gas rate is given in Mscf/day):
Step 4. Same as case 4 of liquid case.
Step 5. For verification purposes, draw a horizontal line corresponding to radial flow, throughout the radial flow pressure derivative value, (t*Δm(P)')r. Read the intersection point of this line with the linear trend established in step 4, tix. Read also the intercept of the trend line when t = 0, Δm(P)int. Verify the initial permeability value with Equation 13:
Step 6. Find skin factor by reading the pressure and pressure derivative values [Δm(P)r and (t*Δm(P)'r] at any representative time tr during radial flow. Notice that as the pressure derivative increases, the skin factor also increases, then the reading point has to be a significant one. Find pseudoskin factor (it does not include rapid flow damage) using the following equation taken from Nuñez, Tiab, & Escobar (2003):
Naturally fractures reservoirs
The analytical solution in the laplacian space of the oil and gas diffusivity equations of a naturally fractured formation, including wellbore storage and skin factor, are given by:
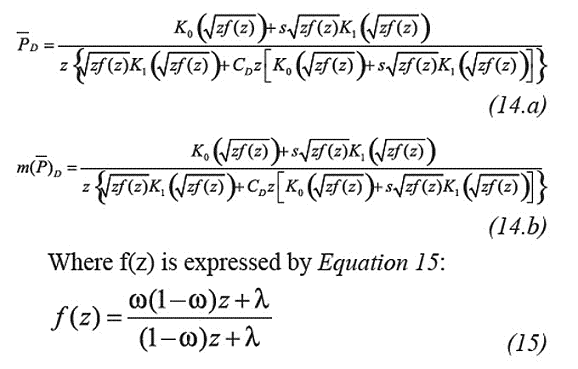
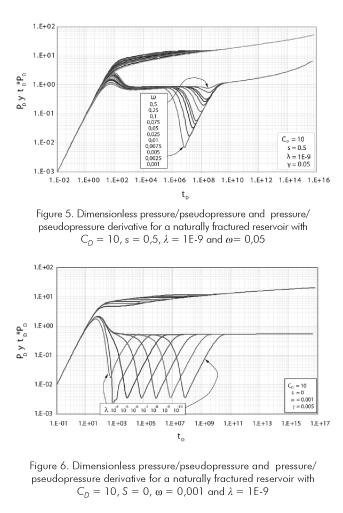
Where ω (the storativity coefficient) and λ (the interporosity flow parameter) introduced by Warren and Root (1963). Solutions to Equations 3.a, 3.b, 14.a and 14.b are inverted to the real space using the Stephest (1970) algorithm. Some results are plotted Figures 4 to 6.
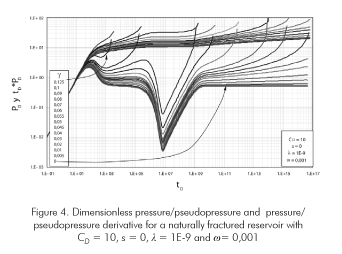
The time at which the minimum point characteristic of naturally fractured formations, Figure 4, takes place at practically the same time as for non-stress sensitive formations, no matter the value of the permeability modulus. This indicates that the time of the inflection point found on the semilog plot is not affected by changes of permeability modulus. This leads to conclude that λ can be determined using the value of the minimum point time by means of the equation presented by Tiab and Escobar (2003):
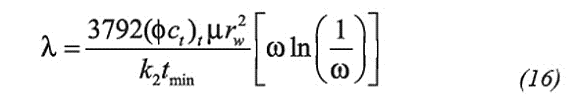
Where k2 refers to the system permeability. Based on the above, ω can also be determined from the correlation developed by Engler and Tiab (1996):
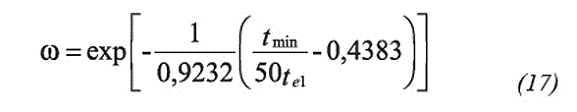
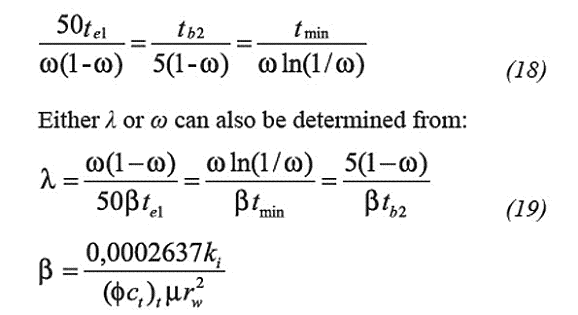
Being te1 the approximated point at which the first radial flow ends. This can be read from the derivative plot. If the starting of the second radial flow, tb2, can be obtained, then, ω may be found from other correlation presented by Engler and Tiab (1996):
Skin factor is estimated from either the first or second radial flow:
For gas reservoirs, the pseudoskin factor is estimated from Nuñez et al. (2003):
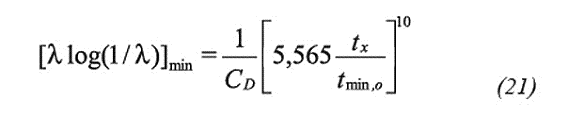
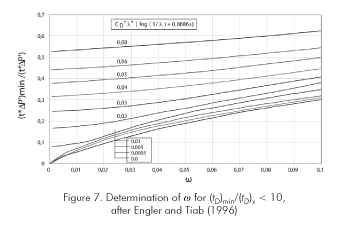
Wellbore storage has an important effect on the minimum point as far as the application of the TDS is concerned. According to Engler and Tiab (1996), the minimum point is not affected by wellbore storage for all the values of ω and λ, only if, (tD)min/(tD)x ≥ 10. Therefore, the former procedures are valid. For the contrary case, Engler and Tiab (1996) presented an empirical correlation to estimate λ from Equation 21:
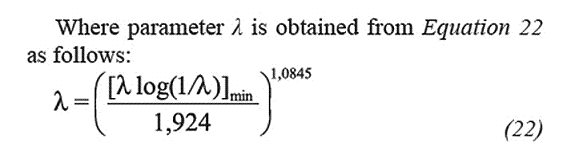
Where parameter λ is obtained from Equation 22 as follows:
ω is then estimated from Figure 7.
Step-by-step procedure for interpretation of gas and liquid pressure tests in naturally fractured formations
Steps 1-5. Similar to cases 1 through 5 of homogeneous case.
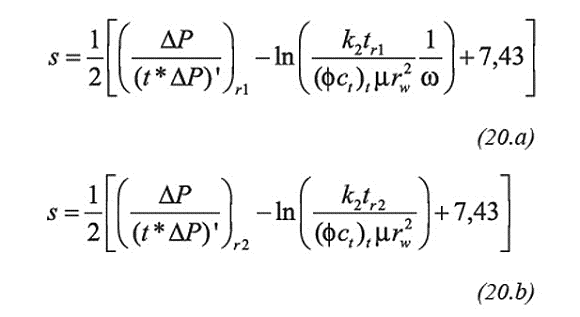
Step 6. Similar to step 6 of homogeneous case. It has to be taken into account that Equation 20.a through Equation 20.d are applied to the first and second radial flow, respectively, for crude and gas cases.
Step 7. Read the most representative time value, tmin, at which the minimum time takes place and the starting time value of the first radial flow, te1. Calculate ω using Equation 17. If wellbore storage masks the first radial flow, read the time, tb2, at which the second radial flow begins developing and find ω from either Equation 18 or Equation 19. Needless to say that tx/tmin has to be greater than 10 otherwise apply Equation 21 and Figure 7.
SYNTHETIC EXAMPLES
Homogeneous reservoirs
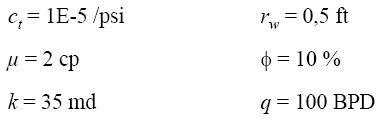
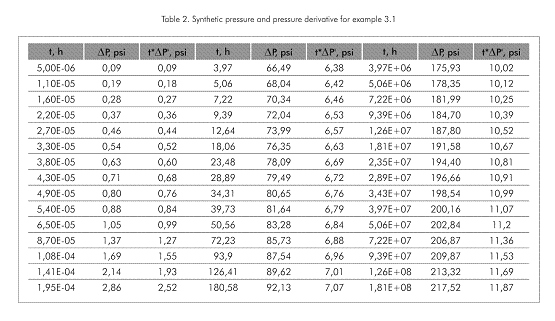
Table 2 corresponds to a drawdown test simulated with the following parameters:
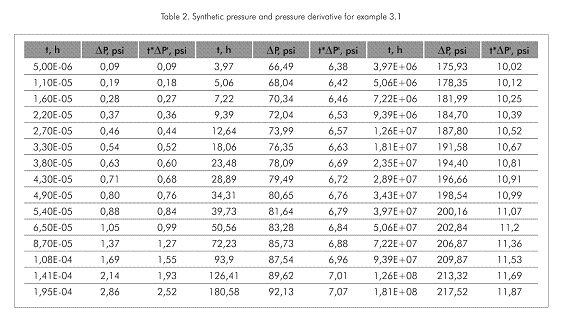
Verify the initial reservoir permeability k and the permeability modulus γD.
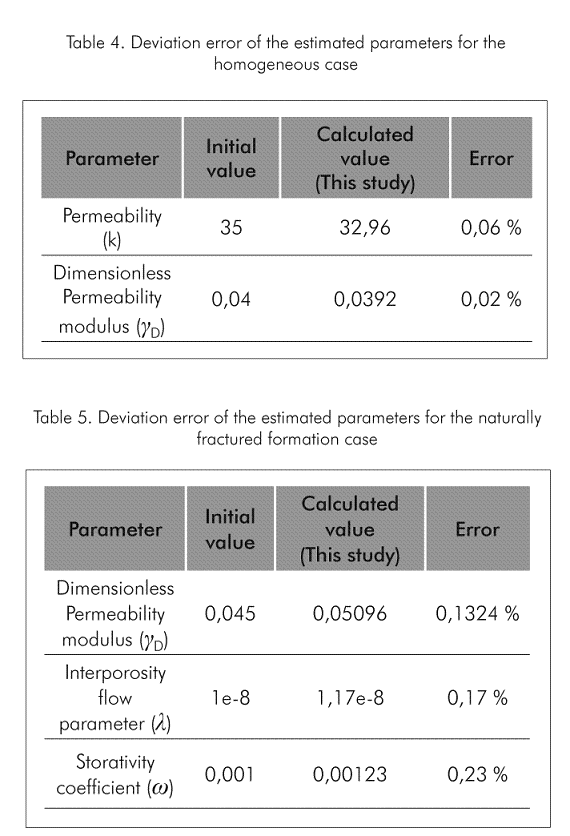
Solution. Figure 8 shows the pressure and pressure derivative plot. A regression analysis is performed through times of 1 and 160 h. It was found a slope = 0,3066 and intercept = ΔPint = 0,7835. Using Equation 6, γD = 0,392, which is very close to the simulated one.
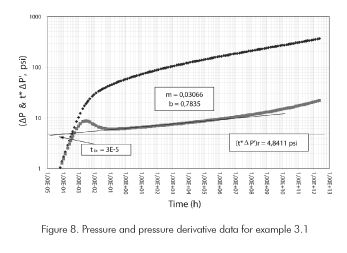
From Equation 8, using the initial permeability value, the pressure derivative is obtained during radial flow. This corresponds to 4,84 psi. A horizontal line is drawn throughout this value. It intercepts the trend line derivative in the point t = 3E-5 hours. From Equation 9, the resulting permeability value is 32,9 md, which is also very close to the assumed one.
Naturally fractured reservoir
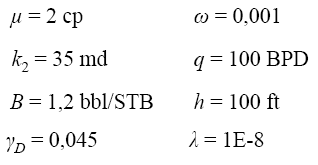
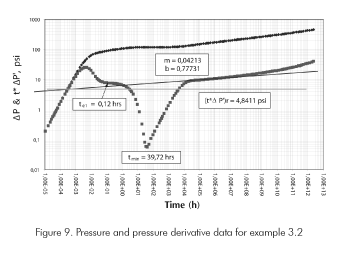
The data given in Table 3 were obtained for a simulated pressure drawdown tests with the following parameters:
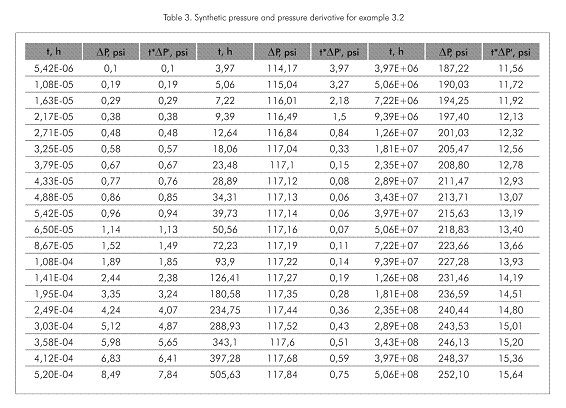
Verify the permeability modulus γD, λ and ω.
Solution. Figure 9 shows the pressure and pressure derivative plot. A regression through times 34300 and 50500 hours yields a slope = 0,04213 and intercept = ΔPint = 0,77731. Using Equation 6, γD = 0,05096, which agrees with the simulated value of 0,045. With the read values of tmin = 39,72 hours and te1 = 0,12 hours, ω is estimated from Equation 17 to be 0,00123 and λ = 1,17E-8 from Equation 16. It is observed that both values agree quite well with the one used for the simulation.
ANALYSIS OF RESULTS
In well pressure tests run in conventional reservoirs (with no geomechanical effects), the pressure derivative trend is characterized by exhibiting a horizontal behavior during radial flow regime from which reservoir and skin factor can be readily obtained. In pressure tests of stress sensitive formations the pressure derivative does not exhibit the horizontal trend during transient state. The slope increases gradually as the geomechanical influence increases. Therefore, it should result of interest to provide a methodology to characterize the radial flow regime for such cases.
The application of the above mention methodology for the homogeneous case gave a maximum absolute error of 0,06 %. This leads us to conclude that the methodology works well as reported in Table 4. Even though, the error was slightly higher for the case of naturally fractured reservoirs (Table 5), the methodology can be applied.
The step-by-step procedure of the developer methodology is very simple. However, care must be taken to properly identify the radial flow regime period. Otherwise, the results are in error since they are function of the intersection point between the radial line and the horizontal ideal radial flow line. If the initial values are known, this proposed methodology provides a way for their verification.
The relevancy of this study is based upon the interpretation of pressure tests for reservoir suffering either dilation or compaction which are rarely presented in commercial simulators. The characterization of this type of formations is important for an adequate reservoir management.
CONCLUSIONS
• An extension of the TDS Technique, Tiab (1993), for stress sensitive formations was elaborated in this study. Initial permeability may be difficult to be determined, however, it can be inferred from the permeability modulus which correlation is provided here.
• Additionally, it was found that the time at which the minimum point characteristic of naturally occurring formations takes place (inflection point of the semilog plot) is not affected by changes of the permeability modulus, therefore, some of the relationships presented by Engler and Tiab (1996).
• A step-by-step methodology following the TDS technique's philosophy is presented for interpretation of pressure tests in both homogeneous and naturally fractured oil and gas vertical wells.
ACKNOWLEDGMENTS
The authors gratefully acknowledge the financial support of Ecopetrol S.A. -Instituto Colombiano del Petroleo (ICP), under the mutual agreement number 008, signed between this institution and Universidad Surcolombiana (Neiva, Huila, Colombia).
REFERENCES
Al-Hussainy, R., Ramey, H.J., & Crawford, P.B. (1966). The flow of real gases through porous media. J. Petroleum Technol., 624-636. Trans. AIME, 237. [ Links ]
Engler, T., & Tiab, D. (1996). Analysis of pressure and pressure derivative without type curve matching, 4. Naturally fractured reservoirs. J. Petroleum Scien. and Engineer., 15 (2): 127-138. [ Links ]
Moreno, J.P., & Naranjo, A. (2005). Modelamiento analítico de pruebas de presión transientes en yacimientos de gas, naturalmente fracturados y sensibles a esfuerzos. SPE XI Colombian Petroleum Symposium, Bogotá, Colombia, Oct. 18-21. [ Links ]
Nuñez, W., Tiab, D., & Escobar, F.H. (2003). Transient pressure analysis for a vertical gas well intersected by a finite-conductivity fracture. SPE Production and Operations Symposium, Oklahoma City, OK, March 23-24. SPE 80915. [ Links ]
Pedrosa, O.A., Jr. (1986). Pressure transient response in stress-sensitive formations. Regional Meeting, Oakland, CA, April 2-4. SPE 15115. [ Links ]
Stephest, H. (1970). Numerical inversion of laplace transform. Communications of the ACM, 47-49. Jan.13. [ Links ]
Tiab, D. (1993). Analysis of pressure and pressure derivative without type-curve matching: 1- skin factor and wellbore storage. Paper presented at the Production Operations Symposium, Oklahoma City, OK. SPE 25426, 203-216. Also, J. Petroleum Scien. and Engineer., March 21-23 (1995), 12 (3): 171-181. [ Links ]
Tiab, D., & Escobar, F. H. (2003). Determinación del parámetro de flujo interporoso de un gráfico semilogarítmico. X Colombian Petroleum Symposium, Bogotá, Colombia, Oct. 24-27. [ Links ]
Vairogs, J., & Rhoades, V.W. (1973). Pressure transient test in formations having stress-sensitive permeability, J. Petroleum Tech., August, 25: 965. [ Links ]
Warren, J. E., & Root, P. S. (1963). The behavior of naturally fractured reservoirs. September, SPEJ, 245-255, Trans. AIME, 228. [ Links ]
(Received May 30, 2006; Accepted July 19, 2007)

