


Services on Demand
Journal
Article
 English (pdf)
 Article in xml format
 Article references
 Send this article by e-mail
Indicators
-
 Cited by SciELO
 -
 Access statistics
Related links
-
 Cited by Google
 -
 Similars in
SciELO
Similars in
SciELO -
 Similars in Google
Share

 Permalink
CT&F - Ciencia, Tecnología y Futuro
Print version ISSN 0122-5383On-line version ISSN 2382-4581
C.T.F Cienc. Tecnol. Futuro vol.3 no.3 Bucaramanga Jan./Dec. 2007
GEOMECHANICAL WELLBORE STABILITY MODELING OF EXPLORATORY WELLS – STUDY CASE AT MIDDLE MAGDALENA BASIN
Modelamiento geomecánico de estabilidad de pozosexploratorios durante la perforación - una experienca en la cuenca del valle medio del río Magdalena
Jenny-Mabel Carvajal Jiménez1, Luz-Carime Valera Lara2, Alexander Rueda3, and Néstor-Fernando Saavedra Trujillo1
1 Ecopetrol S.A. - Instituto Colombiano del Petróleo, A.A. 4185, Bucaramanga , Santander , Colombia e-mail: jenny.carvajal@ecopetrol.com.co
2 DTH Ltda., Calle 91 # 24-69, Bucaramanga, Santander, Colombia
3 Ecopetrol S.A. Reservoir and Production Engineering Office, Calle 37 # 8-43, Bogotá, Cundinamarca , Colombia
This paper presents the geomechanical wellbore stability model of an exploratory well sited at Middle Magdalena Basin (MMB), which is based on the validity of linear elastic deformational theory for porous media; the use of correlations and field tools such as well and image logs to indirect determination of mechanical properties and stress state. Additionally, it is shown the model calibration and validation using drilling events which occurred at other previously drilled wells in the study area, at the exploratory well itself and experimentally evaluated mechanical properties on outcrop and core samples from the basin formations. This application allowed the Instituto Colombiano del Petróleo (ICP) at Ecopetrol S.A. to formally perform the geomechanical modeling of Colombian formations and to accomplish a complete and appropriate methodology to do so; such methodology has been standardized as part of the drilling support process at Ecopetrol S.A., supplying the possibility for taking decisions that contribute to reduce drilling costs and risks during operations.
Keywords: exploratory well, rock mechanics, modeling, stability, drilling, Middle Magdalena Basin , Cagüi 1.
En este artículo se presenta el modelamiento geomecánico durante la perforación de un pozo exploratorio, ubicado en la cuenca del Valle Medio del Río Magdalena; el cual supone la validez de la teoría elástica lineal para determinar el comportamiento deformacional de las rocas, soportado en el uso de correlaciones para la obtención indirecta de las propiedades geomecánicas de las formaciones y el estado de esfuerzos in situ, a partir de herramientas de pozo como los registros eléctricos y de imágenes. Adicionalmente, se presenta la calibración de dicho modelo con los eventos de perforación observados en pozos perforados previamente en el área de estudio y con pruebas de laboratorio realizadas en muestras de afloramiento de la cuenca. La validación del modelo extrapolado se basó en la experiencia de perforación y en pruebas de laboratorio adicionales realizadas en el corazón extraído del prospecto perforado. Con este ejercicio, el Instituto Colombiano del Petróleo de Ecopetrol S.A. incursionó de manera formal en el área del modelamiento geomecánico de las formaciones colombianas, lo que permitió el desarrollo de una metodología robusta y apropiada para la región de estudio y la estandarización de este proceso como apoyo a la perforación en Ecopetrol S.A., brindando la posibilidad de establecer acciones que permiten reducir el costo de perforación y los riesgos inherentes a las diferentes operaciones desarrolladas.
Palabras clave: pozos exploratorios, mecánica de rocas, modelamiento, estabilidad, perforación, cuenca del Valle Medio del Magdalena, Cagüi 1.
INTRODUCTION
Rock mechanics has become one of the support technologies applied in order to obtain an efficient exploitation of hydrocarbons due to the changes induced by petroleum industry activities performed on oil and gas reservoirs. Early applications of geomechanics in petroleum industry were made to prevent and control sanding and stability problems of wells (Roegiers, 1995).
Wellbore stability is considered when the well diameter fits the bit sizes and it remains constant while drilling. In constrast to this, geomechanical instability refers to mechanical conditions such as wellbore collapse or failure. In general, wellbore instability is related to drillpipe sticking, tight spots, caving production, wellbore collapse and unscheduled sidetracks, these conditions are mostly caused by unknown rock mechanics and lead to increased costs during drilling and completion operations.
Hubbert and Willis (1957) developed a mechanical wellbore stability model in which the primary assumption was the linear elastic stress pathway around the borehole. From this model, Geertsma (1966) and other researchers stated methodologies to couple pore pressure effects and improve the stress prediction on the borehole using non linear elastic hypothesis and anelastic strain. Most recent models include wellbore instability numerical simulation (Vásquez, Castilla, & Osorio, 2004). A comparative outline of current instability models available is shown in Table 1.
The proposed methodology assumes the validity of linear elastic theory for porous media in order to predict geomechanical rock behavior. In addition to this, to reduce solution uncertainties in the model a set of data is used, which is obtained from drilling reports, well logging, laboratory tests, well tests such us LOT (Leak off Test), FIT (Formation Integrity Test) and microfracturing. The main goal of this method is to obtain representative models to be used while drilling, so it would be possible to prevent instability problems and to reduce non productive time and drlling costs.
This paper describes the methodology used by Ecopetrol S.A. to perform and calibrate the geomechanical wellbore stability models and its application to an exploratory well sited at MMB – Colombia , called Cagüi 1. This application demonstrated the validity of hypothesis such as: I) applicability of linear elastic theory in mechanical stability simulation while drilling, II) applicability of well logging to rock mechanic features modeling, III) applicability of laboratory test to calibrate rock mechanical modeling and iv) applicability of drilling reports to calibrate wellbore stability models.
FUNDAMENTAL THEORY
Wellbore instability modeling
According to rock mechanics, drilling generates changes in the stress field of the formation due to supporting material losses. In fact, drilling induces radial and tangential stresses that result in additional shear stresses. At certain point induced stress may be higher than the rock strength and rock will fail causing borehole collapse and stuck piping. This mechanic behavior can be addressed to know the rock feature so it would be possible to prevent and to reduce instability problems.
The following items help to state a stability model (Adam, Bourgoyne, Keith, Martin, & Young, 1986):
1. To evaluate the acting forces on objective area (gravity and tectonic stresses).
2. To assess the rock strength.
3. To calculate resulting stress field.
4. To use the constituve laws to relate stress field and strain.
5. To state boundary conditions for stresses and strains.
6. To identify the failure mode.
7. To determine the mudweight window and to calculate the best mud density.
8. To define activities to control of instability.
Calculating overburden stress. To do so, the density well logging is integrated with respect to vertical depth using the following equation:
Minimum horizontal stress assessment (Sh ). This stress is read from LOT and FIT results, Figure 1 shows a type curve of these tests (Aird, 2001) and the point corresponding to Sh .
Maximum horizontal stress calculation (Zoback et al., 2003). In order to quantify this stress the stress polygon definition is used, in wich is possible to identify various magnitude ranges based on overburden stress, pore pressure, minimum horizontal stress, UCS, tensile strength and failure conditions observed at previously drilled wells. To draw the stress polygon (Figure 2) it must be calculated the strike-slip, normal and thrust regime limits, then the polygon area is closed using the vertical stress and pore pressure and finally with rock properties it is approached the maximum horizonta stress for each depth.

Horizontal stress orientation. Finally to complete the horizontal stress determination the orientation of them must be known. This can be achieved from image well logging (UBI or FMI), geometry well logging (four arms caliper or higher calipers), regional or structural studies. When well logging are available the current orientation can be obtained. On the other hand, when regional and structural studies are used the orientation will depend on tectonic conditions (Muñoz et al., 1996).
Pore pressure calculations. To estimate the pore pressure profile the Eaton's correlation (1969) is used:
Geomechanical properties modeling of rock formations
The geomechanical properties can be modeled from rock features such as composition (shale content), density and acoustic velocities based on well logging tools – Gamma Ray, Neutron Density and Sonic log – and experimentally evaluated petrophysic properties on well samples. Rock composition, porosity and density can be obtained from well logging or laboratory tests, however acoustic velocities require special data treatment, which is accomplished using the equations proposed by Nielsen, and Kohlhaas (1979).
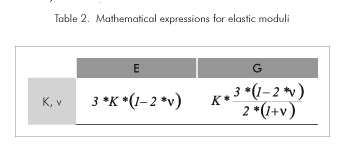
Elastic Moduli assessment (Biot, 1956). According to elastic theory it is possible to obtain all the elastic moduli from two of them (as it can be seen at Table 2, published by T. Bourbie, Coussy, & Zinszner, 1987). A common array is the Poisson ratio and Volumetric moduli which can be calculated from acoustic velocities as shown in Equations 4 and 5).
The values obtained by the earlier equations are greater than pseudostatic measurements of mechanical properties. The dynamic measurements need to be upscaled in order to fit the corresponding pseudostatic properties since those are the data used in geomechanical modeling.
Mohr-Coulomb failure envelope and rock strengths. These parameters are computed from Tixier, Loveless, and Anderson (1975) equations which are based on experimental correlations.
Experimental geomechanic evaluation
Experimental geomechanic evaluation is used to determine straightforward elastic moduli, rock strengths and Mohr-Coulomb failure envelope. The parameters from geomechanic tests are representative of rock behavior and can be used to calibrate geomechanical models built from well logging. Table 3 lists the tests to evaluate wellbore stability parameters.
Uniaxial compressive test. This experimental evaluation consists in applying axial force on the rock in a continous way increasing the stress until the sample shows shear failure. The strains of the rock are measured during the test so Young moduli and Poisson ratio can be calculated from them (Charlez, 1991; ASTM D2938 – 95 (Reapproved 2002), ASTM D 3148, 2002).
Indirect tensile test. It is also called Brazilian Test and it implies the progressive increase of compressive force applied transversely to the axial axis of the sample at one point of the diameter until the rock fails on indirect tensile mode (ASTM D 3967 – 05, 2002).
Triaxial compressive test. At the beginning of this test the sample has confining pressure and axial force applied on it – the value of this stress is similar to average in situ stress state. Next to this, axial force is increased until the rock fails in a shear mode (ASTM D 2664 – 04, 2004; ASTM D 5407 – 95 Reapproved 2000).
In addition, to obtain the Mohr-Coulomb failure envelope, a series of triaxial compressive tests must be carried out by applying different initial stress states on the specimens. This is possible to achieve using either as many samples as stress states are evaluated or using just one specimen in a special triaxial known as multiple failure envelope test.
EXPERIMENTAL PROCEDURE
This methodology consists in three stages. First step is to build up the model based on the correlation wells available (Figure 3) which are sited next to the studied well and have similar behavior respect to it. Furthermore, correlation wells must have as much information as possible to obtain the geomechanical model. This means well logging (density log, sonic log, gamma ray log, resistivity log, porosity log), drilling reports and formation tests.
The second stage is model calibration (Figure 4) which is the replication of drilling conditions on the correlation wells, based on the following information: formation tests data, daily drilling reports, and experimental tests data (both petrophysics and geomechanics data).
At last, the model is extrapolated to the exploratory well (Figure 5) by taking into account geologic features, well configurations and the different drilling conditions occured at correlation wells. In order to update the model, the behavior of rocks is observed while exploratory well drilling. This may help to support the decision making on the operation.
Geomechanical model building up
Primary assumptions during this stage are the validity of linear elastic theory for porous media, the uniformity of rock formations, the representativity of formation test and well logging. Based on these, the geomechanical model building up consists of the next items:
1. To choose the correlation wells.
2. To determine the lithologies at wells.
3. To assess shale content at different lithologies (V shale ).
4. To calculate shear and compressive acoustic velocity on wells.
5. To compute elastic moduli, rock strength and Mohr-Coulomb faillore envelope.
6. To get well in situ stresses (overburden stress, minimum horizontal stress, maximum horizontal stress, orientation of horizontal stresses and pore pressure).
7. To evaluate the mudweight window, which has three parameters: I) minimum mudweight, II) maximum mudweight and III) optimum mudweight while drilling.
Correlation wells are sited in the surrounding area of the exploratory well, to choose the main correlation well it is assumed that formations are uniform so wells near to the prospect will behave similarly. Once the correlation well is chosen, the lithology of it must be determined from core and cutting samples description, composite well log and gamma ray log. Based on this information, the shale content can be calculated using the value of clean gamma ray – which corresponds to gamma ray reading at non shaly zones – and dirty gamma ray – reading at shaly zones – applying Equation 6.
The sonic well log is used to get the compressive acoustic velocity and after this calculation it is possible to assess the shear acoustic velocity according to the well lithologies. Once these velocities are computed, the elastic moduli can be determined from the expressions in Table 2. Finally, rock strength must be defined for each well lithology.
To determinate the in situ stress state it is required to calculate first of all the overburden stress (Equation 1). If there is not enough density information to use Equation 1, it is possible to build up this stress from lithological description, core petrophysics data and cuttings using the following equation:
Whereas 0,433 is the unit conversion constant from g/cc to psi/ft. Table 4 lists various lithology densities assuming 100 % of purity on each.
After calculating overburden stress, the minimum horizontal stress magnitude can be defined from LOT and FIT at correlation wells. To extrapolate the minimum stress gradient it is assumed that its magnitud is constant at each rock formation. Once the previous stresses are computed, it is possible to approach maximum horizontal stress magnitude using stress polygon (Figure 2). The orientation of horizontal stresses is defined based on well logs or regional studies. Finally, the stress state is completed when pore pressure profile is obtained from Eaton method (Equations 2 and 3).
According to geomechanical definitions mudweight window is the value or range of values that might be used to keep a safe operation while drilling. Minimum values of this window correspond to the minimum mudweight required to avoid collapse formation in the borehole; maximum values address to prevent hydraulic fracturing while drilling and optimum mudweight is the suggested mud density to perform drilling.
The minimum mudweight is calculated from Mohr-Coulomb failure criteria using the following equations (Muñoz et al., 1996):
Taking into account the relative magnitude of induced stresses (failure regimes) and the Mohr-Coulomb parameters (Equations 8 and 9) there can be six different possible conditions for borehole collapse. these conditions are listed in Table 5.
The maximum mudweight for a vertical well can be defined considering hydraulic failure condition (tensile fracture), which is calculated upon the next equation (Muñoz et al., 1996):
The mudweight window is favorable when the collapse density is lower than the fracture density in any other case such mudweight window will be non favorable. In the Figure 6 is shown a skematic drawing of these cases.
When the mudweight window is favorable the optimum mud density is the range average. In the other cases the optimum mud density corresponds to either fracturing or collapse values, taking into account which is the most critical situation under drilling conditions and trying to minimize mechanical failure.
Geomechanical model calibration
In order to calibrate a geomechanical model, it is necessary to identify the drilling conditions on correlation wells. To do so, the primary information is obtained from daily drilling reports, operative reports and final drilling reports. After this information is extracted the model is tested and fitted so it accurately reflects the observed behavior.
Extrapolating the model to the exploratory well and updating the model while drilling
The geomechanical model can be extrapolated once the initial model is calibrated. This can be addressed from the geomechanical and petrophysical behavior of the rocks to be drilled, their width and their structural conditions on the new well. Here, the primary assumption is the lithological and mechanical uniformity of the formations since this allows to calculate the necessary parameters to obtain the new model.
While drilling it is necesary to update the model. This issue can be accomplished using drilling parameters, well logging, lithological description of the rocks from cuttings and LOT/FIT performed on the exploratory well. Once this information is recorded the geomechanical model and its parameters can be updated. Finally, the initial model is compared to the updated model and the model parameters can be validated with the actual data to obtain an accurate model that represents the drilled zone behavior.
STUDY CASE: EXPLORATORY WELL ON MMB
The methodology presented in this paper was applied on one exploratory well sited at MMB named Cagüi 1.
Geomechanical model building up
This exploration well is sited in the north depression of MMB, in the surroundings to Playon town – Santander , Colombia . According to the geological studies (Suárez, 1998), this sector has three structural and stratigraphic features which are:
Triassic-Jurassic. Constituted by Girón Formation, this sector shows normal faulting systems enclosed by subvertical faults.
Cretaceous-Paleocene. It is composed by Tambor, Rosablanca, Paja, Tablazo, Simití, La Luna , Umir and Lisama Formations. this region is conformed by inverse strike-slip faulting system.
Middle Post-Eocene. The formations found in this sector are: La Paz , Esmeralda, Mugrosa , Colorado , Real Inferior, Medio y Superior. These formations dip to east and present inverse faulting system caused by Lebrija faulting system.
Correlation wells. Based on the structural and stratigraphyc information the correlation wells chosen to accomplish the geomechanical model were Puntapiedra 1 and 2 and Bosques 3. Puntapiedra 1 was chosen as the primary correlation well since it has the largest amount of best quality information, however due to the final drilled depth of this well it was necesary to model Paja and Rosablanca Formations from Bosques 3 well. Puntapiedra 2 well was used to correlate drilling events and validate the geomechanical model.
Lithostratigraphic description of correlation wells (Ortega and Ramírez, 2002, Rubiano et al., 2001). While drilling of Puntapiedra 1 well next formations were found (from base to top): Simití, La Paz , Esmeralda, Mugrosa , Colorado and Grupo Real. These formations are primary shales and sandstones buried on river channels which have certain content of calcareous material.
Shale content and acoustic velocities assessment. The Equation 6 was used to obtain shale content. After that, the compressive acoustic velocity profile was computed. Finally, using this two data the shear acoustic velocity was addressed. In Figure 7 the V shale , V p and V s profiles obtained for Puntapiedra 1 well are shown. From this figure it is possible to state that velocities behavior is consistent to shale content in rocks and its lithological features. As a result rocks with low shale content have higher velocities values than rocks with high shale content.
Elastic moduli, rock strength and Mohr-Coulomb failure envelope. In order to build up the geomechanical model it is necessary to assess the elastic rock features in the correlation well. This can be accomplished using the Equations 4 and 5 and the expresions on Table 2. On the other hand to compute the Mohr-Coulomb failure envelope and rock strength it was necessary to know in advance the shale content and compressive and shear acoustic velocities. Figure 8 shows the profiles obtained for these properties. It can be observed that for Puntapiedra 1 well the Grupo Real y Colorado formations are weaker than the other well formations, this formations could be the most problematic ones during drilling. It also can be seen that Mugrosa Formation has a higher strength than the previous formations and Esmeralda Formation has a decrease in strength as its depth increases, in the other hand La Paz Formation shows opposite behavior to Esmeralda Formation, finally Simití Formation has a mixed behavior, first it decreases it strength down to a minimum value at about 11300 ft and then starts increasing its strength up progressively until the end of the well.
Stress field calculation. This issue was accomplished by first calculating the overburden stress using the density log from Puntapiedra 1 well, the lithology densities from Table 4 and Equations 1 and 7. In figure 9 the density log (left side) and the overburden stress – right side – for this well are presented. The densities from the log vary between 2,45 and 2,68 gr/cc which are tipical values for drilled formations in the well. The overburden gradient obtained from density log varies between 0,983 and 1,01 psi/ft which is also very common value for this stress magnitud.
In second instance, the minimum horizontal stress gradient was calculated using three LOT and three FIT from Puntapiedra 1 and Puntapiedra 2 wells. The data obtained in these test are listed in Table 6. The value obtained for the minimum horizontal stress gradient varies from 0,84 psi/ft to 1,01 psi/ft.
In third place, to determine the maximum horizontal stress magnitude the stress polygon was evaluated at each FIT from Puntapiedra 1 well. The results from these calculations are shown in Table 7. It can be noticed that the maximum horizontal stress gradient varies between 1,61 psi/ft and 1,08 psi/ft. It can be notice that for Simití Formation (11 475 ft and 11 790 ft) the maximum stress gradient is lower than for the Grupo Real Formation ( 3000 ft ), the reason for this behavior is the lower values of tensile strength in Simití Formation.
Fourthly, the horizontal stress orientation was defined based on the regional study Levantamiento de Secciones Estratigráficas, Control de Cartografía Geológica y Medición de Fracturas, Pliegues y Fallas en el Bloque Torcoroma (Technical Report), in which the maximum horizontal stress orientation is inferred from natural fracture orientation. According to this study the maximum horizontal stress orientation resulted to be about N85°E - S85°W.
Finally, the pore pressure was calculated from the Eaton method. Figure 10 shows the results obtained for this property. In general, most of the correlation well presents normal pore pressure or slightly overpressured gradient (0,433 psi/ft to 0,502 psi/ft) excepting the Simití Formation in which pore pressure gradient goes up to 0,82 psi/ft.
Mudweight window. To model the geomechanical behavior while drilling of Puntapiedra 1 well, the software AGE was used. The results of this modeling are shown in Figure 11. From this information it can be stated that there was a risk during drilling due to overpressure on the Simití formation and that mud density necessary to prevent wellbore collapse failure in the lower part of Real Inferior Formation was very close to pore pressure, so it would be necessary to drill the well with a high density mud. In fact, Puntapiedra 1 well was geomechanically stable while drilling and the drillers used high density muds which prevent both kickings and collpse during the drilling operations.
Geomechanical model calibration
To do the model calibration, information from the next sources was used: well drilling reports, well tests and experimental tests.
From experimental geomechanical data the Mohr-Coulomb failure envelope was obtained (evaluated at the Rosablanca formation which was the reservoir target formation). This failure envelope was used to calibrate geomechanical properties in the wellbore stability model. In a related fashion, the well tests available supply enough data to calibrate pore pressure profile as shown in Figure 10. From this calibration the Eaton exponent was changed to a value of 2,0. Finally, the drilling reports did not reference any instability conditions while drilling so at the end of this procedure the model was considered to fit the actual geomechanic behavior of the correlation wells.

Extrapolation to Cagüi 1 well
The geomechanical model extrapolation to Cagüi 1 well was based on the Puntapiedra 1 well geomechanical data. According to geological uncertainties it was necessary to perform two different scenarios. In the first one, the Paja Formation appeared overlying the Rosablanca Formation and in the second one the Paja Formation was not buried at the exploratory well.
Case 1 – Considering the Paja Formation overlying the Rosablanca Formation with a width to be about one hundred feet. In this case it was necessary to use Bosques 3 well information to model the exploratory well geomechanical behavior. The primary assumption to extrapolate this model was the connected hydraulic flow between Paja and Rosablanca Formations. This results in vertical transmissibility and so the Rosablanca Formation will be overpressurized. According to this, there was an exploratory well geomechanical model proposed which is shown in Figure 12, in this model the well is stable while drilling. It can be observed that Real Formation is mechanically stable but the mudweight window is narrower as it comes deeper in to the well, Colorado and Mugrosa Formations are also stable and they have a collapse density very close to pore pressure which can represent some operationals difficulties while drilling the well, it also can be noticed that Esmeralda, La Paz and Simití are the critical formations since there is an important reduction of mudweight window for these formations due to the reduction in tensile strength, besides of this, drilling can be difficult since Simití is overpressured and mud density to prevent kicks can be as much as 18 ppg.

Case 2 – Considering the Paja Formation is not present on the exploratory well. As in the earlier case in order to model the Rosablanca Formation geomechanical behavior was used the information from Bosques 3 well. Stress state, elastic moduli, rock strength and Mohr-Coulomb failure envelope were modeled from the Tablazo Inferior Formation assuming connected hydraulic flow between this formation and the Rosablanca Formation and geomechanical uniformity. The results from this modeling are shown in Figure 13. As noted earlier this exploratory well is also stable and the wellbore stability is reduced in the Simití Formation even more than in the previous case.
CONCLUSIONS
The described metodology allows to predict, prevent and reduce wellbore instability conditions in order to reduce drilling costs and hazardous conditions.
The performed application demonstrated the linear elastic theory validity for wellbore instability modeling.
This application verifies that well logging and formation tests can be used to obtain necessary data for geomechanical formation modeling.
It was proved that the obtained data from laboratory tests and drilling reports can be used for wellbore stability calibrations.
Continuous updating of geomechanical models leads to more accurate predictions, therefore better models.
ACKNOWLEDGMENT
The authors are greatly indebted to the Cagüi 1 exploration well workteam (Exploration Department, Ecopetrol S.A.), to the Geomechanical and Naturally Fractured Reservoirs research workteam (ICP, Ecopetrol S.A.) and to the exploratory wells supporting technologies workteam (ICP, Ecopetrol S.A.) who contributed to this study over an one-year period.
REFERENCES
Adam, T., Bourgoyne, Jr., Keith, K.M., Martin, E.C., & F.S. Young Jr. (1986). Applied drilling engineering, SPE textsbook series (Vol.2). Richardson , Texas , USA , First Printing SPE, 502 pp. [ Links ]
Aird, P. (2001). Extended leak off testing, kingdom drilling, Rev: 1.0 03/01/01, www.kingdomdrilling.co.uk, Fife , Scotland , Technical report, 15 pp. [ Links ]
Astm International (2002). Designation: D2938 – 95 (Reapproved 2002) standard test method for unconfined compressive strength of intact rock core specimens. ASTM International committee D18 on Soil and Rock, subcommittee D18.12 on rock mechanics, West Conshohocken , Pennsylvania , USA . [ Links ]
Astm International (2002). Designation: D 3148 – 02: standard test method for elastic moduli of intact rock core specimens in uniaxial compression. ASTM International committee D18 on Soil and Rock, subcommittee D18.12 on rock mechanics, West Conshohocken , Pennsylvania , USA . [ Links ]
Astm International (2002). Designation: D 3967 – 05: standard test method for splitting tensile strength of intact rock core specimens. ASTM International committee D18 on Soil and Rock, subcommittee D18.12 on rock mechanics, West Conshohocken , Pennsylvania , USA . [ Links ]
Astm International (2004). Designation: D 2664 – 04: standard test method for triaxial compressive strength of undrained rock core specimens without pore pressure measurements. ASTM International committee D18 on Soil and Rock, subcommittee D18.12 on rock mechanics, West Conshohocken , Pennsylvania , USA . [ Links ]
Astm International (2000). Designation: D 5407 – 95 (Reapproved 2000): standard test method for elastic moduli of undrained intact rock core specimens in triaxial compression without pore pressure measurements. ASTM International committee D18 on Soil and Rock, subcommittee D18.12 on rock mechanics, West Conshohocken , Pennsylvania , USA . [ Links ]
Biot, M.A. (1956). Theory of propagation of elastic waves in a fluid - satured porous solid, II higher frequency range. J. Acoustical Society of America , 28 (2): 179-191. [ Links ]
Charlez, Philippe A. (1991). Rock mechanics. Theoretical fundamentals (Vol. 1). Paris , France : Editions Technip. [ Links ]
Eaton, Ben A. (1969). Fracture gradient predictions and its application in oil field operations. SPE 43 rd Annual Fall Meeting, American Institute of Mining, Metallurgical and Petroleum Engineers, Charleston, West Virginia, Nov. 7 – 8. Also, J. Petroleum Tech., (1968), 21 (10): 1353-1360. October 1969, SPE 2163-PA. [ Links ]
Ecopetrol S.A. - Levantamiento de Secciones Estratigráficas, control de cartografía geológica y medición de fracturas, pliegues y fallas en el bloque Torcoroma. Technical Report. [ Links ]
Geertsma, J. (1966). Problems of rock mechanics in petroleum production engineering. First Congress of International Society of Rock Mechanics, Lisbon, 585-594. [ Links ]
Hubbert, M. H., & Willis, D. G. (1957). Mechanics of hydraulic fracturing. Trans. AIME, 210: 153-166. [ Links ]
Muñoz, A., Olaya, J., García Garavito, D., Díaz Pérez, A., Martins, J.A., & Gongalves J.C. (1996). Metodología Integrada para Análisis de estabilidad de Hoyos. CODICID, Workshop notes, Rio de Janeiro, Brasil. [ Links ]
Nielsen, R.M., & Kohlhaas, C.A. (1979). Acoustic and biaxial measurement of rock mechanical properties for interpretations of logs for design of well completions operations. SPE 54 th Annual Fall Technical Conference and Exhibition, American Institute of Mining, Metallurgical and Petroleum Engineers, Las Vegas, Nevada, Sept. 23 – 26. SPE 8238-MS. [ Links ]
Ortega, G.C., Ramírez, R.A., Mora, C., & Ortega, F. (2002). Interpretación estratigráfica y ambiental de sedimentitas cretácicas en el Valle Medio del Magdalena – Sector Mora Bogotá, Colombia, Ecopetrol S.A. – Instituto Colombiano del Petróleo (ICP), Piedecuesta, Colombia, 70 pp. [ Links ]
Rubiano, J.L., Olaya López, Munar Álvarez, F., Reyes Santos, J.P., Galindo Sanchez, M.L., & Díaz Barrios, O. D. (2001). Estratigrafía de unidades reservorio y sellos en el límite de las cuencas VMM y VSM. Technical Report, División de Exploración y Producción – Área Estratigrafía, Ecopetrol S.A. – Instituto Colombiano del Petróleo (ICP), Piedecuesta, Colombia. [ Links ]
Roegiers, J.C. (1995). Rock mechanics for engineers and geologists. Workshop notes, Ecopetrol S.A. – Instituto Colombiano del Petróleo (ICP), 100 pp. [ Links ]
SCHLUMBERGER (1972). Log interpretation, volume I Principles. Schlumberger Limited 1972 Edition. New York: New York. [ Links ]
Suárez, M. (1998). Evaluación del potencial de entrampamiento del terciario en el bloque Playón (Parte Norte de la Cuenca del Valle Medio del Magdalena). Technical Report, Vicepresidencia Adjunta de Exploración Gerencia de Prospección de Hidrocarburos – Ecopetrol S.A., Bogotá, Colombia, 41 pp. [ Links ]
T. Bourbie, T., Coussy, O., & Zinszner, B. (1987). Acoustics of porous media. Paris, France: Institut francais du petrole publications, Editions Technip. [ Links ]
Tixier, M.P., Loveless, G. W., & Anderson, R.A. (1975). Estimation of formation strength from the mechanical properties log. SPE-AIME 48 th annual Fall meeting, American institute of Mining, Metallurgical and Petroleum Engineers, Las Vegas, Nevada Sept. 30. Also. J. Petroleum Tech., (1973), 27 (3): 283-1360. March 1975 SPE 4532-PA. [ Links ]
Vásquez, H.R., Castilla Escobar, J.A., & Osorio Gallego, J.G. (2004). Modelamiento numérico de la estabilidad mecánica de pozos. Universidad Nacional Sede Medellín, Medellín, Colombia, 120 pp. [ Links ]
Zoback, M.D., Barton, C.A., Castillo, D.A., Finkbeiner, T., Grollimund, B.R., Moos, D.B., Wiprut, D.J., Brudy, M., Ward, C.D., & Pesca, P. (2003). Determination of stress orientation and magnitude in deep wells. International J. Rock Mechanics and Mining Scien. 40 (7 and 8): 1049-1076, October – December. [ Links ]
(Received May 30, 2006; Accepted Oct. 11, 2007)

