Services on Demand
Journal
Article
Indicators
-
 Cited by SciELO
 -
 Access statistics
Related links
-
 Cited by Google
 -
 Similars in
SciELO
 -
 Similars in Google
Share
CT&F - Ciencia, Tecnología y Futuro
Print version ISSN 0122-5383On-line version ISSN 2382-4581
C.T.F Cienc. Tecnol. Futuro vol.3 no.3 Bucaramanga Jan./Dec. 2007
A MODIFIED APPROACH TO PREDICT PORE PRESSURE USING THE D EXPONENT METHOD: AN EXAMPLE FROM THE CARBONERA FORMATION, COLOMBIA
UN método modificado para predecir la presión a poro utilizando el método del expónente D: Aplicación a la formación Carbonera, Colombia
Yully P. Solano1, Rodolfo Uribe1, Marcelo Frydman2, Néstor F. Saavedra3, and Zuly H. Calderón4
1Convenio Ecopetrol S.A. - Instituto Colombiano del Petróleo; Universidad Industrial de Santander, UIS, Bucaramanga, Santander, Colombia e-mail: yupasoti13@hotmail.com
2Schlumberger, Perú, Ecuador, Bogotá, Colombia
3Ecopetrol S.A. - Instituto Colombiano de Petróleo, A.A. 4185, Bucaramanga, Santander,Colombia
4Universidad Industrial de Santander (UIS), -Escuela de Ingeniería de Petróleos-, Bucaramanga, Santander, Colombia
The methodology for pore pressure prediction known as D exponent is a function of an exponent of adjustment that was originally defined for the Gulf of Mexico (Jorden & Shirley, 1966; Eaton, 1972).
A limiting factor of this methodology is the definition of the Normal Compaction Trend (NCT), which needs to be interpreted from the data (Mouchet & Mitchell, 1989). In this study, the D exponent methodology was modified to make it applicable to the Oligocene Carbonera Formation in an oil field of the Llanos foothills, Colombia. The approach consisted of calculating the ratio between effective stress and the D exponent at each well, in order to find a robust NCT for the entire field, thus reducing subjectivity in the traditional D exponent methodology. Pore pressure determinations from Measured Direct Tests (MDT) at one well confirm the predictive capability of our approach.
Keywords: perforation (well), pore pressure, shale, lost circulation, well log, gamma ray, Piedemonte Llanero, Colombia, D exponent, carbonera formation, pore pressure.
La metodología para predicción de la presión de poro conocida como "el método del exponente D" se encuentra en función de un exponente de ajuste que originalmente se definió para el Golfo de México (Jorden & Shirley, 1966; Eaton, 1972). Uno de los factores limitantes de esta metodología es la definición del Tren Normal de Compactación (TNC), el cual necesita ser definido en los datos (Mouchet & Mitchell, 1989). En este estudio, el método del exponente D fue modificado y aplicado a la Formación Carbonera (Oligoceno - Eoceno Sup) en el Piedemonte Llanero, Colombia. La metodología consistió en calcular la relación entre el esfuerzo efectivo y el exponente D para cada pozo, con el fin de encontrar un TNC para todo el campo, reduciendo así, la subjetividad en la metodología tradicional del exponente D.
Las determinaciones de presión de poro de pruebas directas (MDT) en un pozo confirman la capacidad de predicción de nuestra metodología.
Palabras clave: perforación (pozos), poros de presión, shales, pérdidas de circulación, registros de pozos, rayos gama, Piedemonte Llanero, Colombia, exponente D, formación carbonera, presión de poro.
INTRODUCTION
Pore pressure prediction is a key factor in petroleum exploration and production operations. Accurate determination of pore pressure is of fundamental importance to prevent circulation losses or blowouts during drilling (Mouchet & Mitchell, 1989; Bourgoyne, Chenevert, Milheim, & Young, 1991). Because no direct method exists to measure pore pressure in shales, planning and execution of new boreholes relies upon indirect methods (Yoshida, Ikeda, & Eaton, 1996). Several methods such as Bowers (Bowers, 1995), Eaton (Eaton, 1972) and D exponent (Jorden & Shirley, 1966) are available to estimate pore pressure in shales from indirect measurements.
Among these, the D exponent methodology is considered to be an appropriate method of pore pressure estimation while drilling. A restriction of this method is that a Normal Compaction Trend (NCT) needs to be interpreted from the data (Mouchet & Mitchell, 1989). Therefore, results obtained from this method depend upon the skills and judgment of the interpreter, thus introducing possible user bias in definition of the NCT. To reduce uncertainty and user bias, we devised an approach based on calculating the ratio between the effective stress and the D exponent at each well, to further obtain an overall NCT for the entire field.
This paper summarizes our modified approach to the D exponent methodology. We compare results obtained from both the traditional D exponent method and our modified approach, using data from an oil field in the Llanos foothills of Colombia. Our study focused on the Oligocene Carbonera Formation, which poses the greatest drilling difficulties in the field.
PORE PRESSURE PREDICTION
In drilling engineering, methods used to estimate formation pressure can be divided into two categories: prediction methods and detection methods (Moutchet & Mitchell, 1989). Pressure predictive methods are based on seismic velocities (transit times), offset well logs, and well history (Moutchet & Mitchell, 1989; Bourgoyne et al., 1991). Pore pressure detection methods normally use drilling parameters and well logs (MWD/LWD) obtained during drilling (Moutchet & Mitchell, 1989; Bourgoyne et al., 1991).
Most methods to detect and estimate abnormal formation pressure are based on the principle that abnormally pressured formations tend to be less compacted and more porous than formations of similar lithology at the same depth (Moutchet & Mitchell, 1989). As a result, drastic increases in formation porosity may indicate zones of abnormal pressure.
The aforementioned indirect methods were developed and tested in discrete areas of the world, where the local geology may not be comparable to that in other basins. The Llanos foothills of Colombia are known to be an area of unique structural complexity and a poliphase geologic history. Therefore, any methodology to predict pore pressure in the Llanos foothills needs to be adapted to the complex local geology. In this particular study, we tailored the D exponent methodology to make it applicable to the Carbonera Formation of an oil field in the Llanos foothills.
The Oligocene Carbonera Formation overlies the Mirador Formation, and contains the regional top-seal in the area (Fajardo, Cristancho, & Rojas, 2000). The Carbonera Formation is made up of eight members namely C1 (top) through C8 (bottom). The even members (C2, C4, C6 and C8) are shaly units, while the odd members (C1, C3, C5 and C7) are sandy units (Fajardo et al., 2000). The Yopal fault dissects the Carbonera Formation at the C6 or C7 members in the field under study.
The 'D exponent' methodology
The D exponent methodology was developed with the goal of normalizing the penetration rate from drilling parameters. The method was proposed by Jorden and Shirley (1966) based on the Bingham (1969) equation, which was developed to consider the differential pressure effect in normalizing penetration rate. Rehm and Mcledon (1971) modified Jorden & Shirley's equation to include mud weight, as shown in Equation 1. This expression is known as the D exponent equation, calculated from

Where:
R = Penetration rate (ft/h)
N = RPM (Revolutions per minute)
D = Bit diameter (in)
W = Weight on the bit (lb)
ρnormal = Normal hydrostatic gradient (ppg)
ρactual = Current mud weight (ppg)
This method quantifies the correlation between 'drillability' (the bit's capacity of perforating through a rock interval) and overpressured shale sequences found offshore Louisiana using tri-conic bits (Jorden & Shirley, 1966; Rehm & McCledon, 1971; and Moutchet & Mitchell, 1989). The equation also considers the effect of the overburden gradient.
The geologic setting of the Llanos foothills of Colombia is obviously different from the geology of the Gulf of Mexico. The sedimentary sequence in the Llanos, for example, includes alternations between sand and shale deposited in shallow marine environments. In addition, the Llanos foothills are being subjected to lateral stresses of large magnitude, where the maximum horizontal stress is several times larger than the vertical stress (Torres, 2001; Uribe & Solano, 2006).
An advantage of this method is that the results can be obtained in real time, as drilling parameters are collected through sensors. Any other information obtained by the Mud Logging Unit can also be used to detect formation pressure changes. For example, changes in drilling fluid such as total gas content, temperature, density, salinity, etc or changes in characteristics of the formation samples gathered in the shale shaker, such as density, shape and amount, may relate to zones of overpressure (Moutchet & Mitchell, 1989).
The procedure used for estimation of the pore pressure profile from the D exponent is based on Eaton's correlation (Equation 2), (Eaton, 1972), using the adjustment parameter fa determined from the D Exponent. Eaton's correlation is defined by:

Where p is pore pressure, z is depth, pn is normal pressure, p/z is the pore pressure gradient (psi/ft), s/z is the overburden pressure gradient (psi/ft), pn/z is the normal pore pressure gradient (psi/ft), and f a is the adjustment parameter.
The adjustment correlation parameter f a, depends on the type of data available, which may be either sonic, resistivity, or conductivity logs, drilling parameters, etc. According to the above, the following equation is a function of drilling parameters only:

Where: D is the D exponent, and Dn is the normal trend of the D exponent (Normal Compaction Trend, NCT).
Eaton (1972), using this methodology in the Gulf coast proposed that the exponent b in Equation 3 varies between 1,2-1,5. This exponent depends on the regional geologic setting, since it involves the overburden and pressure gradient.
Approach developed for the Llanos foothills
The D exponent methodology provides at least three main operating advantages (Moutchet & Mitchell, 1989): it is a low cost methodology and thus has a minor financial impact on exploration; the method can be performed in real time during drilling; implementation and application is simple, and does not require highly skilled personnel. As it was mentioned earlier, however, the fundamental goal of this study was to derive a less subjective approach to calculating the pore pressure starting from the methodology of the D exponent, applied to the Carbonera Formation of the Llanos foothills.
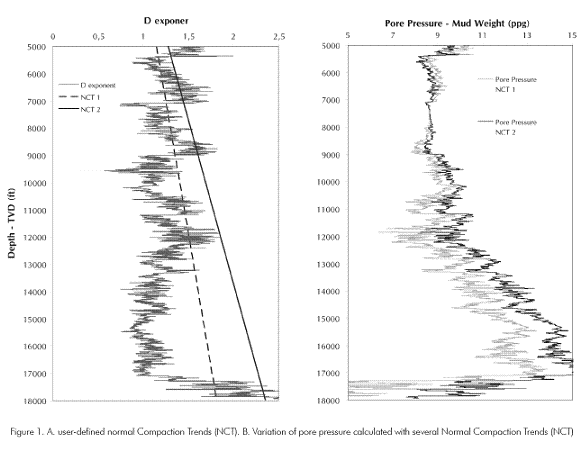
For pore pressure determination, two methodologies were applied on seven wells of the study area. The first approach consisted of applying the standard D exponent method, defining several reasonable Normal Compaction Trends (NCTs) based upon changes in bottom hole assemblage, hole diameter, lithology, geologic age, etc. Each NCT defined in this manner results in a different estimate of pore pressure (Figure 1). For the Gulf of Mexico, values of b in Equation 3 between 1,2 and 1,5
were found most appropriate to estimate pore pressure from conductive, resistivity and drilling parameter logs, while for sonic logs b is closer to 3,0 (Eaton, 1972). In this study, values of b between 1,0 and 1,2 were found appropriate for pore pressure estimation in the Llanos foothills from sonic logs and drilling parameter logs (Uribe & Solano, 2006).
The second approach also applies the D exponent method, but in this case the NCT is derived from a plot of effective stress versus D exponent for all wells in the field. This approach was devised because in normally pressured sediments, D exponent is expected to increase with depth. In addition, effective stress is expected to increase with depth in normally compacted sediments. Therefore, deviations from a trend line in a plot of effective stress versus D exponent should be related to deviations from normal pore pressure.
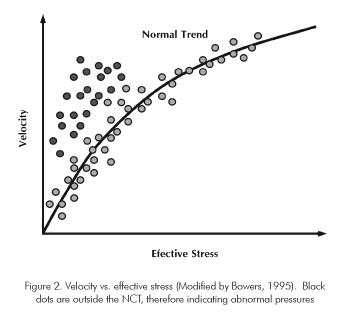
Our approach was based on observations by Bowers (1995), who related seismic velocity to effective stress. He recognized that pore pressure can be estimated using the ratio between effective stress and velocity in normally pressured sediments, while values outside the NCT correspond to abnormal pressures (Figure 2).
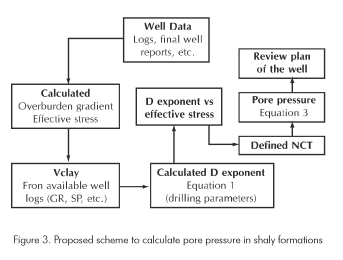
Our approach was applied according to several considerations. A database of gamma ray, sonic, and density logs, pressure tests, event drillings, formations tops, etc., needs to be compiled. Calculations must be made in TVD (True Vertical Depth). In addition, the normal overburden gradient needs to be calculated as an input to Equation 2 and for estimation of effective stress.
The first step is calculating the overburden gradient and the effective stress. The overburden gradient can be calculated from density logs using standard techniques (Moutchet & Mitchell, 1989). Estimation of effective stress can be accomplished using Terzaghi's equation (Therzaghi, 1968). The second step in our approach consisted in calculating the clay volume (VClay) from available well logs. Subsequently, depth, VClay, effective stress, mud weight and D exponent data are grouped by geological formation. Outliers are identified and removed from the data set.
Next, a graph of D exponent versus effective stress is built from all data points. A best-fit function is then calculated from the data points that fall in the normally compacted section. This function is used to obtain the normal trend of the D exponent Dn. Finally, Equation 3 is solved for the interval of interest at each well. The above procedure is summarized in Figure 3.
Application to the Carbonera Formation
The approach developed in this study was performed on data from the Carbonera Formation drilled at seven wells in an oil field of the Llanos foothills, Colombia.
For the study area, an overburden gradient of 1,05 psi/ ft was estimated. A normal pore pressure gradient of 0,449 psi/ft, taken from the first direct pressure tests performed in the area, was also used in Equation 2 and for estimation of effective stress using Terzaghi's equation (Terzaghi, 1968).
For VClay calculation in this area, the GR logs were deemed to provide the best input data. Therefore, VClay was calculated from GR logs, using a cutoff of 0,35. Subsequently, the D exponent versus effective stress plot was built from all data (over 25 000 points). Final well reports from boreholes in the field of study indicate that the upper section of the Carbonera Formation (C1 to C5) does not typically present overpressure. Therefore, a NCT was drawn based on data points from the upper section of the Carbonera Formation on the D exponent versus effective stress plot. Since this plot encompasses data from all wells available in the field, this trend is considered as representative of the Carbonera Formation in the entire field (Figure 4).
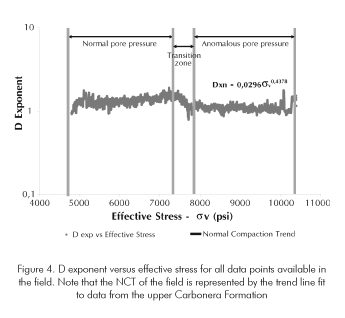
The function that best represents the NCT for our data is a power law function of the form

where Dxn is the NCT and sv is the effective stress in psi.
Although a linear trend can be fit on these points with a slightly higher R2 coefficient than Equation 4, the power law function worked best on the well where pressure tests (MDT) of the Carbonera Formation are available. Pore pressure was obtained by replacing Dxn in Equation 3. The b exponent found with this approach was 1,0 (Equation 3).
In addition to the NCT of the field, Figure 4 shows zones of departure from normal pressure conditions. An intermediate zone is shown where data begin to deviate from the NCT. This transition zone is characterized by a rapid decrease in D exponent (from 1,6 down to 0,9) over a short interval of effective stress. Abnormal pore pressure conditions are observed to the right of the transition zone in Figure 4, where D exponent data are completely off the NCT. In this case, abnormal pore pressure conditions are evidenced for nearly constant D exponent values that fall under the NCT line (Figure 4).
Results
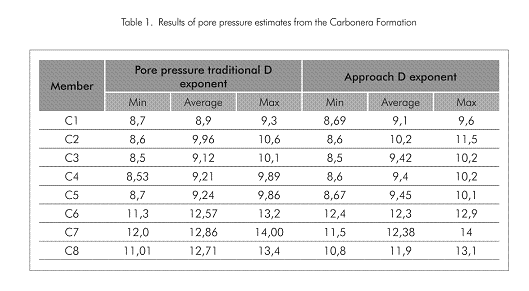
Results obtained from our approach are summarized in Figure 5. This Figure shows the intervals of the Carbonera Formation drilled at each of the seven wells in the field studied. The vertical axes is TVD in feet, and the horizontal axes for each panel shows pore pressure. To compare pore pressure with mud weight, the horizontal scale is presented in parts per gallon (ppg). In addition, members C1 through C8 of the Carbonera formation are outlined. Each panel shows three lines. The gray thin line represents mud weight used at drilling; the gray thick line represents pore pressure obtained with the standard D exponent method; and the black line represents pore pressure calculated with our approach. Note that results for the normally pressured section (C1 through C5) are quite in agreement between the two approaches. For the lower section where high pressure conditions are evidenced by the sharp increase in mud weight (C6 through C8), our approach provides consistently lower estimates than the standard D exponent method, for all but well 4 in the diagram (Figure 5). In none of the wells our approach estimated higher pore pressures than the standard method. Minimum, average and maximum pore pressure estimates using both techniques are shown in Table 1.
Discussion
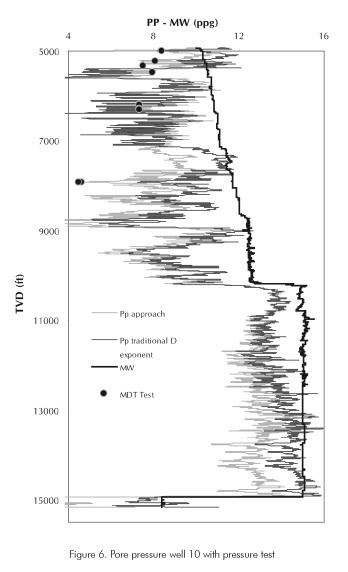
To examine the validity of the proposed approach, we compared our results with measured direct tests (MDT) data from well 10. Pressure tests are uncommon in the overburden column –namely the Carbonera Formation- in this area. Well 10 is an exception, since 8 MDT data points were taken on the Carbonera Formation and were made available for this study. Figure 6 shows comparison between the standard approach and the proposed approach with MDT data. Note that our approach honors 7 points, while the standard method only honors 3 points. Note also that our approach is consistent with mud weight, which is an indicator of the actual well conditions during drilling. Mud weight used during drilling well 10 was appropriate, since no pore pressure issues were reported.
CONCLUSIONS
• By using the ratio between D exponent and effective stress, pore pressure can be estimated more accurately than the standard D exponent method for shaly formations. This approach is more objective for definition of the normal compaction trend, because the NCT is defined for the entire field rather than for individual wells.
• Abnormally pressured sections of the Carbonera Formation were easily identified using the proposed approach. The C6 through C8 members of this Formation display abnormally high pressure conditions.
• We were able to establish an adjustment exponent b for the Carbonera Formation in the study area using the standard D exponent method. This exponent varies from 1,0 to 1,2, in clear contrast with the 1,2 to 1,5 range that is widely used worldwide based on data from the Gulf of Mexico. The b exponent found for the modified pproach is 1,0.
• This study confirmed that the standard D exponent methodology as well as the proposed approach provide reasonable pore pressure determinations before and during drilling operations.
ACKNOWLEDGEMENTS
The authors are grateful to Universidad Industrial de Santander and the Instituto Colombiano del Petróleo, Ecopetrol S.A. We are also thankful to the Wellbore Stability Research Group of UIS-ICP, Geomechanics group of Schlumberger and German Ojeda of ICP
REFERENCES
Bingham, M. G., Milchen, Inc. (1969). "What is balanced pressure drilling?". Fall Meeting of the Society of Petroleum Engineers of AIME, Denver, Colorado, USA, SPE 2541-MS. [ Links ]
Bourgoyne, A. T., Chenevert, M. E., Millheim, K. K., & Young, Jr. (1991). Applied drilling engineering. SPE Textbook Series, 2. [ Links ]
Bowers, G. L. (1995). Pore pressure estimation from velocity data: Accounting for overpressure mechanisms besides undercompaction. SPE Drilling and Completions. Dallas, USA. [ Links ]
Eaton, B. A. (1972). Graphical method predicts geopressures worldwide. World Oil 7 (76): 100-104. [ Links ]
Fajardo, A., Cristancho, J., & Rojas, L. (2000). "Definición del modelo estratigráfico en la Cuenca Llanos Orientales y Piedemonte Llanero". Ecopetrol S.A., Piedecuesta - Santander, Colombia. [ Links ]
Jorden J. R., & Shirley, O. J. (1966). Application of drilling performance data to overpressure detection. J. Petroleum Technology, 1387-1394. [ Links ]
Mouchet J. P., & Mitchell, A. (1989). Abnormal pressure while drilling. Manuals techniques 2. Boussens, France, Elf Aquitaine Editions. [ Links ]
Rehm, B., & McCledon, R. (1971). Measurement of formation pressure from drilling data. Fall Meeting of the Society of Petroleum Engineers of AIME, New Orleans, Louisiana, USA. SPE 3601 [ Links ]
Terzaghi, K., & Peck, M. (1968). Soil mechanics in engineering practice. New York: John Wiley and Sons. [ Links ]
Torres, M. E. (2001). Determinación de esfuerzos In-Situ en la cordillera oriental del Colombia. Tesis de grado Magister en Geotecnia, Universidad Nacional de Colombia, 252 pp. [ Links ]
Uribe, R., & Solano, Y. P. (2006). Predicción de la presión de poro en problemas relacionados con la estabilidad de pozos. Tesis de grado profesional Escuela de Geología, Universidad Industrial de Santander, 194 pp. [ Links ]
Yoshida, C., Ikeda, S., & Eaton, B. (1996). An investigative study of recent technologies used for prediction, detection, and evaluation of abnormal formation pressure in North and South America. Kuala Lumpur, Malaysia. September 9-11. [ Links ]
(Received June 5, 2006; Accepted Oct. 11, 2007)


