


Services on Demand
Journal
Article
 English (pdf)
 Article in xml format
 Article references
 Send this article by e-mail
Indicators
-
 Cited by SciELO
 -
 Access statistics
Related links
-
 Cited by Google
 -
 Similars in
SciELO
Similars in
SciELO -
 Similars in Google
Share

 Permalink
CT&F - Ciencia, Tecnología y Futuro
Print version ISSN 0122-5383On-line version ISSN 2382-4581
C.T.F Cienc. Tecnol. Futuro vol.3 no.3 Bucaramanga Jan./Dec. 2007
DETAILED CHEMICAL CHARACTERIZATION OF PETROLEUM MIDDLE FRACTIONS BY CHEMOMETRICS ANALYSIS OF THEIR ULTRAVIOLET SPECTRUM
Caracterización química detallada de fracciones medias del petróleo mediante el análisi quimiométrico de sus espectros ultravioleta
Carlos-A. Baldrich Ferrer1, and Luz-Ángela Novoa Mantilla1
1Ecopetrol S.A. - Instituto Colombiano del Petróleo, A.A. 4185, Bucaramanga, Santander, Colombia e-mail: carlos.baldrich@ecopetrol.com.co To whom correspondence may be addressed
Chemometric analysis has been applied in this work to correlate ultraviolet spectra of middle distillates and vacuum gas oils with hydrocarbon type analytical data obtained by high resolution mass spectrometry. The use of this methodology reduces the costs of chemical characterization of these types of petroleum fractions and may be applied to the characterization of diesel fuels and gas oils that are processed in fluid catalytic cracking or hydrotreating units.
Keywords: chemometrics, UVVIS Spectroscopy, hydrocarbon type analysis, chemical analysis of petroleum fractions.
Se presentan resultados de la predicción de la composición detallada de fracciones medias y destilados de vacío del petróleo por tipo de hidrocarburo a partir del espectro ultravioleta visible de estas fracciones. Se aplican métodos quimiométricos para correlacionar los datos espectrales con la composición química por tipo de hidrocarburo determinada por espectrometría de masas de alta resolución. El uso de esta metodología permite reducir considerablemente el costo de caracterización detallada de fracciones medias y gasóleos de vacío; y puede ser aplicado como método de caracterización de diesel y gasóleos de vacío que se utilizan como carga a procesos de craqueo catalítico o de hidrotratamiento catalítico.
Palabras clave: quimiometría, espectroscopia UVVIS, análisis tipo de hidrocarburo, análisis químico de fracciones del petróleo.
INTRODUCTION
Detailed information about the individual components of a petroleum fraction is only possible for light fractions. Gas chromatography is the only analytical technique that allows separating and identifying all the components in a fraction that distills below 200°C (473,15 ºF). In heavier petroleum fractions the occurrence of isomers is so great that no chromatographic column can separate all the possible components. Because of these limitations the appropriate way to express the chemical composition of these types of petroleum fractions is in terms of compound families and not of individual components.
Hydrocarbon type analysis by mass spectrometry is one of best methods used to define chemical composition of middle and heavy petroleum fractions. The technique as originally developed was applied to narrow petroleum fractions that could be volatilized in the source of the mass spectrometer.
Low resolution methods are usually applied to fractions of the sample to eliminate the interference between the compound types (ASTM D2786, ASTM D3239), but the Robinson method (Robinson, 1971) is the only low resolution method which can be applied to the complete fraction without any fractionation. High resolution methods allow performing the analysis without requiring previous sample separation (Fisher, 1974; Teeter, 1985; Bouquet, & Brument, 1990; Roussis, & Fitzgerald, 2001). These methods were developed under electron impact that produce a high fragmentation of the molecules but there are also methods which produce low fragmentation (Malhotra, Coggiola, Young, Tse, & Buttrill, 1984).
The results of these methods may be used for determining the potential that a feedstock has to generate selected products in Fluid Catalytic Cracking (FCC) and other petroleum processes. For example, the major reaction which occurs in the FCC unit is fission of paraffinic and cycloparaffinic bonds (this includes dealkyklation of aromatic compounds). Aromatic rings are generally not cracked. Thus paraffins, cycloparaffins and monoaromatics are gasoline precursors in the FCC process (Fisher, 1990).
The methodology also could be used for following changes in the composition in of FCC feedstocks that have been subjected to a hydrotreating process in order to improve their quality (Ng, S., Zhu, Y., Humphries, Zheng, Ding, Gentzis, Charland, & Yui, 2002) (Baldrich & Novoa, 1995).
The analysis by mass spectrometry is, however, very expensive and it is used only for research applications. On the other hand, routine analyses require fast and cheap methods that give the information required for the process engineer.
Ultraviolet spectroscopy is a low cost technique used for monitoring some properties of petroleum products such as the naphthalenes content of jet fuel (ASTM D1840), and the aromatics content in some petroleum fractions (Varotsis and Pasadakis, 1997). These types of applications rely on the strong absorption of ultraviolet radiation by aromatic compounds due to the occurrence of conjugated electrons their structure. (Scheinmann, 1973)
This paper deals with a chemometric approach for estimating, from the ultraviolet visible (UVVIS) spectrum of diesel fuel and gas oils samples, the detailed chemical composition equivalent to that obtained in the hydrocarbon type analysis by high resolution mass spectrometry.
It should be mentioned that in the literature there are very few applications of chemometrics to ultraviolet spectroscopy (UVVIS) of petroleum fractions. One of these applications has been reported by Wentzell, Andrews, Walls, Cooley, and Spencer (1999) who used a chemometric approach using ultraviolet spectroscopy data to estimate the hydrocarbon types in diesel fuel and light gas oil samples. In their research they established a good correlation between the UVVIS spectra and saturates and aromatic compounds contents of the samples determined by supercritical fluid chromatography (SFC) with FID detection. In their study they were able to quantitate three types of aromatic compounds (mono, di and polyaromatics).
This report attempts to correlate the ultraviolet spectra of middle distillate fractions and gas oils with more compound type families with the idea of reducing the time and the cost of a detailed chemical characterization for these types of petroleum fractions.
EXPERIMENTAL WORK
Samples to be used in this research were obtained by direct distillation of crude oils in laboratory distillation units according to ASTM D2892 (atmospheric samples) and ASTM D5233 (vacuum gas oils). Table 1 specifies the samples giving information about cut range in the distillation unit. The crude type from which the cuts were obtained was defined by the characteristics of naphtha and gas oil (Nelson, 1979).
Table 2 contains the chemical composition of all the samples used in this research. Hydrocarbon type analysis is expressed in terms of mono, di, tri, tetra, poly and aromatic sulphur compounds. The high resolution mass spectrometry analyses were performed in a double sector mass spectrometer Autospec VG Ultima. The samples were introduced to the source of the mass spectrometer throughout a Gas Chromatograph (GC) column connected. During the experiment the source was operated under high resolution conditions (dynamic resolution of 7000) at a temperature of 250 °C (523,15K), the accelerating voltage was 8 KV and the ionization energy was 50 ev. The total chromatographic ion current was averaged for processing the spectra. The mass spectra data was converted to hydrocarbon type data using the Fisher modified matrix (Bouquet and Brument, 1990) included in proprietory software developed by Ecopetrol S.A.- ICP for running hydrocarbon type analysis by high resolution mass spectrometry.
The ultraviolet spectra were obtained in a Hewlett Packard 8453 instrument. The solvent used was spectroscopic grade cyclohexane. The thickness of the cells used was 1 mm. All the spectra were normalized taking into account the mass of the analyzed sample.
The chemometric data analysis was computed with the Unscrambler software V. 9.6 of Camo. To correlate the UVVIS spectral data and the hydrocarbon type information a PLS regression was performed on the data set. To validate the prediction models, full cross validation was employed, and the cross validation was also used to find the optimum number of latent variables to be used in the models.
Additionally, some samples not included in the calibration set were analyzed by this methodology in order to assess the performance of the method. These samples include those from lab distillation units which were similar to those of the calibration set and some gas oils that had been hydrotreated in a bench scale unit. The last samples were used to test if the methodology could be applied to monitoring chemical changes in the type of processes used by refineries to improve the quality of some feedstocks.
RESULTS
According to the data presented on Table 2 and, as expected, the aromatic content of all the samples increases as these become heavier. Taking into account the crude oil classification, the most clearly observed trend is that naphthenic crude oils are characterized by low paraffin content. There is no additional clear trend with respect to the other hydrocarbon types and crude oil classification.
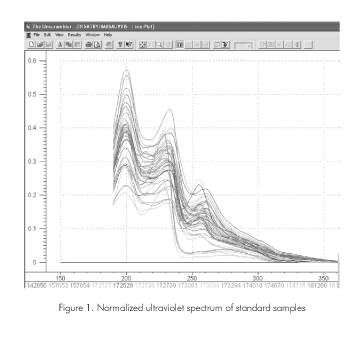
Figure 1 shows the ultraviolet spectrum of the samples in the region 190 to 400 nm. The spectra that are shown in this figure correspond to the normalized ones taking into account the mass of the analyzed sample and the dilution volume. The graph shows important differences between the different spectrums.
The performance of the individual models for each of the compound types is shown in Figures 2 to 8. The predictive models here developed to determine mono aromatics, di aromatics, tri aromatics, tetra aromatics, poly aromatics (tetra+ aromatics), aromatic sulphur compounds and saturated compounds.
In all these graphs there appear the scores plot, the regression coefficient plot, the explained variance plot and measured versus predicted plot. The scores plot is a bi dimensional map of the scores of different cases in two defined principal components. This gives information about some trends in the samples. Inside the ellipse in the scores plot are similar samples in terms of their spectra. Those that lie outside are samples that show differences in terms of their spectra.
The regression coefficients plot summarizes the relationship between the spectrum and the properties. In PLS the regression coefficients could be calculated for any pair of component numbers. The total explained variance plot shows how much of the data variance is explained by each component. The last plot shows the predicted versus the experimental value.
Figures 2 shows the performance of the models for predicting the content of mono aromatics. The model uses three components to explain the data variance. All the predicted values are close to the experimental values.
The information presented in Figures 2 shows a good relationship between predicted and experimental data both in calibration and validation. In the case of the third component there is a high positive correlation between the spectral region near 200 nm and 240 nm and a negative correlation between the spectra and the region near 255 nm.
Figures 3 shows the scores, regression coefficients, explained variance and regression line graphics for the content of di aromatic. The model requires 6 components to explain most of the variance of the data. Here, the regression coefficients plot indicates that in the sixth component these types of compounds are positively related to the spectral region around 210 nm, 236 nm, 256 nm and 299 nm. There is a negative relationship for di aromatic content in the spectral region near 200 nm, 228 nm, 244 nm and 272 nm.
Figures 4 shows the model predictions for tri aromatic compounds. In this case 2 components explain most of the variance and the regression coefficients plot indicates a positive correlation with the spectral regions around 261 nm, 240 nm and 214 nm. There is also a negative correlation with the 200 nm and 229 nm spectral regions.
Figures 5 shows the model prediction results for tetra aromatics. The regression coefficients plot indicates positive correlation between the spectral region around 266 nm, 294 nm and 309 nm and the tetra aromatics content. There is a negative correlation of this aromatic type with the spectral regions around 210 and 250 nm. A similar trend is observed with the poly aromatic compounds (see Figure 6).
These results indicate that when the aromatics become more complex they absorb energy at longer wavelengths of lower energy. This trend is to be expected. More complex aromatics are more highly conjugated than less complex ones and are thus more easily excited.
Figure 7 shows the model prediction results for the aromatic sulphur compounds. This parameter is positively related for the first component with the spectral region near 235 nm, 245 nm and 268 nm. There is a negative relationship with the spectral region near 200 nm, 238 nm, 254 nm, 262 nm and 279 nm.
Figure 8 shows how the saturates content is positively related for the third component with the spectral region near 223 nm, 216 nm and 255 nm and is negatively related with the spectral region near 200 nm, 239 nm and 266 nm.
All the above information indicates a high interference between the different types of compounds in the UVVIS spectral region. This information is important when developing analytical methods using this technique.
Table 3 summarizes the performance of the different predictive models obtained by correlating the UVVIS spectrum with the chemical composition of the calibration sample set. All the models were obtained without eliminating any of the calibration set samples despite one or two samples which lie outside the enclosing ellipse. (See the scores plot in figs. 2 to 8.
For each model it is shown the number of components for expalining the variance in the data, the maximum variance explained in x and y variables, the correlation coefficient for calibration and prediction, the standard calibration error (SEC), the standard prediction error (SEP), the bias in calibration and prediction.
The prediction models improve when the component numbers required to explain the observed variance are lower and the explained variance in Y and X is higher. As a result, all the models for predicting aromatics are satisfactory while those which predict the cycloparaffins (monocycloparaffins and di and more complex cycloparaffins) are less so because of the high number of components (more than 10) and the low explained Y variance values (>70%). Also, the models for predicting cycloparaffins and paraffins show a high difference between the calibration and validation errors. These facts indicate that there are some problems in the models.
The models for estimating total saturated compounds are better than those for estimating the individual saturated compounds models. Taking into account that saturated compounds do not absorb ultraviolet energy, the acceptable performance of the model for predicting saturated compounds content could be most related to the good relationship between the spectra and the aromatic compounds concentration. As saturated compounds content represents the difference between 100 and the total percentage of aromatics, it is reasonable to observe a good correlation between this difference and the experimental spectra. In general, all the correlation coefficients are high in calibration and validation indicating that the models are sound.
Tables 4 summarizes the chemical composition data predicted from the UVVIS spectra of different cuts obtained by distillation of some crude oils from the lab distillation units according to ASTM D2892 and D 5237. The tabulated data includes the predicted values and the expected deviation. The data presented in this table follow expected trends in the sense that for any given crude oil the heavier the cut the higher the aromatic and aromatic sulphur contents.
Table 5 that shows the predicted chemical composition of the samples that were not included in the calibration set are close to those obtained by mass spectrometry. The observed differences confirm that this method can be used to characterize crude oil fractions. This approach reduces the cost of chemical analysis and gives an alternative tool for obtaining this information.
Table 6 shows the results obtained by application of the method to monitoring the compositional changes in vacuum gas oils during a hydrotreating process. The data show that there is an increase in saturates and monoaromatics and a reduction in the other species as a result of the hydrogen addition. These changes follow the expected trends and the results allow the hydrogen consumption to be calculated from a material balance.
CONCLUSIONS
- All the correlations found in this work indicate that there is a strong relationship between the ultraviolet spectrum of the samples and the different types of compounds defined here.
- From the Ultraviolet spectrum of a middle petroleum fraction (diesel fuel and light vacuum gas oils) it is possible, using a chemometric approach, to predict the concentration of different compositional families such as mono, di, tri, tetra+ aromatics, aromatic sulphur compounds and total saturated compounds.
- The relative errors are low in species of high concentration like mono, di and tri aromatics but may be high for species present in low concentration such as tetra+ aromatics and aromatic sulphur compounds. In spite of this the method enables acquiring fast, cheap and accurate information about the concentration of the different compounds in middle petroleum fractions.
- The chemometric approach proposed here, using the ultraviolet spectrum to determine the chemical composition of petroleum fractions, has applications in the crude oil characterization of middle distillates and light and middle gas oils and could be used for following the trends in hydrotreating heavy petroleum fractions.
ACKNOWLEDGEMENTS
The authors give special thanks to Dr. Ian P. Fisher for his very important and unselfish comments that improved the document.
Also it should be mentioned the special cooperation of the Spectroscopy lab manager of the analytical Coordination area of ECOPETROL ICP, for the analysis of the different samples used on this research and for giving access to all the information about the samples.
REFERENCES
ASTM D1840. Naphthalene hydrocarbons in aviation turbine fuels by ultraviolet spectrophotometry. [ Links ]
Baldrich, C., y Novoa L. (1995). La espectrometría de masas como herramienta para evaluar los cambios químicos producidos en el hidrotratamiento catalítico de corrientes de refinería del petróleo. CTYF- Ciencia, Tecnología y Futuro, 1 (1): 33-43. [ Links ]
Bouquet, M.y Brument, J. (1990). Characterization of heavy hydrocarbon cuts by mass spectrometry routine and quantitative measurements. Fuel Scien. and Technol. Int., 8 (9): 961-986. [ Links ]
Fisher, I. P., y Fisher, P. (1974). Analysis of high boiling petroleum streams by high resolution mass spectrometry.. Talanta, 21: 867-875. [ Links ]
Fisher, I.P. (1990). Effect of feedstock variability on catalytic cracking yields. Applied Catalysis, 65: 189-210. [ Links ]
Malhotra, R., Coggiola, M. J., Young,S. E., Tse,D., Buttrill,S. E. Jr. (1984). Analysis of middle distillate fuels by high resolution field Ionization mass spectrometry. Annual Report. SRI 1: 82-31. [ Links ]
Nelson, W. L. (1979). Which base of crude oil is the best? Part 1. Oil and Gas Journal, 112-114. [ Links ]
Ng, S ., , Zhu, , Humphries, A., Zheng, L., Ding, F., Gentzis, T., Charland,J.P., y Yui, S. 2002). FCC study of canadian oil-sands derived vacuum gas oils. 1 feed and catalyst effects on yield structure.Energy y Fuels,16 5): 1196-1208. [ Links ]
Robinson, C.J. (1971). Low-resolution mass spectrometric determination of aromatics and saturates in petroleum fractions. Analytical Chemistry, 43 (11): 1425-1433. [ Links ]
Roussis, S. G., & Fitzgerald, W. P. (2001). Hydrocarbon compound type analysis by mass spectrometry: on the replacement of the all-glass heated inlet system with a gas chromatograph. Energy & Fuels, 15 (2): 477-486. [ Links ]
Scheinmann F. (1973). An introduction to spectroscopic methods for the identification of organic compounds. (Vol. 2). Oxford. Pergamon Press. 93 -128 [ Links ]
Teeter, R.M. (1985). High resolution mass spectrometry for type analysis of complex hydrocarbon mixtures. Mass Spectrometry Reviews, 4 (1): 123-143. [ Links ]
Varotsis, N., & Pasadakis N. (1997). Rapid determination of aromatic groups in lubricating oils using gel permeation chromatography. Ind. And Eng. Chem. Res. 36 (12): 5516-5519. [ Links ]
Wentzell, P., Andrews, D., Walls, J., Cooley, J., & Spencer, P. (1999). Estimation of hydrocarbon types in light gas oils and diesel fuels by ultraviolet absorption spectroscopy and multivariate calibration. Canadian Journal of Chemistry, 77 (3): 391. [ Links ]
(Received, May 22, 2007; Accepted Oct. 1, 2007)

