Services on Demand
Journal
Article
 English (pdf)
 Article in xml format
 Article references
 Send this article by e-mail
Indicators
-
 Cited by SciELO
 -
 Access statistics
Related links
-
 Cited by Google
 -
 Similars in
SciELO
Similars in
SciELO -
 Similars in Google
Share

 Permalink
CT&F - Ciencia, Tecnología y Futuro
Print version ISSN 0122-5383On-line version ISSN 2382-4581
C.T.F Cienc. Tecnol. Futuro vol.3 no.4 Bucaramanga Jan./Dec. 2008
DESARROLO DE CORRELACIONES EXPERIMENTALES ENTRE PÁRAMETROS DE IDENTACIÓN Y LA RESISTENCIA COMPRENSIVA UNIAXIAL (UCS) PARA MUESTRAS DE SHALE
1Universidad Industrial de Santander, UIS, Bucaramanga, Santander, Colombia
2,4Ecopetrol S.A. - Instituto Colombiano de Petróleo, A.A. 4185 Bucaramanga, Santander, Colombia
3Universidad Industrial de Santander (UIS), Facultad de Ingenierías Físico-Químicas, Bucaramanga, Colombia
e-mail: ricardoandres8406@yahoo.es Darwin.mateus@ecopetrol.com.co
(Received April 30, 2008; Accepted Nov. 21, 2008)
* To whom correspondence may be addressed
ABSTRACT
Unconfined Compressive Strength (UCS) is one of the rock mechanical properties that is important take into account during drilling operations in order to avoid wellbore instability. During drilling operations, UCS variability influences wellbore stability more than other factors such as azimuth, slope, exposure time, and mud weight (Jaramillo, 2004). In last years, the indentation technique has been demonstrated to be an appropriate method for determining rock strength in real time during oil well drilling. This technique implements correlation that allow UCS evaluation from indentation parameters such as Indentation Module (IM) and Critical Transition Force (CTF), that can be measured on small rock fragments obtained during drilling.
Shale formations in well drilling have demonstrated to be a hindrance since they represent the most important problem in reservoir stability (Abass, H., A. et al. 2006). Therefore, the main objective of this article is to find experimental correlations that allow the modeling of rock strength by applying the indentation technique to reservoir plug. The importance of this technique is the possibility to get rock strength properties in real time during drilling operations, although, those reservoir sections which do not have neither direct UCS records nor indirect measurements.
Eight Unconfined Compression Tests (UCS) on rock cylinders (plugs) extracted from the Paja formation upwelling were conducted in order to develop the corresponding experimental correlations. Two hundred indentation tests were also simultaneously conducted on shale fragments extracted from each plug surroundings in order to simulate the cavings obtained from reservoir drilled. Results of both tests were correlated using the Minimum Square technique, seeking the best correlation that shall represent result behavior, thus obtaining two 2nd-degree polynomial correlations. Correlation coefficients of 0,6513 were determined for the (IM) - (UCS) correlation and 0,8111 for the (CTF) - (UCS) correlation. This demonstrates that the highest correlation between indentation parameters and (UCS) is obtained with the Critical Transition Force (CTF).
Key words: well stability, geomechanics, compressive strength, shales, formación paja, Colombia.
RESUMEN
La Resistencia Compresiva Uniaxial (UCS), es una de las propiedades mecánicas de las rocas que se debe tener en cuenta durante las operaciones de perforación para evitar la inestabilidad de pozos (Abass H., A. et al. 2006). Durante las operaciones de perforación el UCS de las formaciones es la variable de más alta influencia por encima de factores como el azimut, la inclinación, el tiempo de exposición e incluso el peso del lodo de perforación (Jaramillo, 2004). La técnica de Indentación ha demostrado en los últimos años ser adecuada para ayudar a determinar la resistencia de las rocas en tiempo real durante la perforación de pozos, mediante la implementación de correlaciones que permitan evaluar el UCS a partir de los parámetros de Indentación conocidos como Módulo de Indentación (IM) y Fuerza Crítica de Transición (CTF), medidas en pequeños fragmentos de roca obtenidos de la perforación de pozos.
La resistencia de los shales ha demostrado ser muy problemática durante la perforación. Por este motivo el principal objetivo de este trabajo es encontrar correlaciones experimentales que permitan modelar la resistencia de la roca a través de la aplicación de la técnica de indentacion a muestras de roca. Lo interesante de esta técnica es la posibilidad de obtener propiedades de resistencia en tiempo real durante la perforación, incluyendo esas secciones del reservorio en las que no existen registros directos UCS ni mediciones indirectas.
Con el fin de desarrollar las correlaciones experimentales se realizaron ocho pruebas de Compresión Uniaxial (no confinada) sobre cilindros de roca (plugs) extraídos de muestras de afloramiento de la formación Paja. A la vez re realizaron 200 pruebas de Indentación sobre fragmentos de shale extraídos de los alrededores de cada plug simulando los ripios que se obtienen de la perforación de pozos. Los resultados de ambas pruebas fueron correlacionados por medio de la técnica de mínimos cuadrados y se buscó la mejor correlación que representara el comportamiento de los resultados, permitiendo así obtener dos correlaciones polinomiales de segundo grado. Se determinaron coeficientes de correlación de 0,6513 para la correlación IM-UCS y 0,8111 para la correlación CTF-UCS, mostrando así que la mayor correlacionalidad entre parámetros de indentación y el UCS se da con el parámetro de Indentación conocido como Fuerza Critica de Transición (CTF).
Palabras Clave: estabilidad de pozos, geomecánica, resistencia compresiva, shales, formación paja, Colombia
INTRODUCTION
The Petroleum industry nowadays has focused its attention on geomechanics since this is the field of science that contributes to the understanding and problem - solving regarding reservoir stability. Rock Unconfined Compressive Strength (UCS) is one of the most important factors to consider when conducting a geomechanical study in wells being drilled. This is an essential parameter for the construction of mud windows. Therefore, it is important to know how this rock property is behaving as drilling operations advance so well instability problems such as fluid filtration or reservoir collapse can be avoided.
Recent studies conducted by the Petroleum Industry found that one of the main factors influencing oil well stability is Rock Strength. This was determined by a statistical geomechanical model designed for the study of well stability during drilling operations at the eastern planes of Colombia. It was found that Unconfined Compressive Strength (UCS) of formations is most influential variable, even above other factors such as azimuth, slope, exposure time, and mud weight. (Jaramillo R.A 2004). These conclusions have caused an increase in the interest for efficient and reliable (UCS) calculation in the petroleum industry.
Traditionally, the techniques used for (UCS) determination in rocks have been: conduction of non-confined direct compression test on rock plugs extracted from reservoirs in the process of being drilled and by calculating (UCS) profiles from electrical records. Both traditional techniques exhibit technical, operational and/or economic shortcomings.
Conduction of direct tests on rock plugs is done on a low-frequency basis to the extent that it is only limited to the area of interest (Ringstad et al., 1998). Therefore, there is vast deficiency of information to make a good characterization of the mechanical behavior of drilled formations. The reason is clear: obtaining deep rock plugs has a great impact both at technical and operational levels that is reflected on a substantial cost increase regarding the development of a drilling plan.
Utilization of indirect methods for Unconfined Compressive Strength (UCS) determination, such as electrical logging, have brought about the development of correlations that determine (UCS) using parameters obtained from electrical records. This is the case of the T. M. Warren technique (Winters, W. J., Warren, T. M., et al. 1987). These techniques also exhibit limitations since electrical records are affected by the reservoir status since they can only be conducted once the reservoir drilling process has been completed (thus preventing the understanding of rock properties being drilled in real time). These results are only obtained for the producing areas and therefore, it is almost impossible to conduct a complete analysis of rock strength in the materials found along the drilled well using these techniques.
These direct and indirect techniques for rock strength determination become even more complex and complicated when they are attempted to be conducted on clay rocks such as shales. Therefore, the petroleum industry has focused its efforts lately on the development of new techniques and procedures to obtain reliable, real-time results regarding mechanical properties of rocks. This is precisely the case of the indentation test (Ringstad
-
1996. Santarelli, F. J., Marshala, A. F., Brignoli, M., Rossi E. and Bona N., published an extensive work where diverse rock formations are evaluated from formation debris. They conclude that the formation debris material is reliable for the evaluation of formation properties used in the study the biomechanical properties of this oil well.
-
1997. Zausa, F., Civolani, L., Brignoli, M. and Santarelli, F. J., published the work analyzing oil well stability in real time during the drilling process. The Indentation Technique and other mechanical tests are applied on cavings in order to characterize reservoir stability.
-
1998, Ringstas et al., conducted linear correlations of the (y = ax) type between indentation parameters and Unconfined Compressive Strength (UCS) for diverse lithology types such as sandstones, shales, and limestones from different formations and degrees of hardness.
-
1999, Uboldi, V., Civolani, L., and Zausa, F., proposed a research study applying the indentation technique to attain optimization in drill selection during perforation operations, thus conducting direct analysis on cavings.
-
2007, Mateus, J., Saavedra, N. F., Calderón, Z. H. and Mateus, D., conducted a research work presenting a correlation between indentation parameters and sand stones in Colombia.
Based on the above, this research focuses on correlations between indentations parameters and (UCS) conducted for upwelling shale samples so the hydrocarbon industry can have a tool that in real time evaluates (UCS) by simply conducting indentation techniques on cavings.
These correlations are expected to help engineers apply their criteria in the field in order to make decisions during the drilling process, considering that correlation-based (UCS) values can hardly become exact and precise indicatives of rock strength in this case. Nevertheless, reliable and close enough to reality shale average strength values can be obtained. This facilitates decision-making in reservoir stability control.
METHODOLOGY
The correlation methodology consisted in the conduction of two laboratory tests known as the Non-confined Compression Test and the Indentation Test, The first one was used for measuring UCS on shale cylinders obtained from the Paja formation. The indentation technique was used for measuring test parameters on small shale fragments obtained from surroundings where each plug was extracted. Results of both tests were finally correlated among them using the minimum square technique, which are showed in two graphs. In the first graph, the horizontal axis represents the indentation parameter values known as Indentation Module (IM). The vertical axis represents UCS values, in the Second graph the horizontal axis shows the Indentation parameter known as Critical Transition Force (CTF) while the vertical axis represents UCS values. Correlations obtained had the follow form "y = ax2 + bx" where y represents UCS and x represents IM and CTF for both correlations.
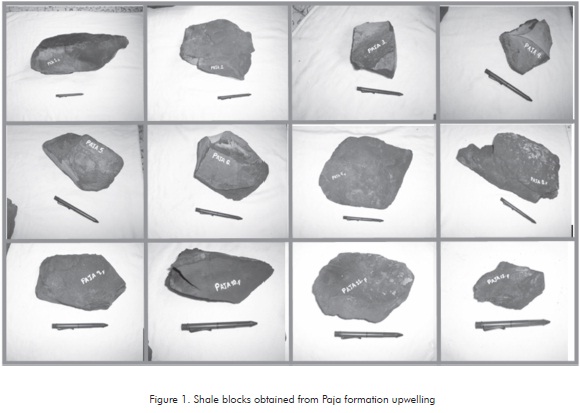
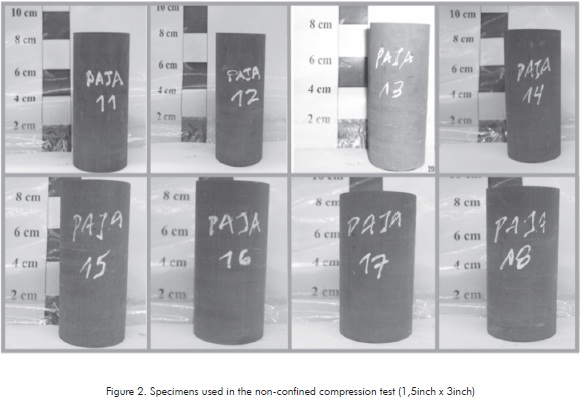
Shale samples used in correlations were obtained from the Paja formation upwelling located on the Barichara creek, between the municipalities of Cabrera and Barichara, at the Guanentá province, Department of Santander, Colombia. This formation exhibited consolidated shale samples with variable strength. In total, twelve small shale blocks were obtained from that upwelling (Figure 1). Then, eight plugs measuring 3 inches length and 1,5 inches diameter were obtained from these blocks (Figure 2). These plugs were utilized for direct (UCS) measurement in the Non-confined Compression test. Mineralogical characterization of samples was conducted by X - ray analysis for three samples that failed the Unconfined Compression Test representing the variability of strengths obtained. Regarding the indentation technique, two hundred shale fragments were obtained in order to have material available for test repetitions. Repetition is justified since this is an indicative test where parameters obtained are average or central - trend measures of the data series used for each specimen. The number of repetitions per specimen was determined at the experimental test design phase (See the Experimental Design Section).
NON - CONFINED COMPRESSION TEST
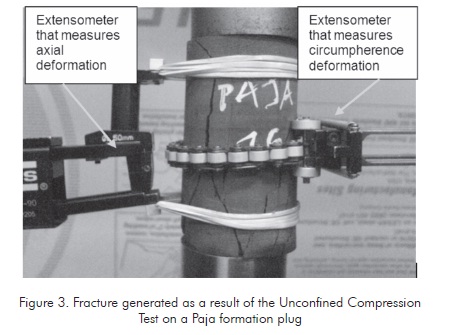
The non-confined compression test consists in introducing each rock cylinder into a load machine known as the Rock Mechanics Test System (MTS), model 815. This is the most commonly used equipment for this test. The machine is available at the Rock Mechanics Laboratory of Instituto Colombiano del Petróleo (ICP). Once the sample is placed within the load cell with a confining pressure equals to zero, axial load is applied until the rock cylinder cracks (Figure 3). This is one of the most convenient and useful test for rock property determination. It specifically measures the Unconfined Compressive Strength (UCS), the Young's elastic module, and the Poisson ratio. Axial and circumferential deformation meters are added to the test. These devices can be extensometers, LVDT'S or stain gages (Figure 3).
INDENTATION TEST
The Indentation Test is an innovative laboratory test that allows the measurement of rock mechanical properties on perforation fragments or cavings. The test is popular for the characterization of rock mechanical properties due to:
- Test simplicity.
- Short time required for completion.
- Low cost compared to other mechanical tests.
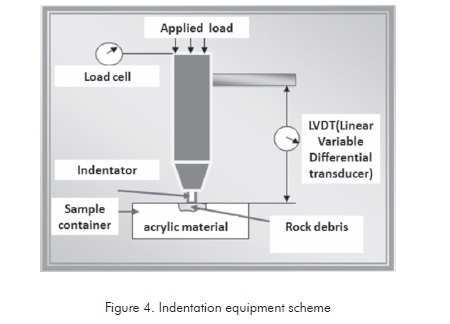
In the indentation test, a load is applied to a body and the mechanical response of such body to this load is registered. This test records the strength of rock fragments upon penetration with a flat-tip standard indentator that, in turn, applies some load. The indentator is a solid mechanical piece, with cylindrical shape and a long, flat tip that measures 0,5 mm length and 1 mm diameter.
The indentation test is conducted on irregular rock fragments inserted in a container made of acrylic material that provides support to the samples when the indentator load is applied on them.
Each container had 5 shale fragments measuring 5 mm in length, height, and depth. The indentator applies a load until it penetrates 0,3 mm in each fragment. This force is enough to observe the elastic and plastic behavior of samples. Results are graphed in a load vs. displacement curve. The penetration velocity is 0,01 mm/sec for shale samples.
The necessary equipment for the indentation test is illustrated in the Figure 4. Two devices conform the indentation test: the first one is a load cell that allows the constant recording of the applied load during the test; the second device consists of a LVDT (Linear Variable Differential Transducer), that records the indentator penetration depth in the rock. The constant monitoring and logging of these parameters completes the indentation test. (Zausa et al., 1997)
Experimental design
Since the indentation test is an index test, the measured parameters must be the result of central trend measurements from a series of data obtained for each sample or section. This number of repetitions is known in statistics as sample size and depends on the 100(1-α)% level of reliability sought for the results and on the amplitude of the confidence interval, that is, the maximum acceptable error (E). Once both parameters have been defined, the sample size required can be obtained based on the average standard deviation according to results of the indentation test in shale samples. It was possible to establish that the average standard deviation of the indentation module for low-consolidation shale samples was 750,09 N/mm in preliminary indentation tests conducted on shale fragments obtained from drilling processes at the Colombian eastern planes. This value, together with expected errors E = 300N/mm for a Level of Confidence of 95% made it possible to calculate the number of tests required to obtain indentation module values as well as average critical transition force values CTF and IM using the following statistical formula:
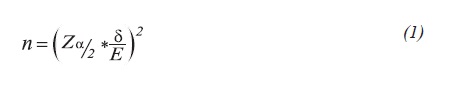
Where:
n = Number of tests.
Zα/2 = Critical value or standard normal distribution point
δ = Sample standard deviation
E = Expected error in the confidence interval
Results for shale samples used in preliminary tests show that 25 indentation tests are necessary for low-consolidation shales in order to obtain an average value within the confidence interval given by the average 300 N/mm. 25 repetitions were applied for the consolidated samples from the Paja formation. This ensures an increase in result confidence.
Sample preparation for the Indentation test
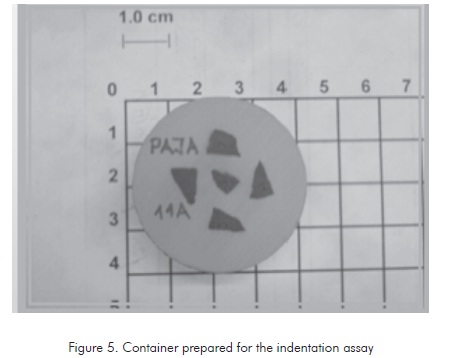
As mentioned above, the Indentation Test is conducted on small rock fragments obtained from the rock surrounding each plug. Therefore, the implementation of a mechanism containing rock fragments or cavings that provides support for the indentation test is necessary. This is achieved by designing specific containers made of an acrylic-type resin used in dentistry that allow the encapsulation of shale fragments as it is illustrated in Figure 5.
Result of the Indentation Test (The Indentation Curve)
The indentation test yields a graph that compares Load (N) vs. Penetration (mm) (Figure 6). This graph is very similar to the conventional stress vs. deformation graph. They only differ in that the indentation test does not utilize large-size samples or containers with known dimensions but, on the contrary, small irregular samples are encapsulated appropriately.
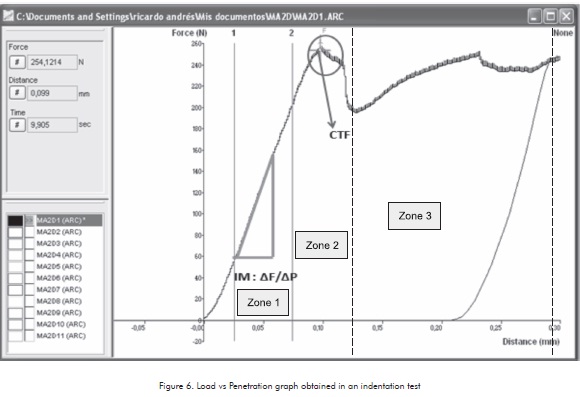
Three distinguishable zones are evident in the Load Vs. Penetration graph: the First zone is known as the Proportionality Area where the rock sample exhibits its elastic behavior. This is represented by a straight line. The Indentation Module (IM) is determined in this zone.
-
Indentation Module (IM): This corresponds to the slope at the proportionality or elastic-behavior zone of rock samples and it is defined as the rock resistance to be penetrated by an indentator.
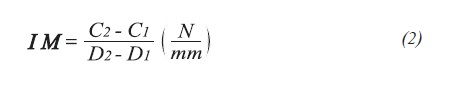
Where C1 and C2 are the initial and the final load, respectively and D1 and D2 are the final and initial displacements for the proportionality zone, respectively.
Second Zone is known as the Transition Area where the rock goes from its elastic state to a plastic or irreversible deformation state without considerable increase of applied load. The second indentation parameter known as the CTF is determined in this area.
-
Critical Transition Force (CTF): It is the point where linearity is lost in a load vs. displacement graph. This point, shown in Figure 6, is measured in Newtons (N) and marks the place where the rock stops having an elastic behavior and starts its plastic property.
Finally, the third Zone in the Load vs. Indentator displacement graph is known as the Fracture Area. In this area, the rock or cavings deforms in an irretrievable manner and fractures due to the fact that this is a totally plastic region where rock deformation is not proportional to the load applied.
TEST RESULTS
Results of the Unconfined Compression Test
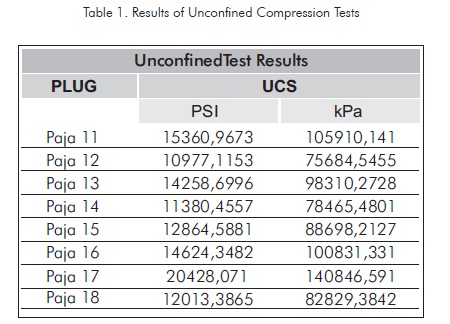
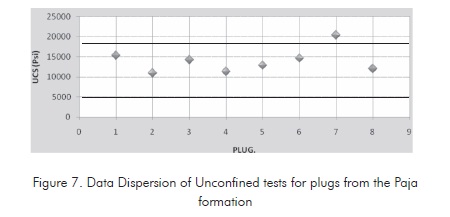
Test results are shown in Table 1 and data dispersion is illustrated in Figure 7. Based on that, the results cover a range of approximately 10000 Psi. This result variation is normal according to the Canadian Ministry of Mining (Obert & Duvall, 1967). These authors conducted multiple assays to determine the UCS of different rock types, including shales. This study concludes that shale strength is between an approximate range of 10900Psi - 33500Psi. This value can decrease in low-consolidation samples and in samples affected by the contact with drilling fluids, water, microfractures generated by subsoil stress, among other factors affecting shale strength.
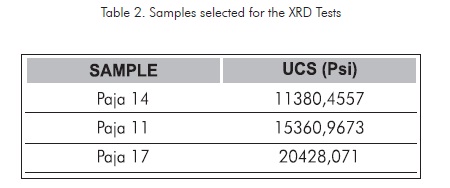
X-ray diffraction tests (XRD) were conducted on three plugs that had failed the Unconfined compression test in order to determine if the composition of the Paja formation samples extracted from the same upwelling was significantly different among them, considering that this composition affects UCS results. UCS values are presented in Table 2.
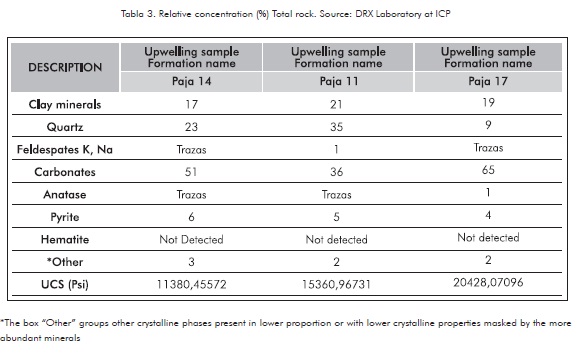
Results of the XRD test
Results are summarized in Tables 3 and 4. The crystalline phase concentration is presented in percentage terms. It is observed that, taken the rock as a whole, the samples analyzed are mainly composed of Carbonates, Quartz, and Clay. Carbonates are mainly of the calcium type (calcites) although low concentration of dolomite is observed. Regarding accessory minerals, feldespates (especially potassium feldespate), anatase, and pyrite are observed. Clay is found at similar concentration (20% weight of the total) in all samples.
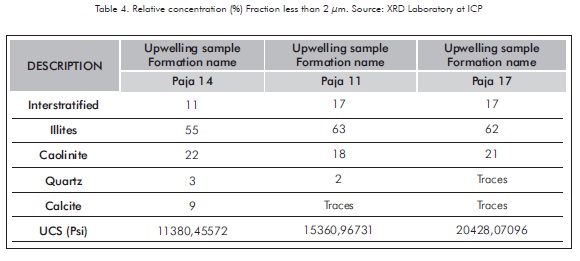
Similar mineralogical composition was observed in the fraction measuring less than 2 microns. The predominant clay type is illites. Interstratified material corresponds to illite possibly altered by smectitic layers due to the slight displacement of their reflection observed after the solvatation process with ethylenglycol characteristic of the inflatable material. Furthermore, the presence of Caolinite and low proportion of microcrystalline quartz was observed.
Based on the results of the XRD tests, it can be stated that the samples, in general terms, possess similar composition. This means that the samples contain the same minerals although some of them are present at different concentrations. Nevertheless, the samples do not show a significant relation to the strength of each analyzed sample. Therefore, the sample composition does not represent a determinant factor in this case regarding the difference in strength values found in the Paja formation samples. Differences, then, can be due to physical alteration of samples due to the stress experienced during the migration process to the surface.
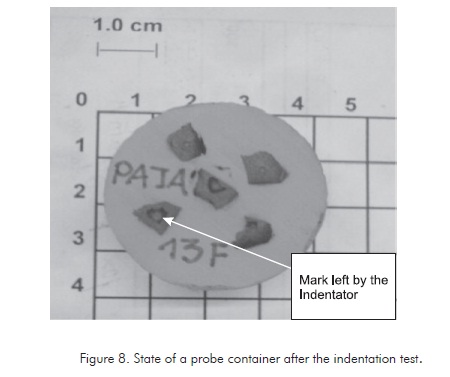
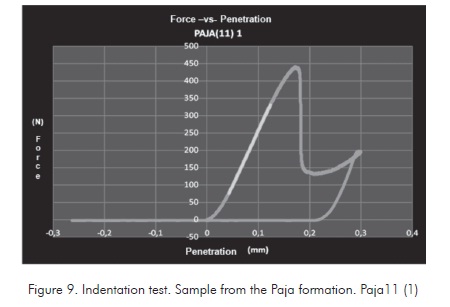
Results of the Indentation tests
The 40 containers with 5 shale fragments each were submitted to the indentation assay. The marks left by the indentator on the shale fragments can be observed in Figure 8. Figure 9 shows a Load vs Indentator Displacement curve for one of the samples assayed named Paja 11(1). The total of 200 curves results from 25 curves found per each of the 8 samples assayed under the non-confined compression test. The Indentation Module (IM) and the Critical Transition Force (CTF) were determined for each sample.
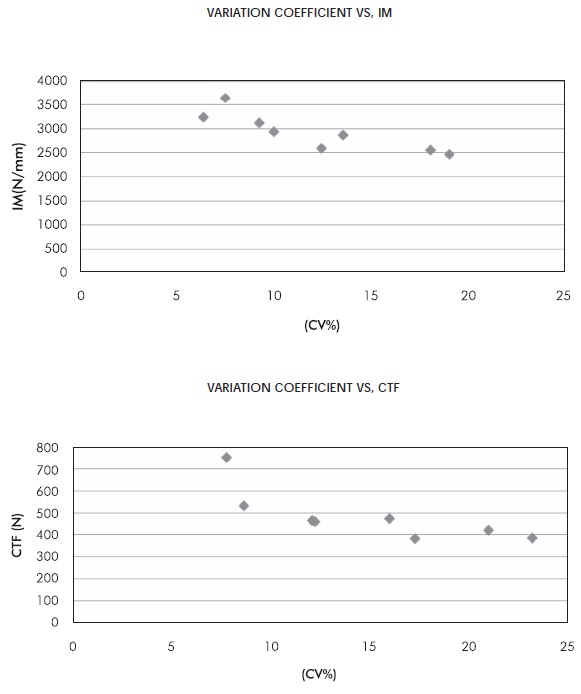
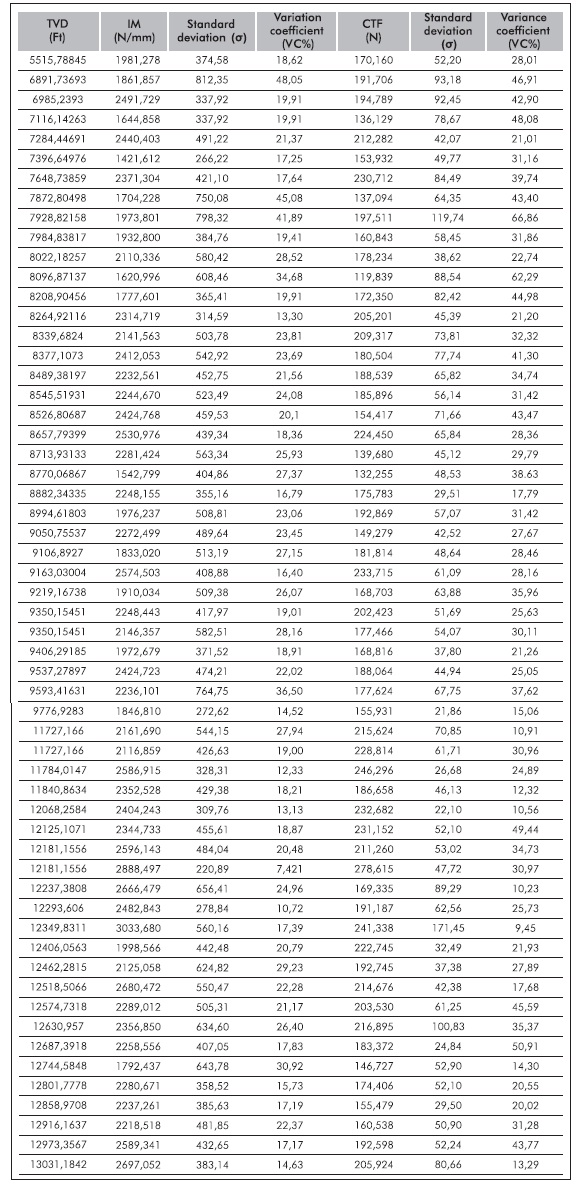
The indentation parameters calculated for each shale sample are central trend measures (Medians) of the data series corresponding to each sample. Such data series has an associated standard deviation that defines the data variation interval or how far from the average data are with regard to the central trend. Therefore, the Indentation Module (IM) and the Critical Transition Force (CTF) of a shale sample represents a value interval given by the average plus or minus the standard deviation. The average values corresponding to the indentation parameters, their standard deviation (σ) and the variation coefficients (VC%) are summarized below (Table 5).
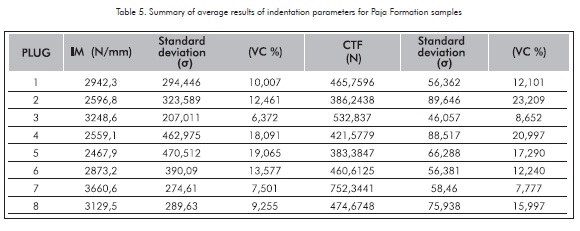
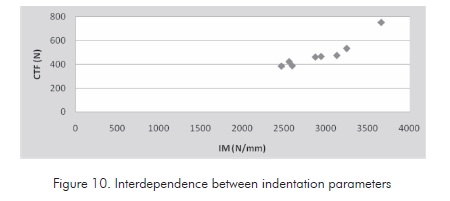
According to these results, the two Indentation Parameters are very interdependent among them. This means that results vary in a similar manner. This is illustrated in Figure 10. It is concluded that data dispersion decreases as high Indentation parameters are obtained. This can be observed in the graphs included in Annex 1. This is probably due to the fact that samples with low indentation parameter values in one formation belong to samples with a greater degree of exposure to the environment than those samples with high indentation parameter values. It is therefore recommended to include a greater number of repetitions in the samples with low indentation parameter values. However, none of the indentation test results (Table 4) show high variation coefficients with regard to the average value. For Critical Force of Transition (CTF), the Variation Coefficients (VC%) are within the range from 7,7% and 23,2% and for Indentation Modules (IM), the Variation Coefficients (VC%) are within the range from 6,4% and 19,1% . This is due to the appropriate implementation of the experimental design proposed fort this test that ensures result reliability.
Construction of Experimental Correlations
Data from the Indentation Module (IM) were correlated to their corresponding UCS data (Table 5). Linear and polynomial regression procedures were conducted in such data series, as follows:
y = ax + b
y = ax2 +bx
Where
y =UCSx = IM
R2 = Correlation coefficient or covariance.
The representative level of the statistical model is measured by the correlation coefficient or covariance R2. This means that a covariance 1 model corresponds to a data series that coincides in a straight line.
Lineal and polynomial regression procedures were conducted by the minimum square method whose objective is to find a statistical model that relates as many points as possible so distances between the correlation function and each point is minimum. The linear and polynomial regression results are shown as follows:
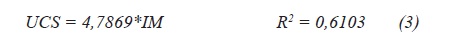
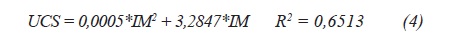
These functions can be represented graphically as positive-slope lineal regressions. (Figure 11 and Figure 12).
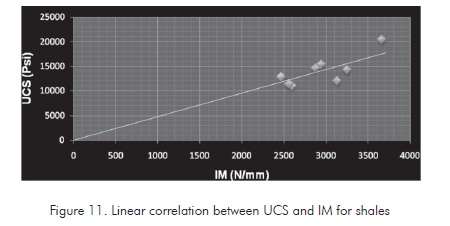
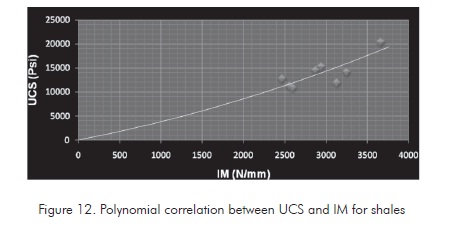
The polynomial correlation was selected as the best measure to illustrate the relation between the UCS values and the IM for the Paja formation samples, based on the covariance degrees for linear and polynomial correlations. However, the correlation degree between the IM and UCS values is not high enough. This is partially due to the low data cloud composing the correlation and the uncertainty associated to the test results on laminated shales.
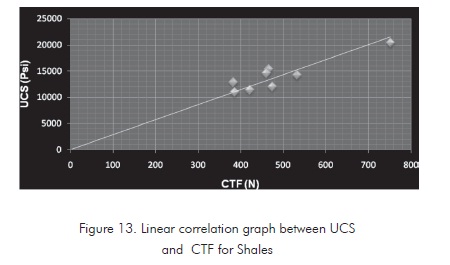
CTF values were correlated to their corresponding UCS data (Table 5). Lineal and polynomial regressions were conducted on such data series, as shown below:
y = ax + b
y = ax2 +bx + c
Where:
y =UCS
x = CTF
R2 = Coefficient correlation or covariance
Linear and polynomial regression procedures were conducted for this indentation parameter using the minimum square method. The linear and polynomial regression results are reported as follows:
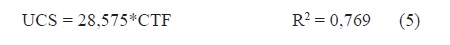
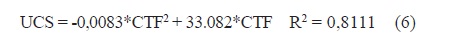
These functions can be represented graphically as positive-slope lineal regressions. (Figure 13 and Figure 14).
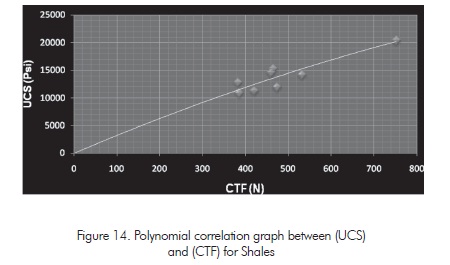
Based on the covariance degrees obtained for the lineal and polynomial correlations, the polynomial
correlation was selected as the best measure representing the relation between UCS and CTF for the Paja formation samples. This correlation exhibits a higher covariance degree even though this degree is still low to consider this correlation like the one modeling shale UCS from indentation tests. Nevertheless, up to the publication of this paper, this correlation degree of applicability has been satisfactory thus proving the existence of correlation between this indentation parameter and UCS.
Application of correlations on shale samples from oil wells
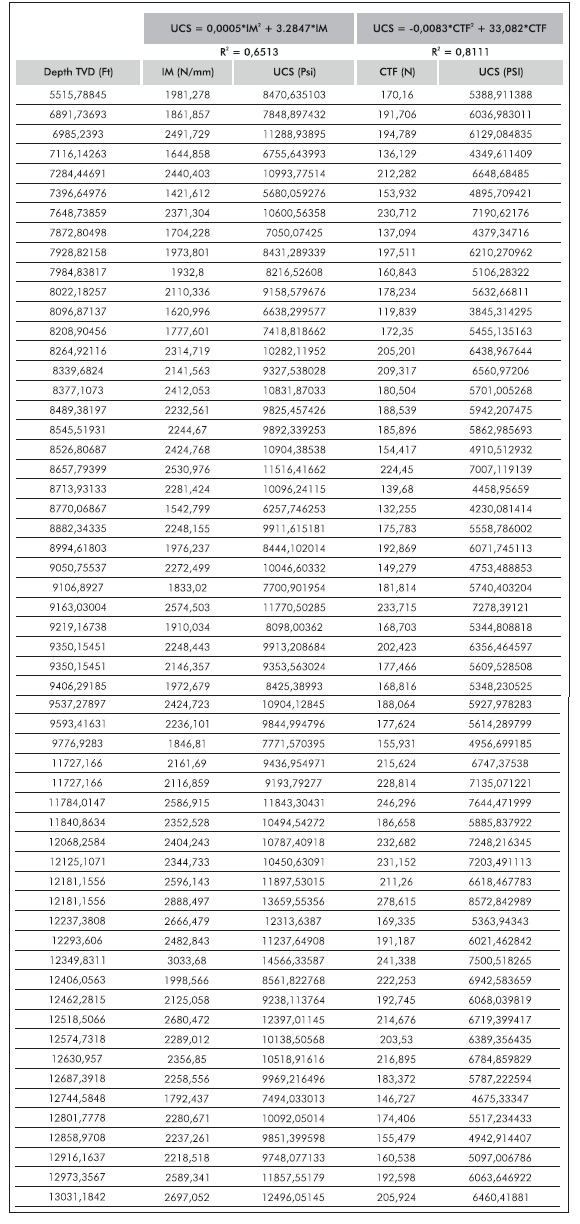
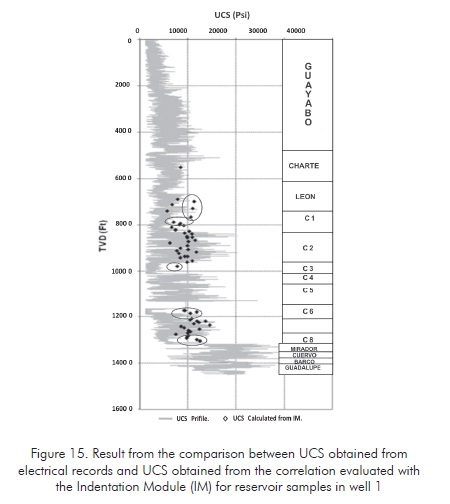
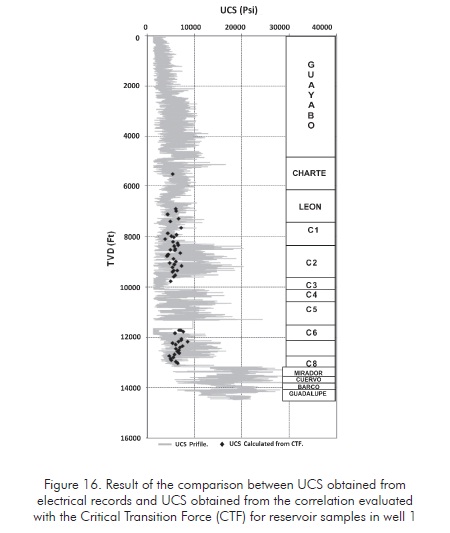
The samples used in indentation tests for this reservoir correspond to shale fragments or cavings taken at different depths as products of reservoir instability and not as an effect of the perforation drill. Results of the indentation tests for TVD indepth rock fragments are summarized in the Annex 2. Since the shale samples extracted at different depths were not enough to conform to the repetition requirement, set out in the experimental design (25 repetitions), some of these depth values exhibit 10 tests only which generates uncertainty regarding the central trend measure. The results of the IM presented in the Annex were evaluated in the correlation obtained for UCS from this IM parameter (Equation 4) and the results of the Critical Transition Force were evaluated in the correlation obtained for UCS from this parameter CTF. (Equation 6). Results of these UCS evaluations are presented in Annex 3.
The values obtained for in-depth UCS were compared to the UCS values evaluated for the same reservoir using the DTC-DTS sonic record system and Vshale data obtained from the first Gamma ray lithological record run in the reservoir. The parameters evaluating UCS can be obtained from these records in order to find the profiles. Such comparisons are presented in Figure 15 and Figure 16 where also include formations to which UCS points obtained through correlations belong to.
RESULT DISCUSSION
According to the curves (Figures 12 and 14), corresponding to the selected correlations for the characterization of shale strength, the parameters obtained from the indentation test indicate rock strength since as IM and CTF increase, their corresponding UCS also increases for the same shale sample and viceverce. New correlation points are being included and the corresponding results shall be published in due time.
When comparing correlation coefficients or covariance R2 for the two selected correlations described by Equations 4 and 6, improved correlation between CTF and UCS is observed. This observation was also obtained by Ringstad et al. (1998) on different rocks. This is due to the physical similarity of Unconfined compression tests (non confined compressive test) and indentation since both tests are based on the application of a load to find out the maximum specimen strength. Therefore, the parameter known as Critical Transition Force is comparable to the Unconfined Compressive Strength UCS in rocks (shales, in this particular case).
Result analysis for Figure 15 indicates that the correlation between UCS and IM obtained for Paja formation samples overestimate the UCS values for shale fragments of other formations with low IM (IM<2000N/ mm). This is due to the fact that the IM data utilized in the construction of correlations were high (Table 5) yielding the correlation mentioned (Equation 4). This is recommended to be used when the Indentation Module (IM) values for shale samples to be assayed fall within the range 2500N/mm-4000N/mm.
Based on the results obtained (Figure 16), the correlation to evaluate UCS from the CTF, is more reliable for the estimation of UCS values for high-range CTF since Paja formation shale samples used in correlation construction show high CTF (Table 5) while the CTF values for this reservoir were low (110N-280N). This confirms the good applicability of this correlation which is demonstrated by the greater correlation degree (R2), compared to the value obtained for the correlation between IM and UCS.
CONCLUSIONS
-
Based on the results from Indentation tests conducted on samples obtained from the Paja formation, Indentation parameters (IM) and (CTF) show interdependence, that is, as one value increases, the other increases too and viceverce. (Figure 10). The indentation parameters measured on highconsolidation rocks show low dispersion. On the contrary, low-consolidated samples exhibit a greater degree of dispersion.
-
According to the covariance obtained for the linear and polynomial correlations in this research Project, the polynomial correlation was chosen as the best procedure representing the relation between (UCS) values and Indentation parameters (IM) and (CTF) for Paja Formation samples. This is proven by the correlation coefficient (R2) whose value is 0,6513 for the correlation between the Indentation Module (IM) and (UCS). This value is 0,8111 for the correlation between the Critical Transition Force (CTF) and (UCS). Based on the above, it can be concluded that there is a good correlation between the indentation test parameters and the strength values which is proven with the correlation coefficient (R2).
-
When comparing the covariance degree of the two correlations obtained in this research work, it can be concluded that there is a greater correlation between CTF and UCS for the 8 shale samples assayed. This conclusion was also reached by Ringstad et al. (1998) on rocks belonging to different lithologies.
-
The (UCS) values obtained from correlations in the field or in any other engineering - related application do not represent an exact value of the rock property. These values have to be interpreted as average values are considered by engineers in their decision-making processes, the same as with the values obtained from well logging.
-
The use of the correlations developed in this research work exhibit great potential when determining UCS of clay formations in a precise manner where electrical logging data do not exist or representative rock simples are not available. In these cases, this represents a very practical and helpful tool since the equipment used in this indentation test is portable so it can be placed according to the location of the reservoir. Therefore, characterization of shale UCS in real time during the drilling process is possible by using these correlations.
ACKNOWLEDGMENTS
The authors express their gratitude to the Instituto Colombiano del Petróleo (ICP) Ecopetrol S.A, Universidad Industrial de Santander and especially, to the Wellbore Stability team for their technological and scientific support during the development of this work.
REFERENCES
Abass, H., A. et al. (2006). Wellbore Instability Of Shale Formation; Zuluf Field, Saudi Arabia. Technical Symposium of Saudi Arabia Section, Dhahran, Saudi Arabia, May 21-23. SPE 106345. [ Links ]
Jaramillo, R. A. (2004). Planteamiento de un modelo Geomecánico Estadístico para el estudio de la estabilidad durante la perforación en el Piedemonte Llanero Colombiano. Tesis profesional Fac. Minas, Universidad Nacional de Colombia, sede Medellín. [ Links ]
Mateus, J., Saavedra, N. F,. Calderón, Z. H., & Mateus, D. (2007). Correlation development between indentation parameters and unaxial compressive strength for Colombian sandstones. CT&F - Ciencia Tecnología y Futuro, 3 (3), 125-135. [ Links ]
Obert. L., & Duvall, W. (1967). Rock Mechanics And The Design Of Structures In Rock. John Wiley & Sons. [ Links ]
Ringstad, C., Lofthus, E. B., Sonstebo, E. F., Fjær, E., Zausa, F., & Giin-Fa Fuh. (1998). Prediction of rock parameters from micro-indentationmeasurements: The Effect of sample size. EUROCK'98, Trondheim, Norway, July 8-10. SPE 47313. [ Links ]
Santarelli, F. J., Marshala, A. F., Brignoli, M., Rossi E., & Bona N. (1996). Formation Evaluation from Logging on Cuttings. SPE, Proc. Eur. Petrol. Conf., Milano. SPE 36851 [ Links ]
Uboldi, V., Civolani, L., & Zausa, F. (1999). Rock Strengh Measurements on Cutting as input data for Optimizing Drill Bit Selection. SPE Annual Technical Conference and Exhibition, Houston, Texas, October 3-6. SPE, ENI. [ Links ]
Winters , W. J., Warren , T. M., & Onyia , E. C. (1987). Roller Bit Model With Rock Ductility and Cone Offset. SPE Annual Technical Conference, Dallas TX. SPE 16696. [ Links ]
Zausa, F., Civolani, L., Brignoli, M. & Santarelli, F. J. (1997). Real timewellbore stability analysis at the rigsite. SPE/IADC Drilling Conference, Amsterdam, The Netherlands, March 4-6. SPE 37670. [ Links ]